Submit an Article
Navigate
Home
Editorial Board
Editorial Policies
Current Volume
Archive
Scientific Integrity
Publication Ethics Statements
Interviews with Outstanding Authors
Newsroom
Sponsored Conferences
Podcast
Contact
Special Collections
Submit an Article
Online ISSN: 1945-4589
Research Paper
|
Volume 12, Issue 2
|
pp. 1104–1113
Body mass index and albumin levels are prognostic factors for long-term survival in elders with limited performance status
Back to article
Figure 2
(2 of 2)
−
100%
+
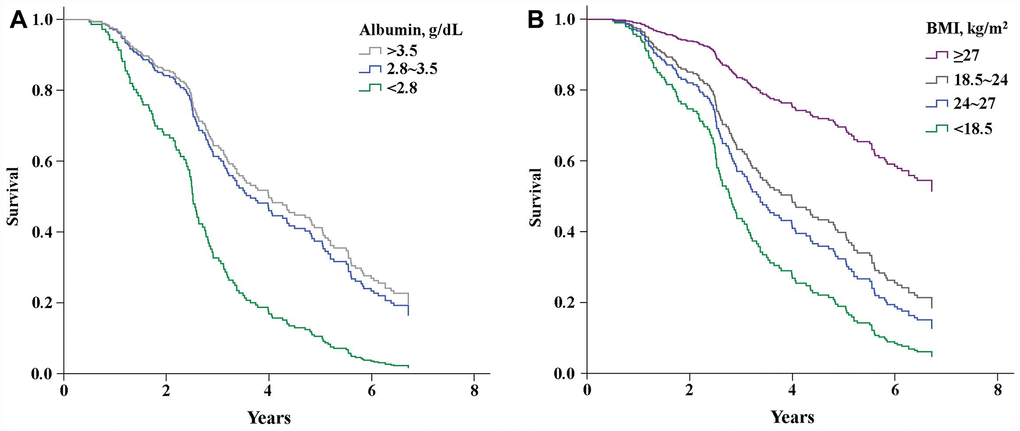
Figure 2.
Kaplan-Meier curves showing the effects of serum albumin levels (
A
) (P<0.001) and BMI (
B
) (P<0.001) on survival.