


Introduction
According to the global cancer statistics released in 2018, gastric cancer (GC) is the fifth most commonly diagnosed cancer type and the third leading cause of cancer-related mortality worldwide [1]. Although the popularization of gastroscopy has improved the survival of GC patients, the prognosis of patients with advanced GC remains poor due to tumor metastasis and recurrence [2]. The identification of markers associated with tumorigenesis and cancer progression may enable the early detection of GC.
Whole-genome sequencing has revealed that over 90% of the genome is actively transcribed, but 98% of the transcripts have no potential to encode proteins [3]. Among these non-coding transcripts, long non-coding RNAs (lncRNAs), which include at least 200 nucleotides, have attracted more and more attention [4]. LncRNAs have been found to regulate gene splicing, chromatin organization and gene transcription [5]. The dysregulation of lncRNAs is involved in a range of diseases, including cancers [6–8]. LncRNAs have been reported to promote the growth, metastasis and drug resistance of cancer cells [9–11].
Aberrant lncRNA expression is associated with GC development, and lncRNAs may serve as tumor suppressors or oncogenes in GC [12]. For instance, the lncRNAs HOTTIP, GAPLINC and AK023391 are independent predictors of poor survival and are also potential diagnostic markers in GC patients [13–15]. The lncRNAs PVT1, GClnc1 and AGAP2-AS1 have been reported to promote the proliferation and invasion of GC [16–18], while linc00261 and MEG3 serve as tumor suppressors in GC [19, 20]. LncRNAs stimulate the pathogenesis of GC through their participation in key signaling pathways. For example, the lncRNAs ADAMTS9-AS2, HOTAIR and ZEB2-AS1 induce GC tumorigenesis through the phosphatidylinositol 3-kinase (PI3K)/AKT, NF-κB and Wnt/β-catenin signaling pathways, respectively [21–23].
Herein, we found that increased expression of the lncRNA SNHG12 reduced the overall survival of GC patients and promoted GC tumorigenesis by activating the PI3K/AKT pathway. Thus, SNHG12 could be used as a biomarker to predict poor survival in GC patients.
Results
SNHG12 is upregulated in human GC and is associated with a poor prognosis
In this study, we first compared the RNA expression data of GC and adjacent normal tissues from the Gene Expression Omnibus (GSE51575). As expected, various lncRNAs were aberrantly expressed in GC tissues (Figure 1A). We focused our attention on upregulated lncRNAs, as they may be more suitable than downregulated lncRNAs for use as early diagnostic markers in cancer patients [2]. Among the overexpressed lncRNAs in GC tissues, SNHG12 was highly abundant, and thus was selected for further study. We then analyzed SNHG12 expression in two independent cohorts downloaded from The Cancer Genome Atlas (TCGA) and GSE37023. SNHG12 was dramatically upregulated in unpaired and paired cancer tissues compared with para-cancerous tissues, both in GC (Figure 1B) and in other malignancies (Supplementary Figure 1).
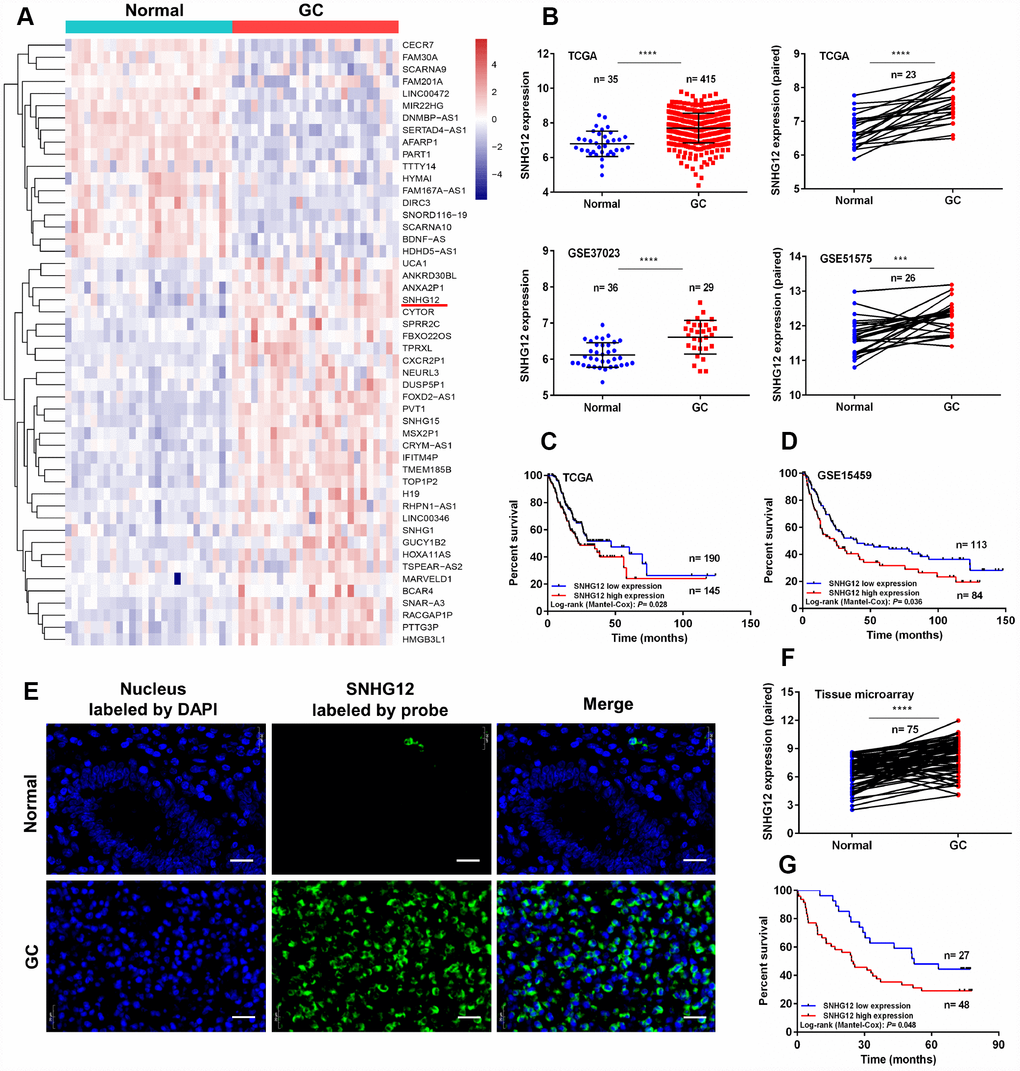
Figure 1. SNHG12 is upregulated in human GC and is associated with a poor prognosis. (A) Hierarchical heat map of differentially expressed genes between GC and para-cancerous tissues from the Gene Expression Omnibus database. Blue denotes downregulated genes and red denotes upregulated genes. (B) SNHG12 levels were detected in unpaired and paired GC tissues from TCGA, GSE37023 and GSE51575 cohorts. (C, D) Kaplan-Meier analysis of the association between SNHG12 expression and overall survival in GC patients, based on TCGA and GSE15459 cohorts. (E, F) FISH analysis of the subcellular localization and expression of SNHG12 in GC and para-cancerous tissues. The nucleus was labeled with DAPI (blue) and SNHG12 was labeled with a probe (green). Scale bar: 20 μm. (G) Kaplan-Meier analysis of the association between SNHG12 expression and overall survival in GC patients, based on the tissue microarray. ***P<0.001, ****P<0.0001.
Next, we analyzed the correlation between SNHG12 expression and clinicopathological factors in patients with GC. We used Cutoff Finder to divide the GC patients from TCGA into low and high SNHG12 expression groups [24]. SNHG12 expression correlated with the tumor invasion depth (P = 0.009), but had no relationship with other clinical factors in GC patients (Table 1). Kaplan-Meier analysis revealed that survival was poorer in GC patients with high SNHG12 expression (median survival time: 22.50 months) than in those with low SNHG12 expression (median survival time: 46.90 months) (P = 0.028, Figure 1C). Similar results were obtained from a Kaplan-Meier Plotter analysis (P = 0.036, Figure 1D) [25].
Table 1. The correlation between SNHG12 expression and clinicopathological factors in GC patients.
| Characteristics | Number of cases | Expression of SNHG12 | P value* | ||||||||||||||||||||||||||||||||||||||||||||||||||||||||||||||||||||||||||||||||||||||||||||||||
| Low | High | ||||||||||||||||||||||||||||||||||||||||||||||||||||||||||||||||||||||||||||||||||||||||||||||||||
| Gender | 0.777 | ||||||||||||||||||||||||||||||||||||||||||||||||||||||||||||||||||||||||||||||||||||||||||||||||||
| male | 212 | 119 | 93 | ||||||||||||||||||||||||||||||||||||||||||||||||||||||||||||||||||||||||||||||||||||||||||||||||
| female | 123 | 71 | 52 | ||||||||||||||||||||||||||||||||||||||||||||||||||||||||||||||||||||||||||||||||||||||||||||||||
| Age | 0.312 | ||||||||||||||||||||||||||||||||||||||||||||||||||||||||||||||||||||||||||||||||||||||||||||||||||
| ≤ 60 | 114 | 69 | 45 | ||||||||||||||||||||||||||||||||||||||||||||||||||||||||||||||||||||||||||||||||||||||||||||||||
| > 60 | 221 | 121 | 100 | ||||||||||||||||||||||||||||||||||||||||||||||||||||||||||||||||||||||||||||||||||||||||||||||||
| Histological grade | 0.234 | ||||||||||||||||||||||||||||||||||||||||||||||||||||||||||||||||||||||||||||||||||||||||||||||||||
| Low | 213 | 126 | 87 | ||||||||||||||||||||||||||||||||||||||||||||||||||||||||||||||||||||||||||||||||||||||||||||||||
| Middle + high | 122 | 64 | 58 | ||||||||||||||||||||||||||||||||||||||||||||||||||||||||||||||||||||||||||||||||||||||||||||||||
| Tumor invasion depth | 0.009** | ||||||||||||||||||||||||||||||||||||||||||||||||||||||||||||||||||||||||||||||||||||||||||||||||||
| T1 | 16 | 4 | 12 | ||||||||||||||||||||||||||||||||||||||||||||||||||||||||||||||||||||||||||||||||||||||||||||||||
| T2 + T3 + T4 | 319 | 186 | 133 | ||||||||||||||||||||||||||||||||||||||||||||||||||||||||||||||||||||||||||||||||||||||||||||||||
| Lymph node metastasis | 0.339 | ||||||||||||||||||||||||||||||||||||||||||||||||||||||||||||||||||||||||||||||||||||||||||||||||||
| N0 | 104 | 63 | 41 | ||||||||||||||||||||||||||||||||||||||||||||||||||||||||||||||||||||||||||||||||||||||||||||||||
| N1 + N2 + N3 | 231 | 127 | 104 | ||||||||||||||||||||||||||||||||||||||||||||||||||||||||||||||||||||||||||||||||||||||||||||||||
| Distant metastasis | 0.873 | ||||||||||||||||||||||||||||||||||||||||||||||||||||||||||||||||||||||||||||||||||||||||||||||||||
| M0 | 315 | 179 | 136 | ||||||||||||||||||||||||||||||||||||||||||||||||||||||||||||||||||||||||||||||||||||||||||||||||
| M1 | 20 | 11 | 9 | ||||||||||||||||||||||||||||||||||||||||||||||||||||||||||||||||||||||||||||||||||||||||||||||||
| TNM stage | 0.457 | ||||||||||||||||||||||||||||||||||||||||||||||||||||||||||||||||||||||||||||||||||||||||||||||||||
| I + II | 151 | 89 | 62 | ||||||||||||||||||||||||||||||||||||||||||||||||||||||||||||||||||||||||||||||||||||||||||||||||
| III + IV | 184 | 101 | 83 | ||||||||||||||||||||||||||||||||||||||||||||||||||||||||||||||||||||||||||||||||||||||||||||||||
| *chi-square test; ** P < 0.01, statistically significant results (in bold) | |||||||||||||||||||||||||||||||||||||||||||||||||||||||||||||||||||||||||||||||||||||||||||||||||||
To further explore the prognostic value of SNHG12 in GC, we conducted a univariate Cox regression analysis of potential survival-associated factors. We found that higher SNHG12 expression (P = 0.029), older age (P = 0.008), a greater tumor invasion depth (P = 0.030), lymph node metastasis (P = 0.001), distant metastasis (P = 0.007) and a higher TNM stage (P < 0.001) were associated with poorer survival in GC patients. Multivariate Cox regression analysis of these factors revealed that high SNHG12 expression was a risk factor for poor survival in GC patients (hazard ratio [HR]=1.528, 95% confidence interval [CI]=1.085-2.152, P = 0.015, Table 2).
Table 2. Univariate and multivariate analyses of clinicopathological factors influencing overall survival in GC patients.
| Risk factors | Univariate analysis | Multivariate analysis | |||||||||||||||||||||||||||||||||||||||||||||||||||||||||||||||||||||||||||||||||||||||||||||||||
| HR | P value | 95% CI | HR | P value | 95% CI | ||||||||||||||||||||||||||||||||||||||||||||||||||||||||||||||||||||||||||||||||||||||||||||||
| SNHG12 expression (low, high) | 1.462 | 0.029* | 1.040 - 2.057 | 1.528 | 0.015* | 1.085 - 2.152 | |||||||||||||||||||||||||||||||||||||||||||||||||||||||||||||||||||||||||||||||||||||||||||||
| Age (≤ 60, > 60) | 1.694 | 0.008** | 1.150 - 2.496 | 1.871 | 0.002** | 1.263 - 2.769 | |||||||||||||||||||||||||||||||||||||||||||||||||||||||||||||||||||||||||||||||||||||||||||||
| Tumor invasion depth (T1, T2 + T3 + T4) | 8.843 | 0.030* | 1.236 - 63.293 | ||||||||||||||||||||||||||||||||||||||||||||||||||||||||||||||||||||||||||||||||||||||||||||||||
| Lymph node metastasis (N0, N1 + N2 + N3) | 2.056 | 0.001** | 1.330 - 3.177 | ||||||||||||||||||||||||||||||||||||||||||||||||||||||||||||||||||||||||||||||||||||||||||||||||
| Distant metastasis (M0, M1) | 2.357 | 0.007** | 1.269 - 4.376 | 1.980 | 0.036* | 1.046 - 3.748 | |||||||||||||||||||||||||||||||||||||||||||||||||||||||||||||||||||||||||||||||||||||||||||||
| TNM stage (I + II, III + IV) | 2.082 | < 0.001** | 1.437 - 3.017 | 1.767 | 0.004** | 1.205 - 2.591 | |||||||||||||||||||||||||||||||||||||||||||||||||||||||||||||||||||||||||||||||||||||||||||||
| Histological grade (low, middle + high) | 0.719 | 0.075 | 0.501 - 1.033 | ||||||||||||||||||||||||||||||||||||||||||||||||||||||||||||||||||||||||||||||||||||||||||||||||
| Gender (female, male) | 1.307 | 0.157 | 0.902 - 1.895 | ||||||||||||||||||||||||||||||||||||||||||||||||||||||||||||||||||||||||||||||||||||||||||||||||
| HR: hazard ratio, CI: confidence interval; *P < 0.05, **P < 0.01, statistically significant results (in bold) | |||||||||||||||||||||||||||||||||||||||||||||||||||||||||||||||||||||||||||||||||||||||||||||||||||
To validate the above results, we performed fluorescence in situ hybridization (FISH) analysis to evaluate SNHG12 expression in tissues from another 75 GC patients. SNHG12 was predominantly detected in the cytoplasm, and was markedly upregulated in GC tissues (Figure 1E and 1F). SNHG12 expression correlated with the tumor invasion depth (P = 0.021) and TNM stage (P = 0.013, Supplementary Table 1), and patients with high SNHG12 expression exhibited poorer overall survival than those with low SNHG12 expression (Figure 1G). Univariate and multivariate Cox regression analyses revealed that high SNHG12 expression predicted poor survival in GC patients (Supplementary Table 2).
SNHG12 promotes GC cell growth
To determine the function of SNHG12 in GC cells, we first examined its expression in GC cell lines by performing quantitative real-time PCR (qRT-PCR) analysis. SNHG12 expression was higher in the AGS and MGC-803 cell lines but lower in the BGC-823 cell line than in the GES-1 (normal) cell line (Figure 2A). Thus, we performed knockdown experiments in AGS and MGC-803 cells, and conducted overexpression experiments in BGC-823 cells. A qRT-PCR analysis confirmed that transfection with small interfering RNA (siRNA) for SNHG12 (si-SNHG12) efficiently silenced SNHG12 in AGS and MGC-803 cells, while transfection with an overexpression plasmid (pc-SNHG12) upregulated SNHG12 in BGC-823 cells (Figure 2B).
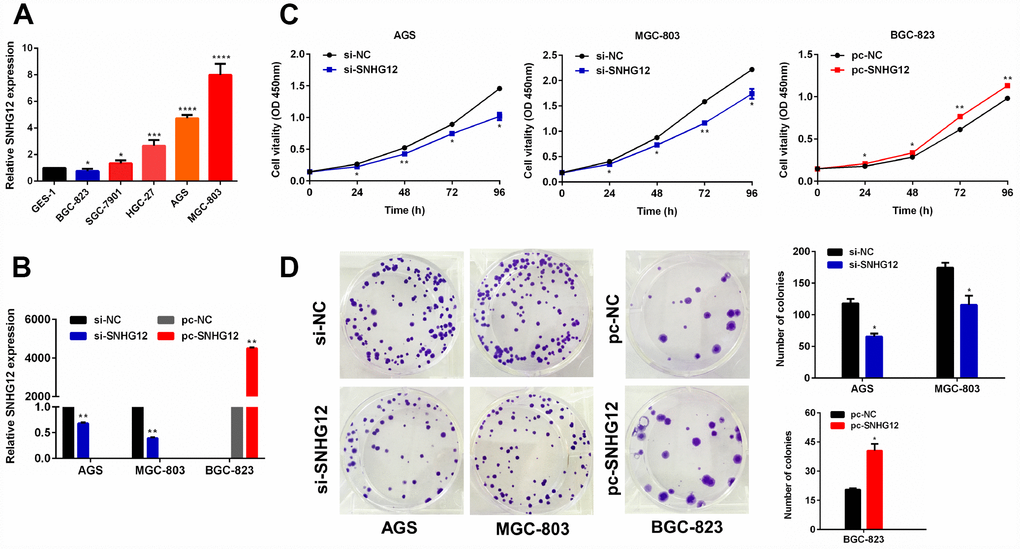
Figure 2. SNHG12 promotes the growth of GC cells. (A) SNHG12 levels in GES-1 and GC cell lines were detected by qRT-PCR. (B) The transfection efficiencies of si-SNHG12 in AGS and MGC-803 cells and pc-SNHG12 in BGC-823 cells were detected by qRT-PCR. (C) A CCK-8 assay was used to detect the proliferation of AGS and MGC-803 cells transfected with si-SNHG12, and of BGC-823 cells transfected with pc-SNHG12. (D) A colony formation assay was used to detect the colony formation abilities of AGS and MGC-803 cells transfected with si-SNHG12, and of BGC-823 cells transfected with pc-SNHG12. Data are shown as the mean ± standard error of the mean (SEM) from at least three experiments. *P<0.05, **P<0.01, ***P<0.001, ****P<0.0001.
We then performed Cell Counting Kit 8 (CCK-8) and colony formation assays in the transfected cells. The knockdown of SNHG12 suppressed cell proliferation and colony formation in the AGS and MGC-803 cell lines, while the overexpression of SNHG12 had the opposite effects in the BGC-823 cell line (Figure 2C and 2D). However, at 18 hours, there was no significant difference in the proliferation of GC cells, regardless of whether SNHG12 was knocked down or overexpressed (Supplementary Figure 2).
SNHG12 promotes the migration and invasion of GC cells
To explore the effects of SNHG12 on GC cell migration and invasion, we performed wound healing and Transwell migration/invasion experiments. The wound healing assay demonstrated that the knockdown of SNHG12 suppressed the migration of AGS and MGC-803 cells, while the overexpression of SNHG12 promoted the migration of BGC-823 cells (Figure 3A). Similar results were observed in the Transwell migration assay: the number of cells passing through the polycarbonate membrane decreased after the knockdown of SNHG12 in AGS and MGC-803 cells, but increased after the overexpression of SNHG12 in BGC-823 cells (Figure 3B). A Transwell invasion assay revealed that knocking down SNHG12 substantially lowered the invasive abilities of AGS and MGC-803 cells, while overexpressing SNHG12 enhanced the invasion of BGC-823 cells (Figure 3C).
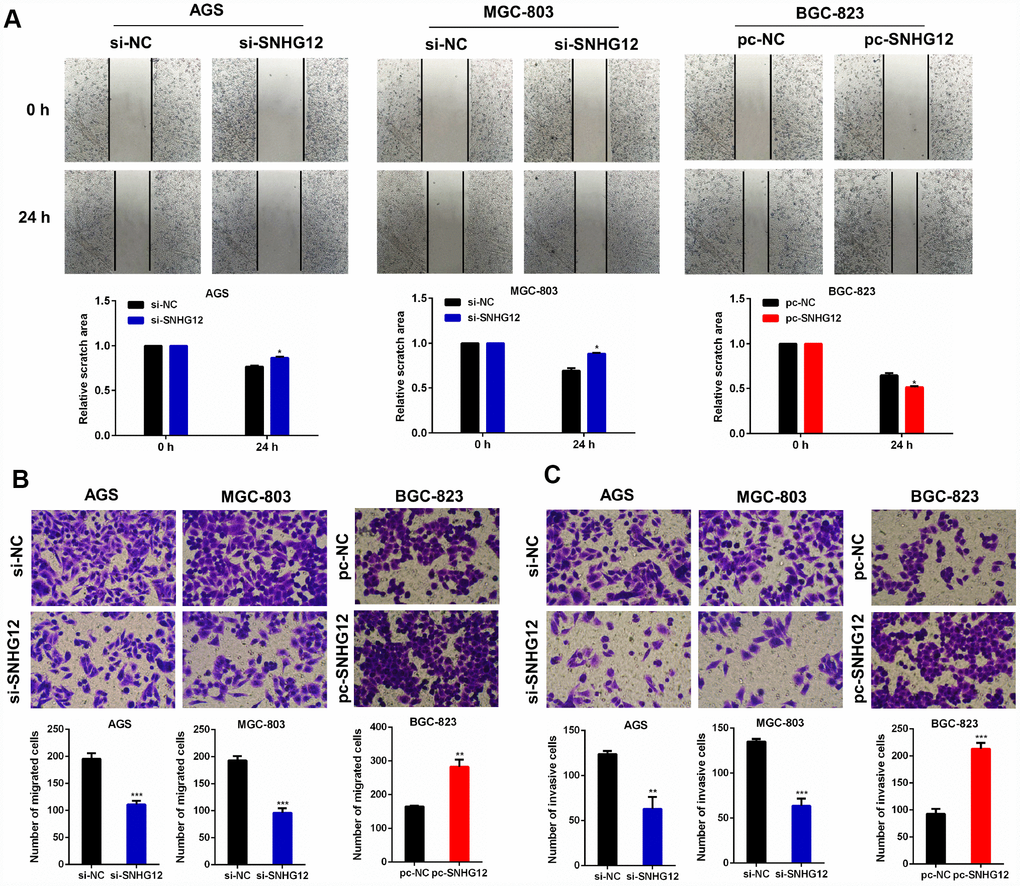
Figure 3. SNHG12 promotes the migration and invasion of GC cells. (A, B) Wound healing and Transwell migration assays were performed to evaluate the migration abilities of AGS and MGC-803 cells transfected with si-SNHG12, and of BGC-823 cells transfected with pc-SNHG12. (C) A Transwell invasion assay was conducted to estimate the invasion abilities of AGS and MGC-803 cells transfected with si-SNHG12, and of BGC-823 cells transfected with pc-SNHG12. The migratory and invasive cells were stained with Hoechst. Data are shown as the mean ± SEM of at least three experiments. *P<0.05, **P<0.01, ***P<0.001.
SNHG12 promotes cell cycle progression and reduces apoptosis in GC cells
The effects of SNHG12 on cell cycle progression and apoptosis in GC cells were evaluated by flow cytometry. The knockdown of SNHG12 in AGS and MGC-803 cells increased the number of cells in G0/G1 phase but reduced the number of cells in S phase and G2/M phase. On the other hand, the overexpression of SNHG12 in BGC-823 cells reduced the number of cells in G0/G1 phase but increased the number of cells in S phase and G2/M phase (Figure 4A). An apoptosis analysis revealed that knocking down SNHG12 promoted apoptosis in AGS and MGC-803 cells, while overexpressing SNHG12 inhibited apoptosis in BGC-823 cells (Figure 4B).
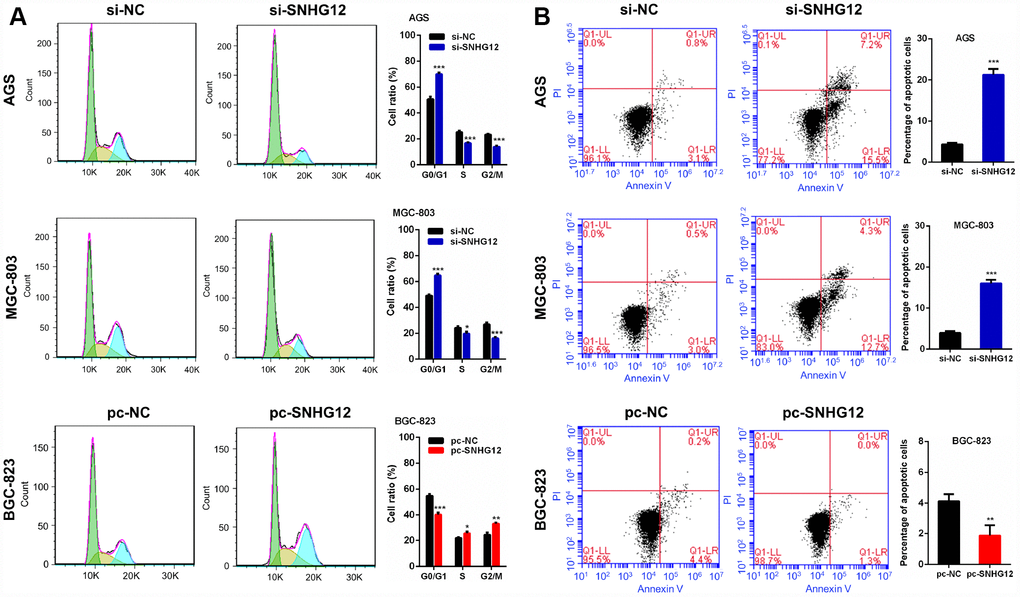
Figure 4. SNHG12 promotes cell cycle progression and reduces apoptosis in GC cells. (A) The cell cycle distribution of AGS and MGC-803 cells transfected with si-SNHG12 and BGC-823 cells transfected with pc-SNHG12. Green, yellow and blue represent the cells in G0/G1 phase, S phase and G2/M phase, respectively. (B) The apoptosis of AGS and MGC-803 cells transfected with si-SNHG12 and BGC-823 cells transfected with pc-SNHG12. Data are shown as the mean ± SEM of at least three experiments. *P<0.05, **P<0.01, ***P<0.001.
SNHG12 activates the PI3K/AKT pathway in GC cells
To comprehensively analyze the pathways regulated by SNHG12 in GC cells, we conducted a cancer pathway microarray analysis in MGC-803 cells. The microarray contained 90 genes, and 26 of them were differentially expressed (fold-change ≥ 1.5, P < 0.05) in the si-SNHG12 group compared with the negative control siRNA (si-NC) group (Figure 5A). The pathway enrichment of these differentially expressed genes was analyzed online in the Database for Annotation, Visualization and Integrated Discovery (DAVID). Kyoto Encyclopedia of Genes and Genomes (KEGG) pathway analysis on the DAVID website revealed that these 26 genes were mainly enriched in eight signaling pathways. The PI3K/AKT pathway had the highest number of enriched genes and the highest enrichment score (Figure 5B and Supplementary Figure 3).
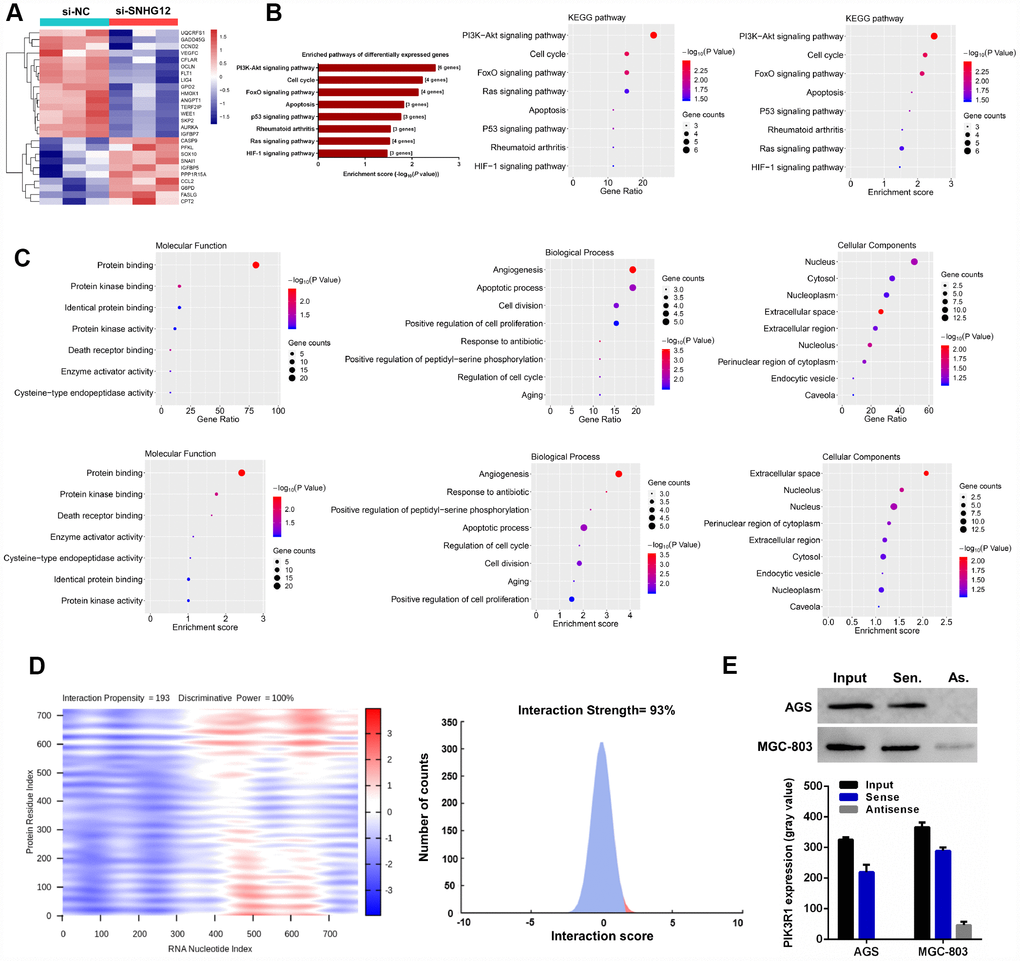
Figure 5. SNHG12 is involved in the PI3K/AKT pathway in GC cells. (A) Hierarchical heat map of differentially expressed genes between si-NC- and si-SNHG12-transfected MGC-803 cells. (B) KEGG pathway enrichment analysis revealed that the differentially expressed genes were mainly enriched in eight pathways. (C) Gene Ontology analysis of the differentially expressed genes. (D) The prediction results demonstrated that SNHG12 was likely to bind to PIK3R1. (E) An RNA pulldown assay was performed to confirm that SNHG12 could bind to PIK3R1 in AGS and MGC-803 cells.
We also performed a Gene Ontology analysis of the differentially expressed genes, including assessments of the biological process, molecular function and cell component (Figure 5C). The biological process analysis indicated that the differentially expressed genes were mainly involved in angiogenesis, apoptosis, cell proliferation and cell cycle regulation. The principal molecular functions of the genes were protein binding, protein kinase binding and protein kinase activity. The genes were mostly localized to the nucleus and cytosol.
To investigate the mechanism by which SNHG12 regulates the PI3K/AKT pathway, we first used online tools to predict whether SNHG12 could directly bind to the regulatory subunit of PI3K (PIK3R1). In such analyses, the interaction strength can range from 0% (non-interacting) to 100% (interacting), and interaction strengths above 50% indicate a propensity for binding. As shown in Figure 5D, the interaction strength between SNHG12 and PIK3R1 was 93%; thus, there was a high probability that lncRNA SNHG12 could bind to PIK3R1. An RNA pulldown assay confirmed the ability of SNHG12 to pull down the PI3K protein (Figure 5E).
We also performed Western blotting to measure the expression of PI3K/AKT pathway proteins known to be associated with cell growth, invasion and apoptosis (Figure 6A and 6B). The knockdown of SNHG12 in AGS and MGC-803 cells reduced the expression of phosphorylated (p)-PI3K, p-AKT, p-MEK1/2 (mitogen-activated protein kinase kinase 1/2), p-ERK1/2 (extracellular signal-regulated kinase 1/2), cyclin D1 and matrix metalloproteinase (MMP)-2, but increased the expression of cleaved caspase 9, while the overexpression of SNHG12 in BGC-823 cells had the opposite effects. However, the total levels of PI3K, AKT, MEK1/2 and ERK1/2 were not affected by SNHG12 expression in GC cells.
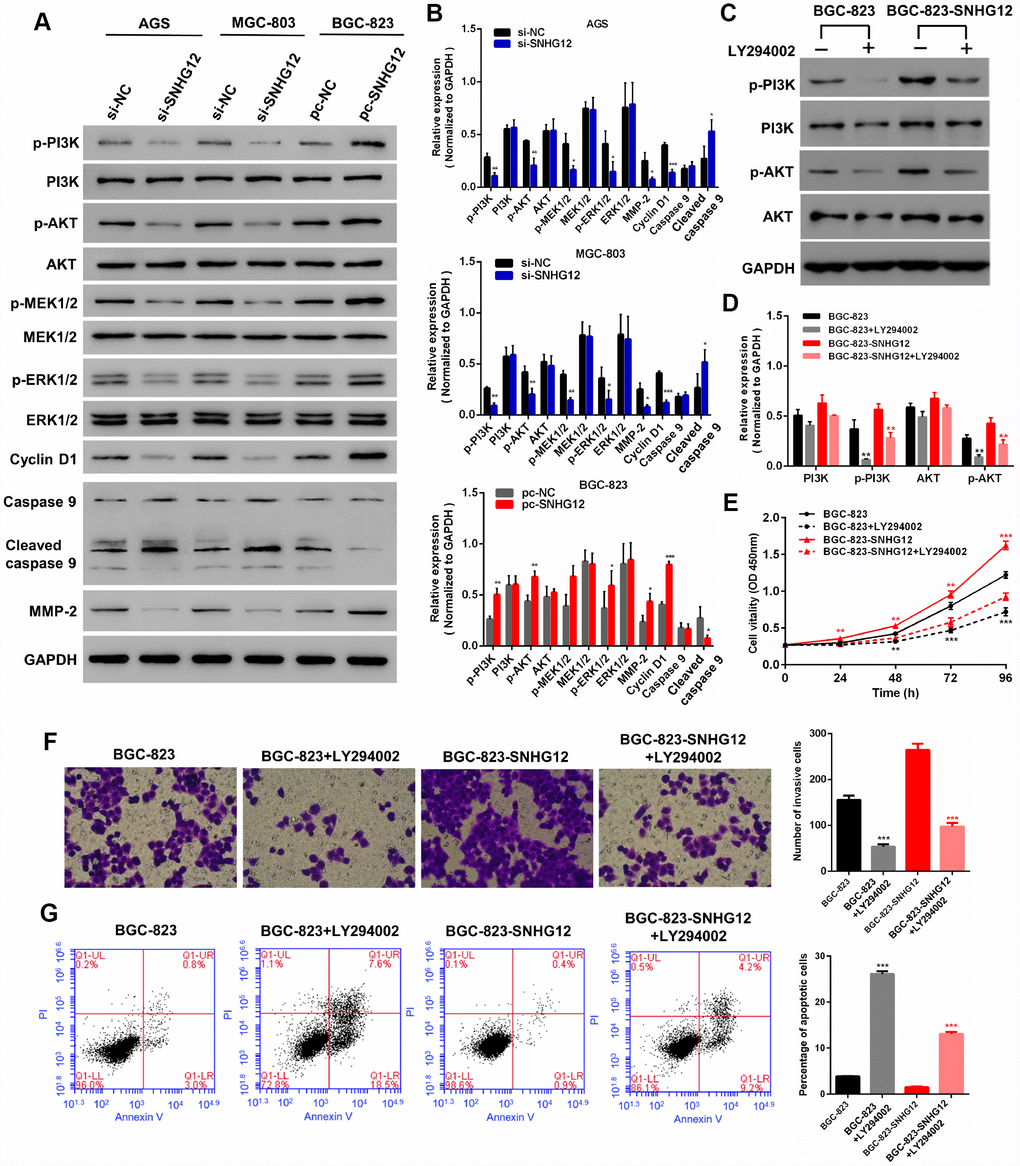
Figure 6. SNHG12 promotes the progression of GC by activating the PI3K/AKT pathway. (A, B) Western blot analysis was performed to detect PI3K/AKT pathway and downstream protein levels in AGS and MGC-803 cells transfected with si-SNHG12, and in BGC-823 cells transfected with pc-SNHG12. (C, D) LY294002 inhibited the expression of p-PI3K and p-AKT in BGC-823 and SNHG12-overexpressing BGC-823 cells. (E) The effects of LY294002 on the proliferation of BGC-823 and SNHG12-overexpressing BGC-823 cells were detected with a CCK-8 assay. (F) The effects of LY294002 on the invasion of BGC-823 and SNHG12-overexpressing BGC-823 cells were detected with a Transwell assay. (G) The effects of LY294002 on the apoptosis of BGC-823 and SNHG12-overexpressing BGC-823 cells were detected by flow cytometry. Data are shown as the mean ± SEM of at least six experiments. *P<0.05, **P<0.01, ***P<0.001.
To further explore the involvement of the PI3K/AKT pathway in the tumorigenesis of GC, we used LY294002 to inhibit the activity of PI3K in wild-type and SNHG12-overexpressing BGC-823 cells. LY294002 inhibited the expression of both p-PI3K and p-AKT (Figure 6C and 6D). A CCK-8 assay demonstrated that inhibiting the PI3K/AKT pathway suppressed GC cell proliferation (Figure 6E). Consistently, GC cell invasion decreased and apoptosis increased when the PI3K/AKT pathway was inhibited (Figure 6F and 6G).
Knockdown of SNHG12 inhibits xenograft tumor growth
Having identified the growth-promoting effects of SNHG12 in GC cells in vitro, we sought to verify these results in vivo. AGS cells transfected with si-NC or si-SNHG12 were used to establish a subcutaneous xenograft tumor model in nude mice. The tumor volumes and weights were markedly lower in the si-SNHG12 group than in the si-NC group (Figure 7A–7C). Hematoxylin and eosin staining revealed that the number of tumor cells was lower in the si-SNHG12 group than in the si-NC group, and immunohistochemistry analysis revealed that the protein expression of proliferating cell nuclear antigen (PCNA) was significantly lower in the si-SNHG12 group than in the si-NC group (Figure 7D).
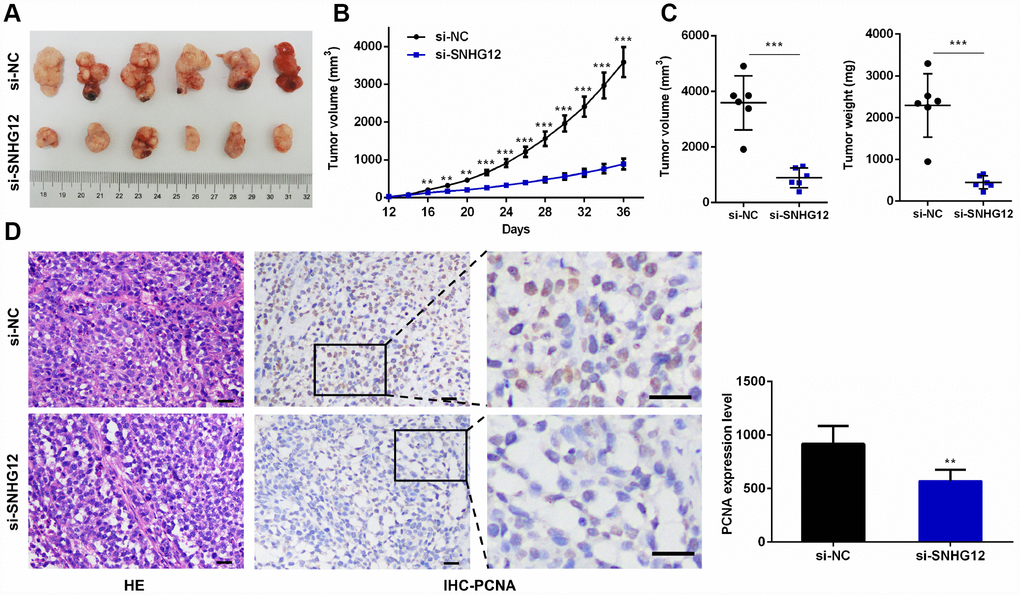
Figure 7. Knocking down SNHG12 inhibits xenograft tumor growth. (A) Representative images of xenograft tumors from the si-NC and si-SNHG12 groups. (B) The tumor growth curves of the si-NC and si-SNHG12 groups. (C) The tumor volumes and tumor weights of the si-NC and si-SNHG12 groups. (D) Representative images of hematoxylin and eosin staining and PCNA immunostaining of xenograft tumor samples from the si-NC and si-SNHG12 groups (scale bar = 200 μm), and semi-quantitative results of PCNA immunostaining. Data are shown as the mean ± SEM of at least six experiments. **P<0.01, ***P<0.001.
Discussion
Small nucleolar RNA host genes (SNHGs), a subgroup of lncRNAs, are associated with the progression of various malignancies, including GC. For instance, SNHG5 is a tumor suppressor in GC [26, 27], SNHG8 predicts a poor prognosis in GC patients [28] and SNHG17 induces the development of GC [29]. Previous studies have indicated that SNHG12 promotes the tumorigenesis of multiple cancers, including hepatocellular carcinoma, glioma and breast cancer [30–32]. However, little has been known about the clinical value of SNHG12 in GC patients. Through data mining and tissue microarray analysis, we discovered that SNHG12 was differentially expressed in GC and adjacent normal tissues, and by evaluating additional GC tissues, we confirmed that SNHG12 was markedly upregulated in GC. We also found that higher expression of SNHG12 was associated with a greater tumor invasion depth and poorer survival in GC patients. Thus, in accordance with its tumorigenic role in other cancers [30–32], SNHG12 may be a promising biomarker for gastric cancer.
Subsequently, we performed a range of functional experiments in vitro and in vivo to investigate the effects of SNHG12 on GC cells. Our findings demonstrated that silencing SNHG12 suppressed GC cell proliferation, colony formation, migration, invasion, cell cycle progression and in vivo tumorigenesis, and promoted apoptosis and cell cycle arrest, while overexpressing SNHG12 had the opposite effects. Thus, both clinical data and functional experiments suggested that SNHG12 is an oncogenic factor in GC.
PI3K belongs to a family of lipid kinases that can phosphorylate the 3’-OH group of the inositol ring in inositol phospholipids [33]. AKT is a member of the AGC kinase family, which also includes adenosine/ guanosine monophosphate-activated protein kinases and protein kinase C [34]. The PI3K/AKT signaling network influences numerous processes that are dysregulated in cancer, including genomic stability, cell survival, metabolism, cell cycle progression and cell motility [35]; thus, this pathway is frequently overactivated in human malignant tumors [36]. Various lncRNAs (including DANCR, SCAT7 and AK023391) have been reported to stimulate the PI3K/AKT pathway in cancers [15, 37, 38].
In our FISH analysis, we detected SNHG12 mainly in the cytoplasm of GC cells, indicating that SNHG12 may regulate signal transduction in GC. Our cancer pathway microarray and bioinformatic analyses suggested that SNHG12 regulates the PI3K/AKT pathway. An RNA pulldown assay confirmed that SNHG12 could bind directly to PI3K. Thereafter, our Western blot analyses revealed that the phosphorylated levels (but not the total levels) of PI3K and AKT were significantly reduced after SNHG12 knockdown and elevated after SNHG12 overexpression, suggesting that SNHG12 activates this pathway by inducing the phosphorylation of PI3K and AKT. Thus, we deduced that SNHG12 increased the phosphorylation of PI3K by directly binding to it.
The levels of PI3K/AKT pathway proteins and downstream proteins were also altered after the knockdown or overexpression of SNHG12. These proteins, including p-MEK1/2, p-ERK1/2, cyclin D1, caspase 9 and MMP-2, are widely known to be essential for cell proliferation, apoptosis and invasion. In addition, inhibiting the PI3K/AKT pathway in SNHG12-overexpressing BGC-823 cells suppressed cell proliferation and invasion and induced apoptosis. Therefore, we speculated that SNHG12 promoted GC tumorigenesis by activating the PI3K/AKT pathway (Figure 8). In view of these findings, SNHG12 overexpression could be used as a biomarker of poor survival in GC patients.
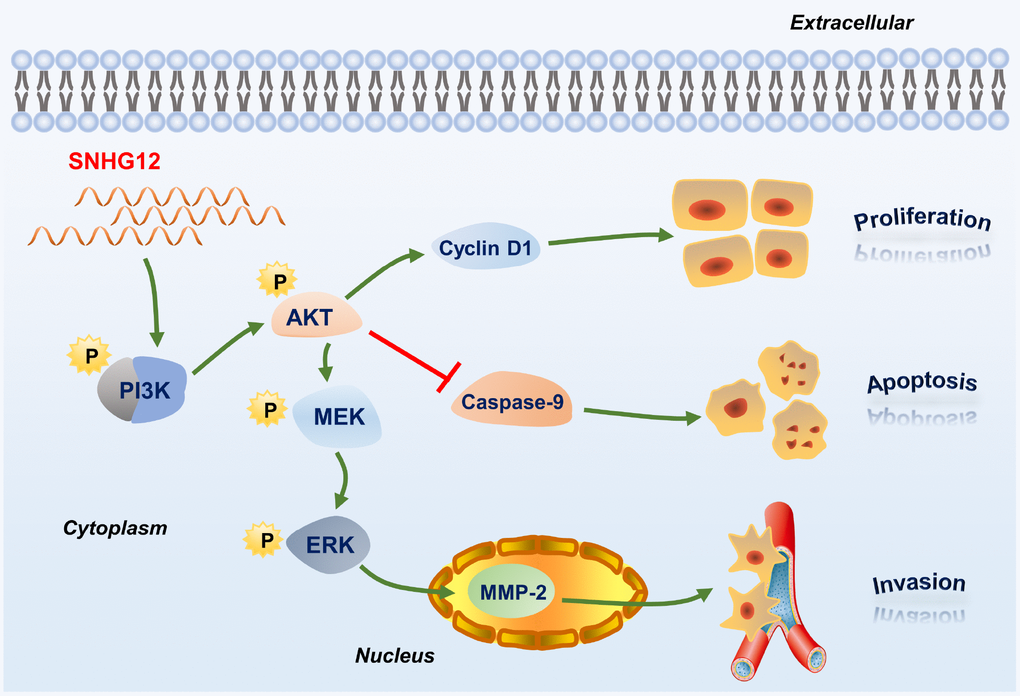
Figure 8. Schematic diagram of the regulatory mechanism of SNHG12 in GC cells.
Materials and Methods
RNA expression profiling
The RNA expression profiling data used to explore differentially expressed genes between GC and adjacent normal tissues were downloaded from the Gene Expression Omnibus. Differentially expressed genes (fold change ≥ 1.5, P < 0.05) were identified from these raw data by R 3.5.3 software (Lucent Technologies, NJ, USA).
Clinical data
The relative SNHG12 levels and clinical data from 335 GC patients were downloaded from TCGA RNA-seq database. A GC tissue microarray (No. HStmA180Su09), which included 75 GC tissue samples and the corresponding para-cancerous tissues, was purchased from Shanghai Outdo Biotech Co., Ltd (Shanghai, China). This study was approved by the Ethics Committee of Shanghai Sixth People’s Hospital.
Cell culture
Normal gastric epithelial cells (GES-1) and human GC cell lines (SGC-7901, HGC-27, BGC-823, MGC-803 and AGS) were stored in the Digestive Disease Laboratory of Shanghai Sixth People’s Hospital. The cells were cultured in RPMI-1640 medium (KeyGen, Nanjing, China) with 10% fetal bovine serum (Gibco, MA, USA) and maintained in a humidified atmosphere of 5% CO2 at 37 °C.
FISH
A digoxigenin-labeled DNA probe for SNHG12 (5’-TCTTGATGGGACCGTTTTATCCGCCTGTCAGCC-3’) was synthesized by Sangon Biotech (Shanghai, China). The tissue microarray was placed in an oven at 60 °C for one hour to bake the wax, and was then dewaxed with xylene. A DNA probe hybridization solution was added to the tissue microarray. After hybridization, the slide was washed in 5×, 1× and 0.2× sodium saline citrate for five minutes each. The tissue microarray was incubated with an anti-digoxigenin horseradish peroxidase conjugate (NEF832001EA, Perkin Elmer) at 4 °C overnight, and was then incubated with a tyramide signal amplification fluorescent reaction solution (NEL701001KT, Perkin Elmer) for 30 minutes. Lastly, the microarray was sealed with tablets containing 4′,6-diamidino-2-phenylindole (DAPI).
The tissue microarray was scanned with a Pannoramic MIDI (3D HISTECH, Budapest, Hungary), and the images were acquired with CaseViewer software (3D HISTECH). Image-Pro Plus 6.0 software (Media Cybernetics, MD, USA) was used to obtain the integrated optical density of the SNHG12 signal. The results were obtained from at least four different areas with > 70 cells measured per area [39].
Vector construction and transfection
SNHG12 siRNAs were synthesized by GenePharma (Shanghai, China). Their sequences were 5’-GCUUGUUUCUGGAGCUGUGTT-3’ (sense) and 5’-CACAGCUCCAGAAACAAGCTT-3’ (antisense). Full-length cDNA from SNHG12 was synthesized and cloned into the vector pcDNA3.1 (GenePharma). The siRNAs and plasmid vectors were transfected into GC cells by means of Lipofectamine 2000 (Invitrogen, CA, USA) according to the manufacturer’s protocols.
qRT-PCR
Total RNA was isolated with an RNAeasy™ Animal RNA Isolation Kit (Beyotime, Shanghai, China). Subsequently, the total RNA was reverse-transcribed to cDNA with a PrimeScript™ Reverse Transcription Kit (TakaRa, Japan), and qPCR was conducted with the TB Green™ Premix Ex Taq™ II Kit (TakaRa) according to the manufacturer’s instructions. Primers specific for SNHG12 (Forward: 5’-TCTGGTGATCGAGGACTTCC -3’, Reverse: 5’-ACCTCCTCAGTATCACACACT-3’) were synthesized by Sangon Biotech. Glyceraldehyde 3-phosphate dehydrogenase (GAPDH) was used as the internal control.
CCK-8 assay
GC cells (5000/well) transfected with SNHG12 siRNAs or plasmids were incubated in 96-well plates. The CCK-8 reagent (10 μL, Dojindo, Japan) was added to each well at 0, 18, 24, 48, 72 or 96 hours. The cells were incubated for one hour, and a microplate reader was used to measure the optical density at 450 nm.
Colony formation assay
GC cells (200/well) were placed in six-well plates and cultured for 15 days. Then, 4% paraformaldehyde and 1% crystal violet were used to fix and stain the cells, respectively. The number of colonies containing ≥ 50 cells was counted under a microscope.
Wound-healing assay
GC cells (1.5×10⁶/well) were placed in six-well plates and cultured for 24 hours. After the cells had adhered to the plate, they were scratched with a sterile 100-μL pipette tip. The scratch area was measured with Image-Pro Plus software.
Transwell migration and invasion assay
Transwell chambers with 8-μm pores (Corning, NY, USA) were used to assess the migratory abilities of GC cells. For the migration assay, 100 μL of serum-free medium containing 5×10⁵ cells was added to the upper chamber, while 600 μL of complete medium was added to the lower chamber. The invasion assay resembled the migration assay, but the Transwell chambers were coated with Matrigel (Becton Dickinson, NJ, USA). After the chambers had been incubated for 18 h, the migratory or invasive cells were fixed, stained with Hoechst and photographed under a fluorescence microscope.
Cell cycle analysis
Transfected GC cells were collected by centrifugation and then fixed with cold 70% ethanol at 4 °C overnight. Then, RNase A (1 mg/mL, Solarbio, Beijing, China) was used to remove RNA, and the cells were stained with propidium iodide (50 μg/mL) at 37 °C in the dark for 30 minutes. The fluorescence signal excited at 488 nm was detected with a flow cytometer (Becton Dickinson).
Apoptosis assay
An apoptosis assay was performed with an Annexin V-FITC Apoptosis Detection Kit (Beyotime) according to the instructions of the manufacturer. The percentage of apoptotic cells was analyzed on a flow cytometer.
Cancer pathway microarray analysis
To acquire all-sided results on SNHG12-associated signaling pathways, we used a human cancer pathway microarray (No. PAHS-033Z, Qiagen, Dusseldorf, Germany) to identify differentially expressed genes between si-SNHG12- and si-NC-transfected MGC-803 cells. We then used the online DAVID tool for KEGG and Gene Ontology analyses of the differentially expressed genes.
Binding prediction and RNA pulldown assay
Before performing the RNA pulldown assay, we first used the online tools catRAPID and PRIDB to predict whether lncRNA SNHG12 could bind to PI3K protein. The links of the websites and the sequences of SNHG12 and PIK3R1 can be found in the supplementary materials.
For the RNA pulldown assay, the Biotin RNA Labeling Mix (Roche, Basel, Switzerland) was used to transcribe and label sense- or antisense-SNHG12 from the pcDNA 3.1-SNHG12 vector in vitro. An RNA structure buffer (Thermo, MA, USA) was used to induce secondary structure formation from the biotin-labeled RNAs. Streptavidin beads (Thermo) were washed three times with 500 μL of RNA immunoprecipitation wash buffer (Thermo) and then added to the biotinylated RNAs at 4 °C overnight. The overnight mixture was separated by a magnetic field so that streptavidin bead-RNA complexes could be obtained. Then, lysates of AGS or MGC-803 cells were added to the complexes and incubated on a rotator at room temperature for one hour. The incubated mixture was again separated with a magnetic field so that streptavidin bead-RNA-protein complexes could be obtained. These complexes were used for Western blotting with a PIK3R1 primary antibody.
Western blot assay
Total protein was extracted from GC cells with lysis buffer and boiled in loading buffer for five minutes. Subsequently, the total protein was separated by sodium dodecyl sulfate polyacrylamide gel electrophoresis and transferred to polyvinylidene difluoride membranes. Primary antibodies against p-PI3K, PI3K, p-AKT, AKT, p-MEK1/2, MEK1/2, p-ERK1/2, ERK1/2, cyclin D1, caspase 9, cleaved caspase 9 and MMP-2 were diluted in accordance with the recommended protocols (details are shown in Supplementary Table 3), and the membranes were incubated with these antibodies overnight at 4 °C. Secondary antibodies were added and incubated with the membranes at room temperature for two hours. The membranes were washed with phosphate-buffered saline, and the bands were visualized with a BeyoECL Plus kit (Beyotime) in accordance with the manufacturer’s instructions.
Pharmacological inhibition of PI3K
To inhibit the activity of PI3K, we treated BGC-823 cells (or SNHG12-overexpressing BGC-823 cells) with the PI3K inhibitor LY294002 (Beyotime) dissolved in dimethyl sulfoxide (20 μmol/L). Then, we performed Western blotting, CCK-8, Transwell invasion and cell apoptosis assays by the above methods.
In vivo tumorigenesis assay
Five-week-old male BALB/c nude mice were obtained from SLAC Laboratory Animal Company (Shanghai, China) and fed under specific-pathogen-free conditions. The animal experiments were approved by the Animal Care Committee of Shanghai Sixth People’s Hospital. Si-NC- or si-SNHG12-transfected AGS cells (10×106/0.1 mL of serum-free medium) were implanted in the armpit of each mouse. The tumor volume was examined every two days and was calculated by the equation: volume=1/2 (length×width2).
Immunohistochemical staining
A PCNA antibody (Abways, Shanghai, China) was used for immunohistochemical staining of xenograft tumor tissues, as described previously [40]. The positive area of PCNA was calculated with Image-Pro Plus software.
Statistical analysis
Statistical analyses were conducted with SPSS 21.0 (SPSS, IL, USA) and GraphPad Prism 6 (GraphPad, CA, USA) software. The quantitative variables were analyzed with Student’s t-test, while the categorical variables were analyzed with the chi-square test. Univariate and multivariate Cox proportional hazards regression models were used to identify factors associated with the prognosis of GC patients. Overall survival was analyzed with the Kaplan-Meier method and the log-rank test. P < 0.05 was considered statistically significant, and all P values were two-sided.
Author Contributions
Rui Zhang and Yuan Liu contributed equally to this article; they performed the experiments and wrote the manuscript. Jin-shui Zhu and Jing Zhang designed the experiments. Hui Liu, Wei Chen and Hui-ning Fan assisted in conducting the experiments and analyzing the data. All authors read and approved the final manuscript.
Acknowledgments
We would like to thank our researchers for their hard work and the reviewers for their valuable advice.
Conflicts of Interest
The authors have declared that they have no competing interests.
Funding
This research was funded by grants from the National Natural Science Foundation of China (No. 81873143, 81573747 and 81470833), the Shanghai Science and Technology Commission Western Medicine Guide project (No. 17411966500) and the Shanghai Jiao Tong University School of Medicine doctoral innovation fund (No. BXJ201737).
References
- 1. Bray F, Ferlay J, Soerjomataram I, Siegel RL, Torre LA, Jemal A. Global cancer statistics 2018: GLOBOCAN estimates of incidence and mortality worldwide for 36 cancers in 185 countries. CA Cancer J Clin. 2018; 68:394–424. https://doi.org/10.3322/caac.21492 [PubMed]
- 2. Zhang E, He X, Zhang C, Su J, Lu X, Si X, Chen J, Yin D, Han L, De W. A novel long noncoding RNA HOXC-AS3 mediates tumorigenesis of gastric cancer by binding to YBX1. Genome Biol. 2018; 19:154–69. https://doi.org/10.1186/s13059-018-1523-0 [PubMed]
- 3. Esteller M. Non-coding RNAs in human disease. Nat Rev Genet. 2011; 12:861–74. https://doi.org/10.1038/nrg3074 [PubMed]
- 4. Sun Y, Ma L. New Insights into Long Non-Coding RNA MALAT1 in Cancer and Metastasis. Cancers (Basel). 2019; 11:216–27. https://doi.org/10.3390/cancers11020216 [PubMed]
- 5. Rinn JL, Chang HY. Genome regulation by long noncoding RNAs. Annu Rev Biochem. 2012; 81:145–66. https://doi.org/10.1146/annurev-biochem-051410-092902 [PubMed]
- 6. Peng WX, Koirala P, Mo YY. LncRNA-mediated regulation of cell signaling in cancer. Oncogene. 2017; 36:5661–67. https://doi.org/10.1038/onc.2017.184 [PubMed]
- 7. Uchida S, Dimmeler S. Long noncoding RNAs in cardiovascular diseases. Circ Res. 2015; 116:737–50. https://doi.org/10.1161/CIRCRESAHA.116.302521 [PubMed]
- 8. Luo Q, Chen Y. Long noncoding RNAs and Alzheimer’s disease. Clin Interv Aging. 2016; 11:867–72. https://doi.org/10.2147/CIA.S107037 [PubMed]
- 9. Rupaimoole R, Lee J, Haemmerle M, Ling H, Previs RA, Pradeep S, Wu SY, Ivan C, Ferracin M, Dennison JB, Millward NM, Nagaraja AS, Gharpure KM, et al. Long Noncoding RNA Ceruloplasmin Promotes Cancer Growth by Altering Glycolysis. Cell Rep. 2015; 13:2395–402. https://doi.org/10.1016/j.celrep.2015.11.047 [PubMed]
- 10. Zhuo W, Liu Y, Li S, Guo D, Sun Q, Jin J, Rao X, Li M, Sun M, Jiang M, Xu Y, Teng L, Jin Y, et al. Long Noncoding RNA GMAN, Up-regulated in Gastric Cancer Tissues, Is Associated With Metastasis in Patients and Promotes Translation of Ephrin A1 by Competitively Binding GMAN-AS. Gastroenterology. 2019; 156:676–691.e11. https://doi.org/10.1053/j.gastro.2018.10.054 [PubMed]
- 11. Heery R, Finn SP, Cuffe S, Gray SG. Long Non-Coding RNAs: Key Regulators of Epithelial-Mesenchymal Transition, Tumour Drug Resistance and Cancer Stem Cells. Cancers (Basel). 2017; 9:9. https://doi.org/10.3390/cancers9040038 [PubMed]
- 12. Yang Z, Guo X, Li G, Shi Y, Li L. Long noncoding RNAs as potential biomarkers in gastric cancer: opportunities and challenges. Cancer Lett. 2016; 371:62–70. https://doi.org/10.1016/j.canlet.2015.11.011 [PubMed]
- 13. Zhao R, Zhang Y, Zhang X, Yang Y, Zheng X, Li X, Liu Y, Zhang Y. Exosomal long noncoding RNA HOTTIP as potential novel diagnostic and prognostic biomarker test for gastric cancer. Mol Cancer. 2018; 17:68–72. https://doi.org/10.1186/s12943-018-0817-x [PubMed]
- 14. Hu Y, Wang J, Qian J, Kong X, Tang J, Wang Y, Chen H, Hong J, Zou W, Chen Y, Xu J, Fang JY. Long noncoding RNA GAPLINC regulates CD44-dependent cell invasiveness and associates with poor prognosis of gastric cancer. Cancer Res. 2014; 74:6890–902. https://doi.org/10.1158/0008-5472.CAN-14-0686 [PubMed]
- 15. Huang Y, Zhang J, Hou L, Wang G, Liu H, Zhang R, Chen X, Zhu J. LncRNA AK023391 promotes tumorigenesis and invasion of gastric cancer through activation of the PI3K/Akt signaling pathway. J Exp Clin Cancer Res. 2017; 36:194–208. https://doi.org/10.1186/s13046-017-0666-2 [PubMed]
- 16. Xu MD, Wang Y, Weng W, Wei P, Qi P, Zhang Q, Tan C, Ni SJ, Dong L, Yang Y, Lin W, Xu Q, Huang D, et al. A Positive Feedback Loop of lncRNA-PVT1 and FOXM1 Facilitates Gastric Cancer Growth and Invasion. Clin Cancer Res. 2017; 23:2071–80. https://doi.org/10.1158/1078-0432.CCR-16-0742 [PubMed]
- 17. Sun TT, He J, Liang Q, Ren LL, Yan TT, Yu TC, Tang JY, Bao YJ, Hu Y, Lin Y, Sun D, Chen YX, Hong J, et al. LncRNA GClnc1 Promotes Gastric Carcinogenesis and May Act as a Modular Scaffold of WDR5 and KAT2A Complexes to Specify the Histone Modification Pattern. Cancer Discov. 2016; 6:784–801. https://doi.org/10.1158/2159-8290.CD-15-0921 [PubMed]
- 18. Qi F, Liu X, Wu H, Yu X, Wei C, Huang X, Ji G, Nie F, Wang K. Long noncoding AGAP2-AS1 is activated by SP1 and promotes cell proliferation and invasion in gastric cancer. J Hematol Oncol. 2017; 10:48–61. https://doi.org/10.1186/s13045-017-0420-4 [PubMed]
- 19. Yu Y, Li L, Zheng Z, Chen S, Chen E, Hu Y. Long non-coding RNA linc00261 suppresses gastric cancer progression via promoting Slug degradation. J Cell Mol Med. 2017; 21:955–67. https://doi.org/10.1111/jcmm.13035 [PubMed]
- 20. Guo W, Dong Z, Liu S, Qiao Y, Kuang G, Guo Y, Shen S, Liang J. Promoter hypermethylation-mediated downregulation of miR-770 and its host gene MEG3, a long non-coding RNA, in the development of gastric cardia adenocarcinoma. Mol Carcinog. 2017; 56:1924–34. https://doi.org/10.1002/mc.22650 [PubMed]
- 21. Cao B, Liu C, Yang G. Down-regulation of lncRNA ADAMTS9-AS2 contributes to gastric cancer development via activation of PI3K/Akt pathway. Biomed Pharmacother. 2018; 107:185–93. https://doi.org/10.1016/j.biopha.2018.06.146 [PubMed]
- 22. Zhang Z, Fan B, Liu F, Song N, Peng Y, Ma W, Ma R, Dong T, Liu S. HOX transcript antisense RNA is elevated in gastric carcinogenesis and regulated by the NF-κB pathway. J Cell Biochem. 2019; 120:10548–10555. https://doi.org/10.1002/jcb.28340 [PubMed]
- 23. Wang F, Zhu W, Yang R, Xie W, Wang D. LncRNA ZEB2-AS1 contributes to the tumorigenesis of gastric cancer via activating the Wnt/β-catenin pathway. Mol Cell Biochem. 2019; 456:73–83. https://doi.org/10.1007/s11010-018-03491-7 [PubMed]
- 24. Budczies J, Klauschen F, Sinn BV, Győrffy B, Schmitt WD, Darb-Esfahani S, Denkert C. Cutoff Finder: a comprehensive and straightforward Web application enabling rapid biomarker cutoff optimization. PLoS One. 2012; 7:e51862. https://doi.org/10.1371/journal.pone.0051862 [PubMed]
- 25. Lánczky A, Nagy Á, Bottai G, Munkácsy G, Szabó A, Santarpia L, Győrffy B. miRpower: a web-tool to validate survival-associated miRNAs utilizing expression data from 2178 breast cancer patients. Breast Cancer Res Treat. 2016; 160:439–46. https://doi.org/10.1007/s10549-016-4013-7 [PubMed]
- 26. Zhao L, Guo H, Zhou B, Feng J, Li Y, Han T, Liu L, Li L, Zhang S, Liu Y, Shi J, Zheng D. Long non-coding RNA SNHG5 suppresses gastric cancer progression by trapping MTA2 in the cytosol. Oncogene. 2016; 35:5770–80. https://doi.org/10.1038/onc.2016.110 [PubMed]
- 27. Zhao L, Han T, Li Y, Sun J, Zhang S, Liu Y, Shan B, Zheng D, Shi J. The lncRNA SNHG5/miR-32 axis regulates gastric cancer cell proliferation and migration by targeting KLF4. FASEB J. 2017; 31:893–903. https://doi.org/10.1096/fj.201600994R [PubMed]
- 28. Lin Y, Hu D, Zhou Q, Lin X, Lin J, Peng F. The fasting blood glucose and long non-coding RNA SNHG8 predict poor prognosis in patients with gastric carcinoma after radical gastrectomy. Aging (Albany NY). 2018; 10:2646–56. https://doi.org/10.18632/aging.101576 [PubMed]
- 29. Zhang G, Xu Y, Wang S, Gong Z, Zou C, Zhang H, Ma G, Zhang W, Jiang P. LncRNA SNHG17 promotes gastric cancer progression by epigenetically silencing of p15 and p57. J Cell Physiol. 2019; 234:5163–74. https://doi.org/10.1002/jcp.27320 [PubMed]
- 30. Lan T, Ma W, Hong Z, Wu L, Chen X, Yuan Y. Long non-coding RNA small nucleolar RNA host gene 12 (SNHG12) promotes tumorigenesis and metastasis by targeting miR-199a/b-5p in hepatocellular carcinoma. J Exp Clin Cancer Res. 2017; 36:11–21. https://doi.org/10.1186/s13046-016-0486-9 [PubMed]
- 31. Liu X, Zheng J, Xue Y, Qu C, Chen J, Wang Z, Li Z, Zhang L, Liu Y. Inhibition of TDP43-Mediated SNHG12-miR-195-SOX5 Feedback Loop Impeded Malignant Biological Behaviors of Glioma Cells. Mol Ther Nucleic Acids. 2018; 10:142–58. https://doi.org/10.1016/j.omtn.2017.12.001 [PubMed]
- 32. Wang O, Yang F, Liu Y, Lv L, Ma R, Chen C, Wang J, Tan Q, Cheng Y, Xia E, Chen Y, Zhang X. C-MYC-induced upregulation of lncRNA SNHG12 regulates cell proliferation, apoptosis and migration in triple-negative breast cancer. Am J Transl Res. 2017; 9:533–45. [PubMed]
- 33. Porta C, Paglino C, Mosca A. Targeting PI3K/Akt/mTOR Signaling in Cancer. Front Oncol. 2014; 4:64. https://doi.org/10.3389/fonc.2014.00064 [PubMed]
- 34. Kumar CC, Madison V. AKT crystal structure and AKT-specific inhibitors. Oncogene. 2005; 24:7493–501. https://doi.org/10.1038/sj.onc.1209087 [PubMed]
- 35. Fruman DA, Rommel C. PI3K and cancer: lessons, challenges and opportunities. Nat Rev Drug Discov. 2014; 13:140–56. https://doi.org/10.1038/nrd4204 [PubMed]
- 36. Faes S, Dormond O. PI3K and AKT: Unfaithful Partners in Cancer. Int J Mol Sci. 2015; 16:21138–52. https://doi.org/10.3390/ijms160921138 [PubMed]
- 37. Tang J, Zhong G, Zhang H, Yu B, Wei F, Luo L, Kang Y, Wu J, Jiang J, Li Y, Wu S, Jia Y, Liang X, Bi A. LncRNA DANCR upregulates PI3K/AKT signaling through activating serine phosphorylation of RXRA. Cell Death Dis. 2018; 9:1167. https://doi.org/10.1038/s41419-018-1220-7 [PubMed]
- 38. Ali MM, Akhade VS, Kosalai ST, Subhash S, Statello L, Meryet-Figuiere M, Abrahamsson J, Mondal T, Kanduri C. PAN-cancer analysis of S-phase enriched lncRNAs identifies oncogenic drivers and biomarkers. Nat Commun. 2018; 9:883. https://doi.org/10.1038/s41467-018-03265-1 [PubMed]
- 39. Soares RJ, Maglieri G, Gutschner T, Diederichs S, Lund AH, Nielsen BS, Holmstrøm K. Evaluation of fluorescence in situ hybridization techniques to study long non-coding RNA expression in cultured cells. Nucleic Acids Res. 2018; 46:e4. https://doi.org/10.1093/nar/gkx946 [PubMed]
- 40. Zhang J, Wang G, Chu SJ, Zhu JS, Zhang R, Lu WW, Xia LQ, Lu YM, Da W, Sun Q. Loss of large tumor suppressor 1 promotes growth and metastasis of gastric cancer cells through upregulation of the YAP signaling. Oncotarget. 2016; 7:16180–93. https://doi.org/10.18632/oncotarget.7568 [PubMed]