


Introduction
Skin exposure to ultraviolet radiation (UV) is necessary to enhance vitamin D production; however, excessive exposure to UV cause skin malignancies [1–3]. The correlation between excessive UV irradiation and UV-induced skin lesions such as inflammation, dysfunction of the epidermal barrier, skin aging, carcinogenesis, and melanoma are not known [4–7]. Typically, the lncRNAs (long non-coding RNA) act as a pivotal regulator in a panel of inflammatory diseases, including diabetes, rheumatoid arthritis, psoriasis, systemic lupus, and erythematosus [18, 19]. However, the involvement of lncRNAs in UV-induced skin inflammation remains unclear. Besides transcriptional noise, the lncRNA with the sequence lengths longer than 200 nucleotides could regulate gene expression via a cis- or trans- mechanism, which allows it to associate with RNA and de-stabilizes the target proteins [8–17]. MicroRNA (miRNA) also exerts a regulatory role in skin inflammations by mediating target mRNA degradation or inhibiting the mRNA translation [20–25]. However, the latest research indicates that the ceRNA (competing endogenous RNA) network constitute the key regulatory mechanism in the pathogenesis and development of skin disorders. The lncRNA maternally expressed gene 3 (human transcript named MEG3 and mouse transcript named Meg3) located in the chromosome 14q and chromosome 12 in the human and mouse genome, respectively could identify chromatin and initiate interaction with the RNA-DNA complex, PRC2 (polycomb repressive complex 2), and various target genes [26–29]. Most miRNAs could suppress the MEG3 expression via post-transcription regulation which competes with the endogenous RNA mechanism [30–34]. MEG3 could also activate or inhibit multiple signaling pathways, i.e., p53, TGFβ, Rb, and EZH2; and hence, the dysregulation of MEG3 expression was typical to solid tumors, inflammation, and autoimmune disease [34–38].
For the first time in our study, we identified the differentially expressed mRNAs, lncRNAs, and miRNAs in untreated, and UVB irradiated murine dorsal skin tissues (GSE80427 and 80428 with reannotation of lncRNAs). The WGCNA (weighted correlation network analysis) and ceRNA network construction was performed following an enrichment analysis from gene ontology (GO) and Kyoto Encyclopedia of Genes and Genomes (KEGG) pathways to discover potential therapeutic targets for skin inflammation induced by UVB irradiation. Furthermore, we confirmed in vivo and in vitro up-regulated status of lncRNA Meg3 after a UVB irradiation. Following the interactions with miR-93-5p, the skin inflammatory responses were activated in murine skin fibroblasts by lncRNA Meg3. Correspondingly, the ceRNA mechanism revealed that the UVB induced inflammatory skin lesions were dependent on Meg3/miR-93-5p/Ereg axis.
Results
Microarray re-annotation and differential expression RNAs analysis
The expression profiles of RNAs in four control and UVB irradiated murine skin tissues (12-weeks) were retrieved from the GEO database (Gene Expression Omnibus, https://www.ncbi.nlm.nih.gov/geo/ GSE80427 and GSE80428) and analyzed by following the reported literature [39–41]. The gene expression microarray platform of GSE80427 was Affymetrix Mouse Gene 1.0 ST Array. Typically, 655 lncRNAs were identified by the default microarray annotation files. Based on the Gencode_M22 (GRCm38.p6) annotation, the lncRNAs of (GSE80427) were re-annotated, and a total of 1,854 lncRNAs were identified with at least three independent probes. The differential expressed lncRNAs, mRNAs, and miRNAs were determined by the limma method after normalization. More specifically, 7 significantly up-regulated lncRNAs, 8 down-regulated lncRNAs, 24 significantly up-regulated mRNAs, 160 down-regulated mRNAs in GSE80427, 51 significantly up-regulated miRNAs and 54 down-regulated miRNAs in GSE80428 were determined, respectively. Figure 1A and 1B displayed the heatmap of clustered DE-lncRNAs and the distribution of all the annotated lncRNAs by a two-dimension logarithmic scale, i.e., -log10 (p-values) and log2 (fold change, FC) in a volcano map. LncRNA Meg3 was the most up-regulated lncRNA with the highest statistical significance, and the corresponding results on the mRNAs and miRNAs were summarized in Supplementary Figure 1.
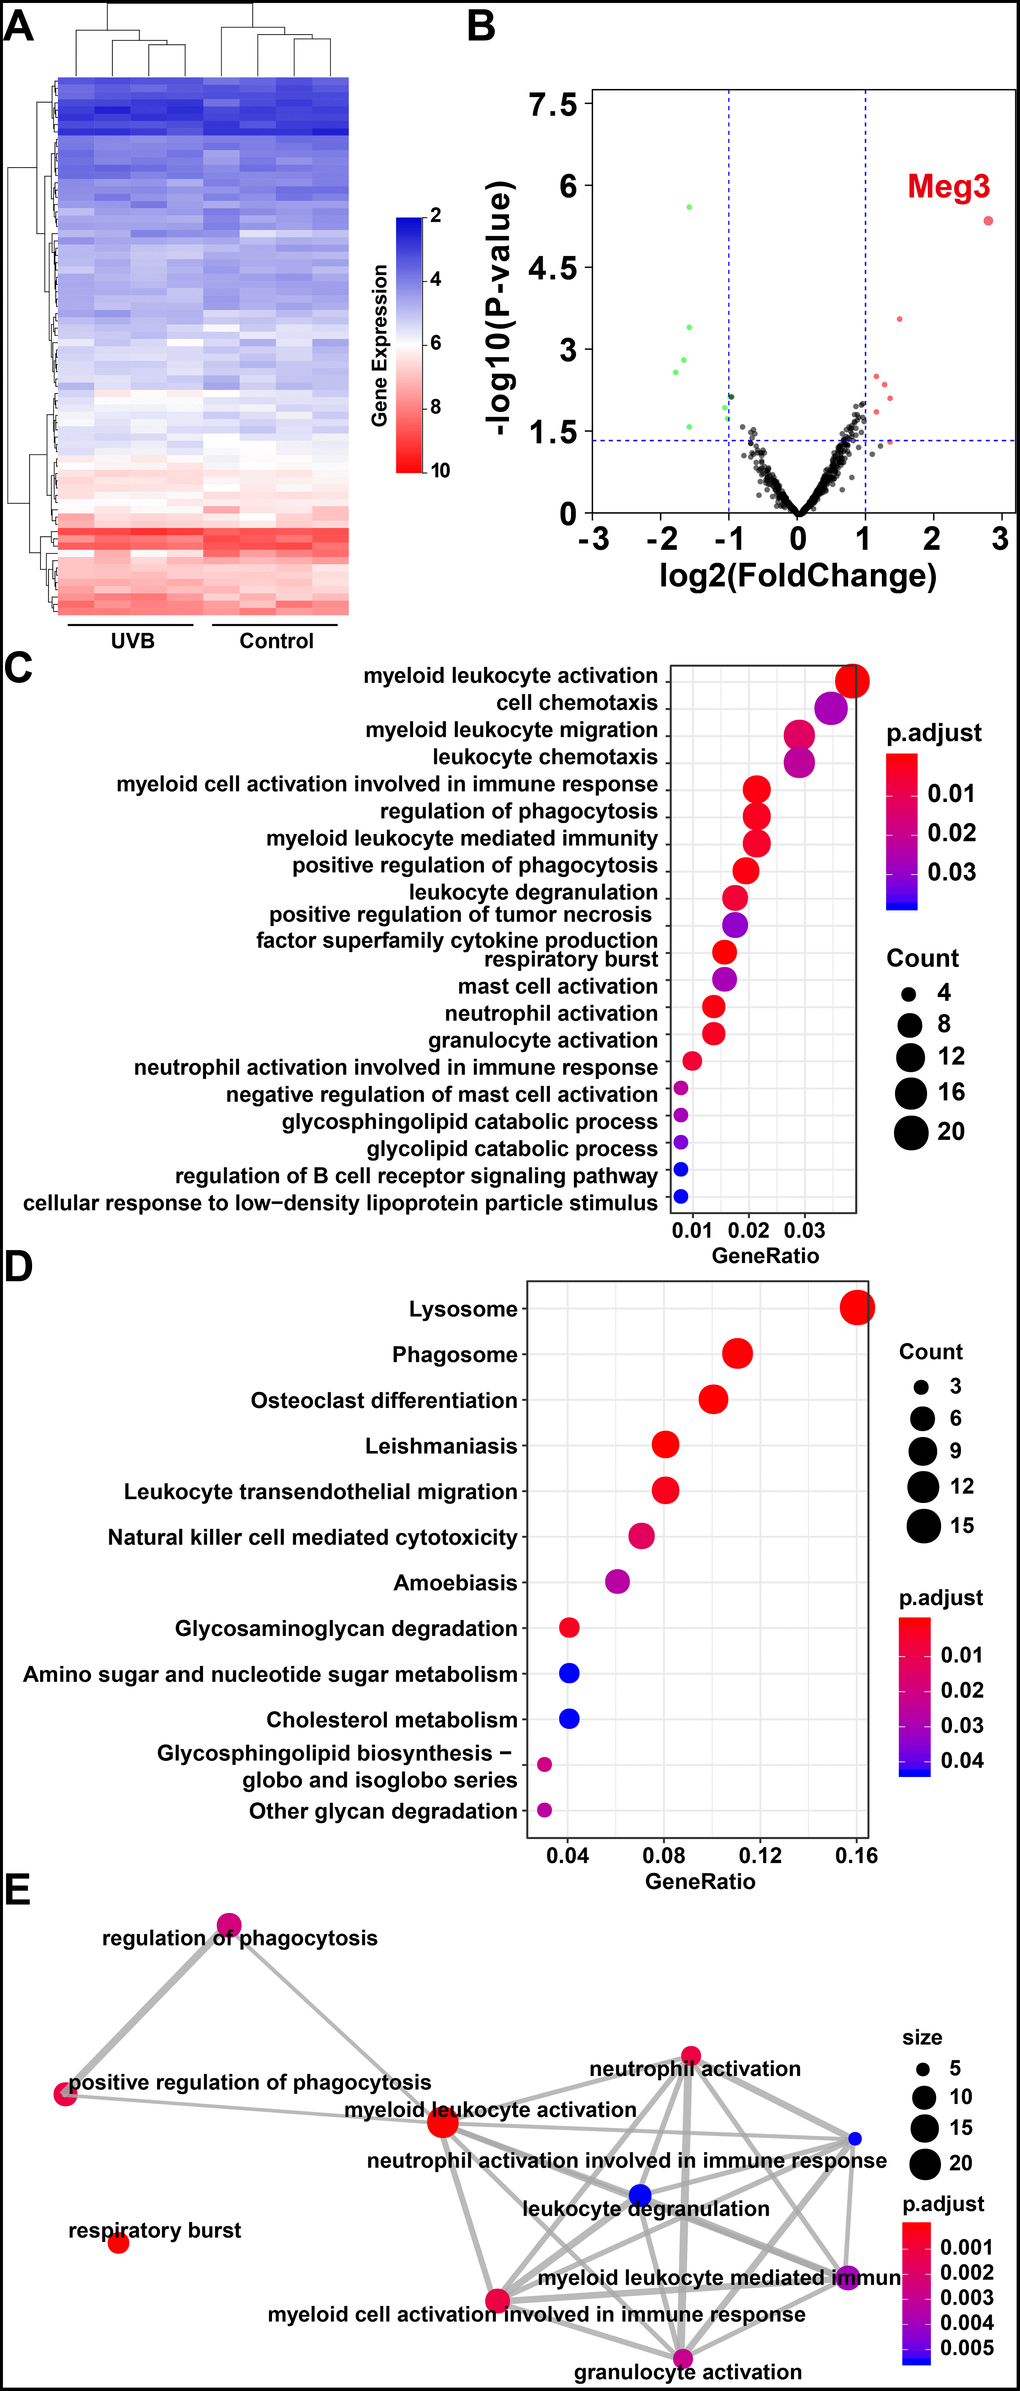
Figure 1. (A) Heat map of lncRNAs expression profiles of normal and UVB irradiated murine dorsal skin tissue groups. Red represents up-regulated lncRNAs and blue represents down-regulated lncRNAs. (B) Volcano plots of lncRNAs for normal and UVB irradiated murine dorsal skin tissue groups. The horizontal axis represents fold change (log 2) and the vertical axis is P value (−log 10). Red points (fold change > 1) indicate up-regulated lncRNAs, green points (fold change < −1) indicate down-regulated lncRNAs. Gene ontology analysis (C) and KEGG enrichment (D) of differentially expressed lncRNAs in normal and UVB irradiated murine dorsal skin tissue groups. The horizontal axis represents the proportion of those genes accounted for in all the annotated genes, the left side of the vertical axis represents the annotation terms. Bubble scale represents number of genes in each term; depth of bubble color represents p value. (E) The annotation terms are displayed as an interaction network by using the Reactome pathways. Bubble scale represents number of genes; depth of bubble color represents p value.
The gene modules related to differential expressed lncRNAs and mRNAs were enriched by gene ontology (GO) annotation [42] and Kyoto Encyclopedia of Genes and Genomes (KEGG) [43] respectively. As shown in Figure 1C, the myeloid leukocyte, cellulose chemotaxis, and myeloid leukocyte migration were enriched. [44] The relationship among the top pathways was analyzed by the Reactome database (as shown in Figure 1E) i.e. the myeloid leukocyte, and cellular activation involved in the immune responses were the centers for all the enriched pathways [45].
Identification of gene modules by weighted gene co-expression network analysis (WGCNA)
The weighted gene co-expression network analysis (WGCNA) was used to identify the gene modes which are related to the top 25% of the expressed mRNAs and lncRNAs (Figure 2A) [46]. The threshold for the determination of co-expression gene modes was fixed at a soft power of 9 and a module size cut-off of 30, respectively. The module-trait (healthy and UVB irradiated) co-expression similarity and adjacency analysis were performed in 26 identified gene modules. Turquoise module and green-yellow module demonstrated a significant relationship with healthy and UVB irradiated group, respectively (Figure 2B). The gene expression profiles of each sample were also clustered by the 26 gene modules. As shown in Figure 2C, the gene expression profiles in turquoise and green-yellow modules significantly differed in the two groups. Typically, 1669 mRNAs and 91 lncRNAs in the turquoise and green-yellow modules were further analyzed by KEGG-GSEA (Gene Set Enrichment Analysis) [47]. The phagosome and metabolic pathways were significantly downregulated in the UVB irradiated group (Figure 2D).
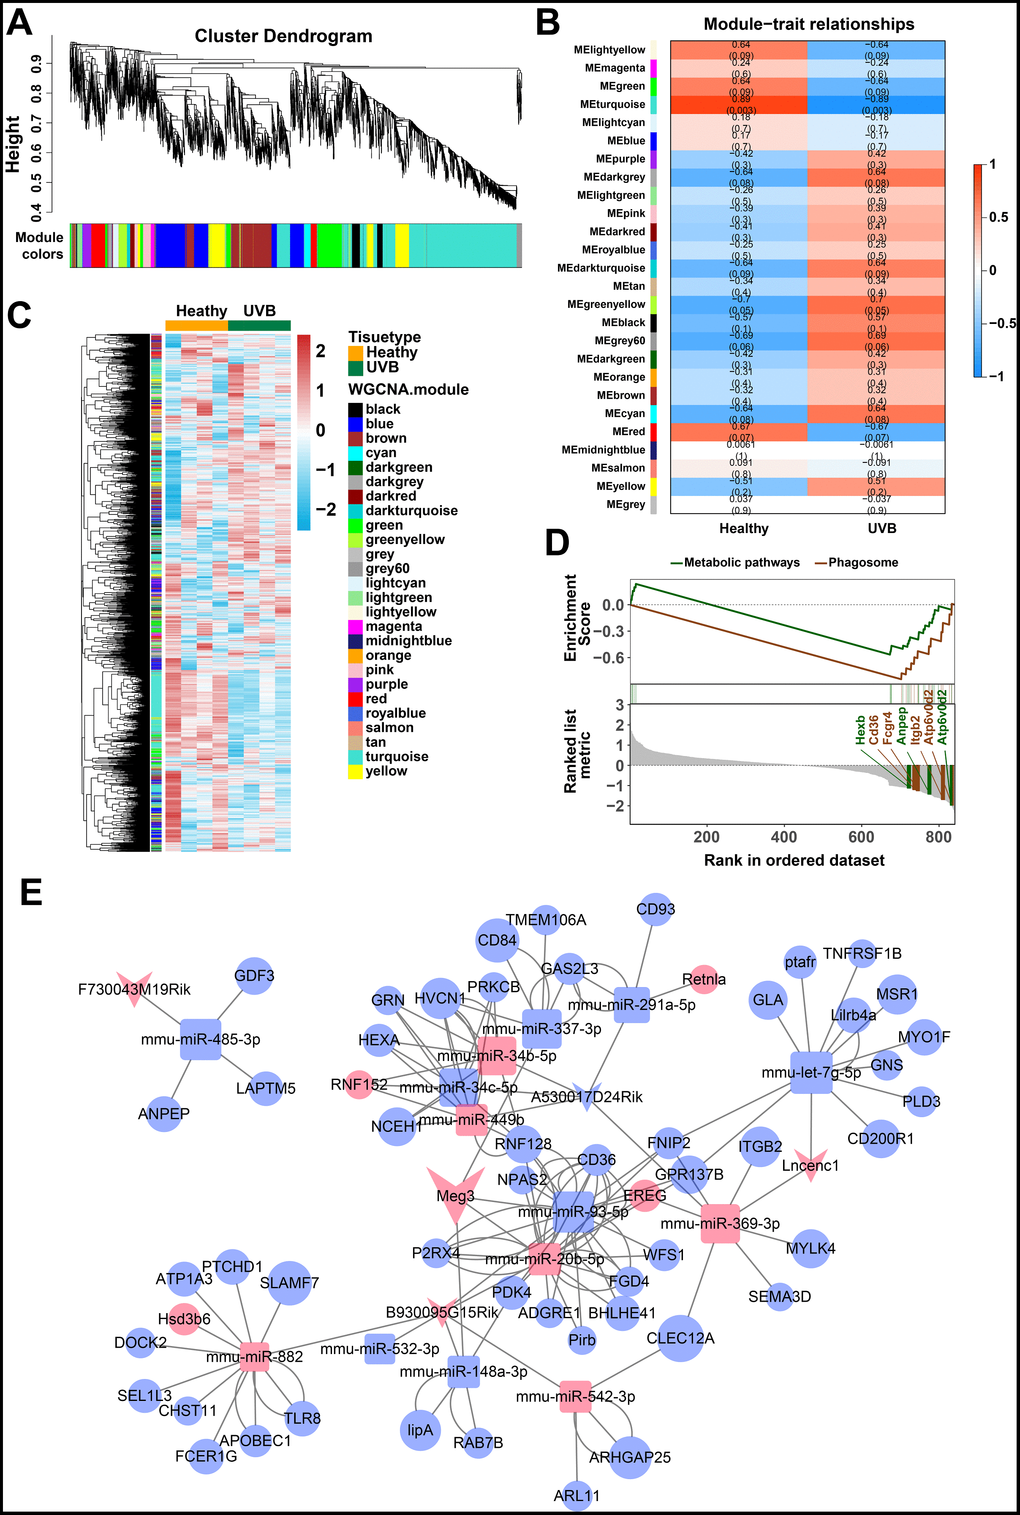
Figure 2. (A) Clustering dendrogram of genes by WGCNA. The dissimilarity of genes is based on topological overlap. The genes are assigned to different modules and are identified using different colors. (B) The relationship of each WGCNA co-expression modules between normal and UVB irradiated samples were investigated. (C) Heatmap of clustered genes in the co-expression modules. The different colors on the horizontal and vertical axis represent different groups and modules. The colors in the middle represents the relativity among each module. (D) The significant KEGG-GSEA pathways in differentially expressed mRNAs linked to lncRNAs. The horizontal axis represents the rank in all the ordered dataset, the vertical axes represent enrichment score and ranked list metric. (E) The lncRNA-mRNA-miRNA ceRNA network was constructed by five lncRNAs, 14 miRNAs and 54 mRNAs for UVB induced skin lesions.
Construction of lncRNA-miRNA-mRNA ceRNA network
The target predictions of lncRNA-miRNA pairs were retrieved from Starbase, and 432 miRNAs were predicted as potential targets of 15 DE-lncRNAs. The common miRNAs between 105 DE-miRNAs and 432 predicted lncRNA-miRNA interactions were selected to obtain lncRNAs-miRNAs network. The interactions between common miRNAs and target mRNAs were retrieved from the miRTarBase [48], miRDB [49], Targetscan, and Starbase database [50, 51]. The target mRNAs were filtered based on the difference in the expression profiles between the healthy and UVB-irradiated groups, as depicted in Figure 2E. After that, we constructed a lncRNA-miRNA-mRNA ceRNA network by using 5 lncRNAs, 14 miRNAs and 54 mRNAs [52–54]. The color and size of each node represented their expression (up-regulated or down-regulated) and fold changes, respectively. The shape of each node represented their type, i.e., circle for mRNAs, square for miRNAs and V-shape for lncRNAs. By the default microarray annotation files, we could identify 655 lncRNAs, and the location of the Meg3/mmu-miR-93-5p/Ereg axis in the hub position of the entire ceRNA network.
Meg3 is upregulated in UVB irradiated murine skin and related to inflammatory damage
To further determine expression profiles and potential mechanisms of Meg3 in UVB-irradiated skin tissues, we examined the expression of lncRNA Meg3 in murine skin by using qRT-PCR before and after seven-days of UVB irradiation. Compared to the control tissues, the H&E (hematoxylin and eosin) stained murine skin tissues after seven-days of UVB irradiation exhibited a damaged epidermis, thickened cuticle, and loss of collagen in the dermal layer (Figure 3A). The collagen fibers were disrupted after UVB irradiation, and infiltration of the inflammatory cells were also observed. The qRT-PCR results showed significantly up-regulated expression of the lncRNA Meg3 in UVB-irradiated tissues than those of the control tissues (P < 0.01; Figure 3B) [55]. The fluorescence in situ hybridization (FISH) results indicated that the Meg3 expression was activated in the UVB irradiated tissues (P < 0.01; Figure 3C). The detection of Meg3 levels in the murine skin tissues with varying levels of UVB irradiation suggested that the Meg3 expression levels escalated with UVB exposure (Figure 3D). The markers of UVB photo-damage, the expression of MMP1 and MMP3 (matrix metalloproteinase) were also up-regulated in UVB irradiation tissues as detected by ELISA (Enzyme-linked immunosorbent assay, Figure 3E) and western blotting (WB, Figure 3F) analysis. After the UVB irradiation, the protein expression of Ereg improved, and mmu-miR-93-5p levels significantly declined (P < 0.01, Figure 3G).
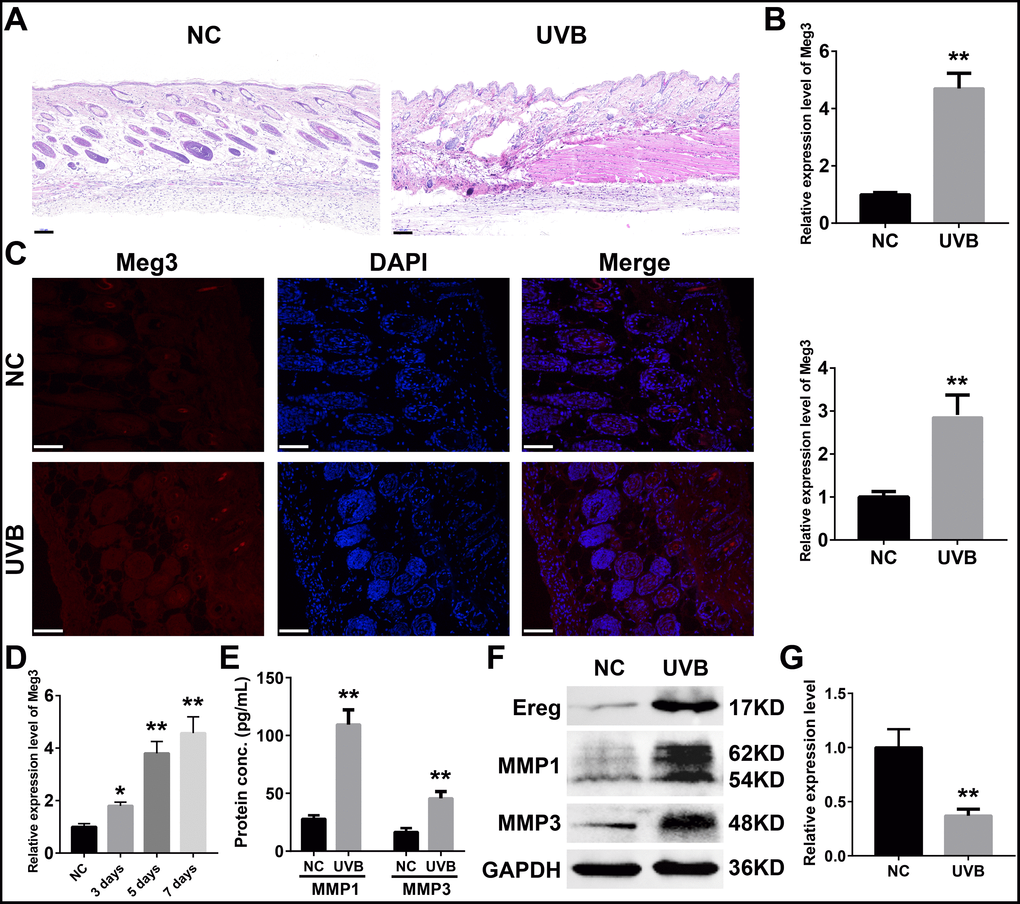
Figure 3. (A) H&E staining of murine dorsal skin samples with or without UVB irradiation (scale bar = 100 μm). (B) Quantification of Meg3 expression by qRT-PCR in normal and UVB irradiated murine dorsal skin tissues. (C) Fluorescence in situ hybridization (FISH) of Meg3 in normal and UVB irradiated murine dorsal skin tissues. (D) Quantification of Meg3 expression by qRT-PCR after different exposure time of UVB irradiation. (E) Quantification of secreted MMP1 and MMP3 by ELISA in normal and UVB irradiated murine dorsal skin tissues. (F) The expression level of Ereg, MMP1, MMP3 by WB in normal and UVB irradiated murine dorsal skin tissues. (G) Quantification of miR-93-5p expression by qRT-PCR in normal and UVB irradiated murine dorsal skin tissues.
Meg3 activated the inflammatory cytokines and regulates miR-93-5p/Ereg expression
Inflammatory responses are an essential pathologic factor of UVB induced skin damage. Skin fibroblast is one of the major participants in the skin inflammation and regeneration after UVB irradiation. The overexpression or RNA interference of Meg3 was performed to determine the function of Meg3 in primary murine skin fibroblasts. The knockdown and overexpression efficiency of Meg3 siRNA and adenoviral vector for Meg3 (OE-Meg3) and siRNA-Meg3, respectively, were confirmed by qRT-PCR (Figures 4A and 4B, respectively). The influence of Meg3 on miR-93-5p expression levels was determined by qRT-PCR. As shown in Figure 4C and 4D, RNA interference of Meg3 resulted in upregulated miR-93-5p, and OE-Meg3 resulted in a declined expression of the miR-93-5p (P < 0.01). The mRNA levels of several inflammatory cytokines were also quantified by qRT-PCR (Figures 4E and 4F), which revealed that the Meg3 overexpression raised the mRNA expression level of MMP1, MMP3, TNF-α, IL1β, IL6, and TGFβ1. RNA silencing of Meg3 suppressed the inflammatory cytokines expressions. Furthermore, the WB analysis showed that Meg3 overexpression elevated the protein levels of Ereg, MMP1, and MMP3; however, Meg3 RNA-silencing did not significantly interfere with the expression of the protein. The protein expression levels in Ereg, MMP1, and MMP3 in null vector and si-NC groups were relatively low; therefore, the changes in protein levels were not observed after the addition of siRNA Meg3. These findings demonstrated that Meg3 not only enhanced the inflammatory response but also stimulated the expression of inflammatory cytokines in the murine skin fibroblasts.
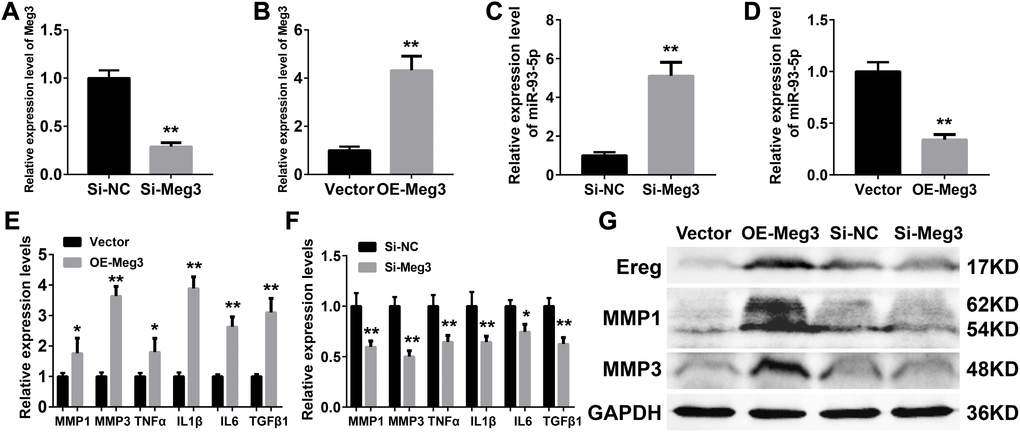
Figure 4. (A–B) Quantification of Meg3 expression by qRT-PCR after Meg3 siRNA (A) or Meg3 overexpression plasmid (B) treatment. (C–D) Quantification of miR-93-5p expression by qRT-PCR after Meg3 siRNA (C) or Meg3 overexpression plasmid (D) treatment. (E–F) Quantification of inflammatory cytokines expression by qRT-PCR after Meg3 overexpression plasmid (E) or Meg3 siRNA (F) treatment. (G) WB analysis of Ereg, MMP1 and MMP3 after Meg3 overexpression plasmid or Meg3 siRNA treatment.
Meg3 functions as a sponge for miR-93-5p in murine skin fibroblasts
The ceRNA mechanism played an essential role in the development and regulation of inflammatory skin diseases including solar dermatitis, atopic dermatitis, and psoriasis, etc [56–58]. As reported earlier in the ceRNA network, mmu-miR-93-5p were potential target microRNA of Meg3, and played a vital role in inflammation, cancer, Alzheimer’s disease, and diabetes [59–62]. Therefore, miR-93-5p was chosen as a potential Meg3 candidate for experimental validation. Luciferase reporter assay was used with wild-type and a mutant-type Meg3 reporter, respectively, to determine the direct interaction between lncRNA Meg3 and miR-93-5p (Figure 5A). The luciferase activities of wild-type Meg3 reporter genes were significantly suppressed by miR-93-5p mimic and elevated by miR-93-5p inhibitor, respectively. No significant changes in luciferase activities of the mutant-type Meg3 reporter genes were observed after its’ treatment with miR-93-5p mimic or inhibitor (Figure 5B). As an important part of RNA-induced silencing complexes (RISCs), ncRNAs often performed gene post-transcriptional gene regulatory functions via RISCs. Typically, the microRNAs directly binds with target RNAs that result in RNA degradation via an ago2-mediated pathway [23, 24]. As shown in Figure 5C, qRT-PCR analysis of RIP assay (RNA immunoprecipitation) demonstrated that the miR-93-5p expression significantly increased the anti-ago2 group having a wild-type Meg3; and, the difference between IgG group and anti-ago2 group with mutant-type Meg3 were also prominent. As compared to wild-type Meg3, the mutant-type Meg3 levels significantly declined in the anti-ago2 group. These results suggested that miR-93-5p was a direct target miRNA of lncRNA Meg3, and their interactions result in RISC-mediated degradation via an ago2-dependent manner.
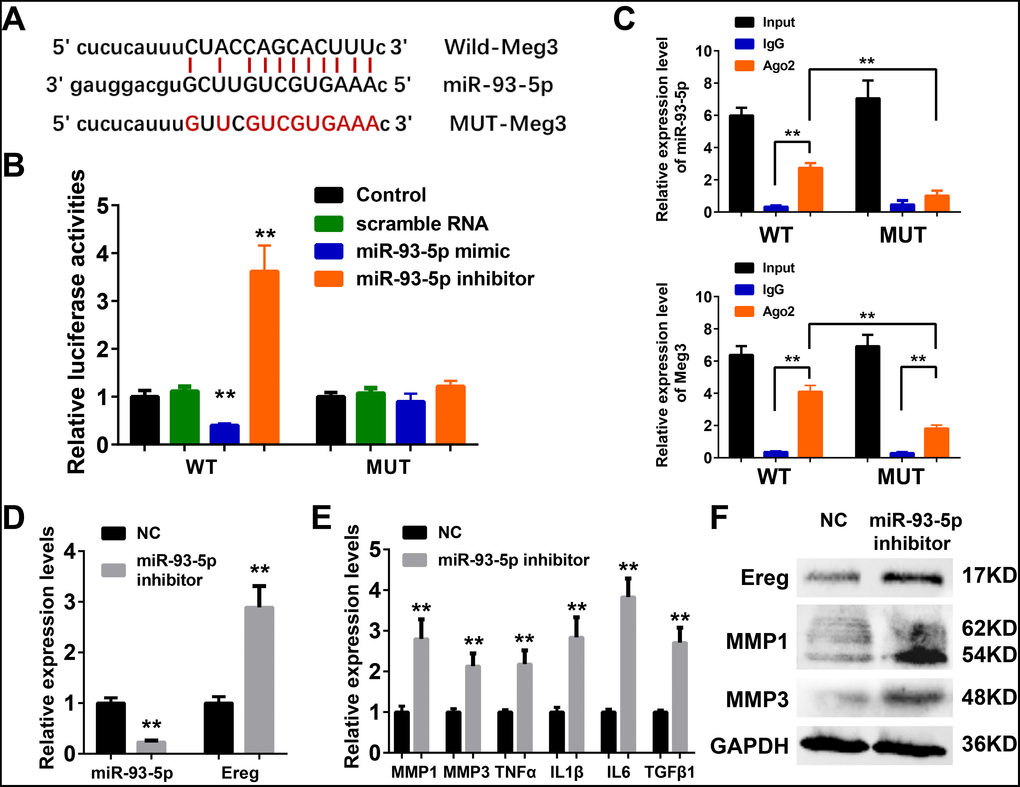
Figure 5. (A) The binding region between Meg3 and miR-93-5p were predicted, and the sequences of wild-type Meg3 (WT-Meg3) or mutant Meg3 (MUT-Meg3) sequences were shown. (B) The directly binding between Meg3 and miR-93-5p were confirmed by a luciferase reporter assay was performed with the luciferase reporter plasmids of WT-Meg3 or MUT-Meg3. (C) RNA immunoprecipitation (RIP) was performed using input from cell lysate, IgG, or anti-Ago2. The relative expression levels of Meg3 and miR-93-5p were detected by qPCR. (D) The inhibitory efficiency of miR-93-5p inhibitor and its effects on Ereg expression were determined by qRT-PCR. (E) The influences of miR-93-5p inhibitor on the expression of inflammatory cytokines were determined by qRT-PCR. (F) The influences of miR-93-5p inhibitor on the protein expression of Ereg, MMP1 and MMP3 were determined by WB.
MiR-93-5p inhibitor promoted inflammatory response by targeting Ereg in murine skin fibroblasts
As depicted in Figure 5D, a synthetic miR-93-5p inhibitor remarkably suppressed the RNA levels of miR-93-5p and increased the mRNA levels of Ereg, respectively. The bioactivities of miR-93-5p inhibition were validated by qRT-PCR assay and WB analysis of the inflammatory cytokines. The mRNA levels of MMP1, MMP3, TNFα, IL1β, IL6, and TGFβ1 were elevated after miR-93-5p inhibitor incubation (Figure 5E). The protein expression levels of Ereg, MMP1, and MMP3 were also increased in miR-93-5p inhibitor-treated group. In summary, the inhibition of miR-93-5p stimulated the expression of inflammatory cytokines in murine skin fibroblasts.
In the constructed ceRNA network, Ereg was predicted as a potential target of miR-93-5p in Targetscan, Starbase, miRTarBase, and miRDB database. As shown in Figure 6A, the miR-93-5p binding site is located in the 3’UTR of Ereg gene. In the luciferase reporter assay, the mRNA levels of Ereg were determined by the qRT-PCR analysis. In the wild-type Ereg group, Ereg was suppressed by miR-93-5p mimic and elevated by miR-93-5p inhibitor, respectively. No significant changes were observed in the mutant-type Ereg group after miR-93-5p mimic or inhibitor treatment (Figure 6B).
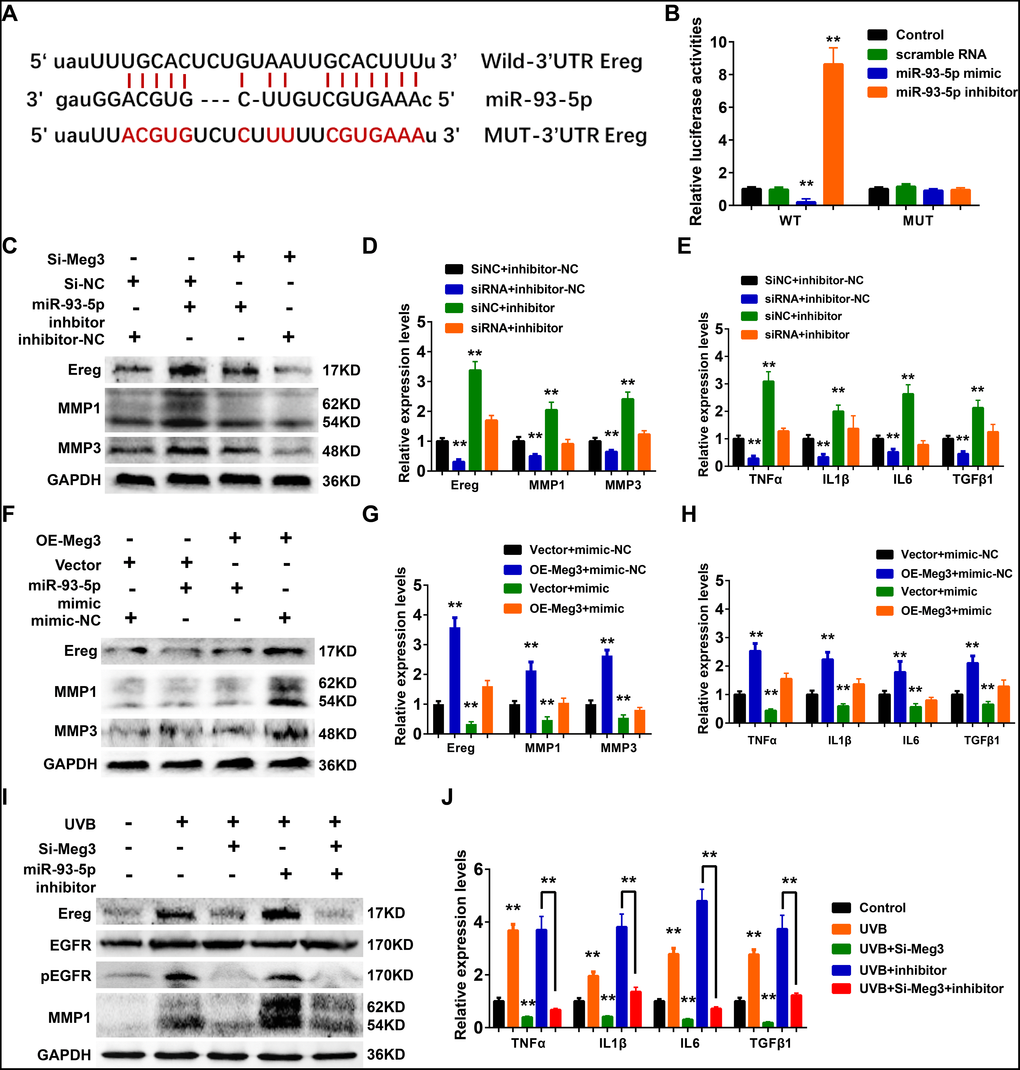
Figure 6. (A) The binding region between Ereg and miR-93-5p were predicted, and the sequences of wild-type Ereg (WT-Ereg) or mutant Ereg (MUT-Ereg) sequences were shown. (B) The directly binding between Ereg and miR-93-5p were confirmed by a luciferase reporter assay was performed with the luciferase reporter plasmids of WT-Meg3 or MUT-Meg3. (C) The protein expression of Ereg, MMP1 and MMP3 were determined by Western blot. Cells were transfected with miR-93-5p inhibitor or siRNA Meg3. (D) The inhibitory efficiency of miR-93-5p inhibitor and/or siRNA Meg3 for their effects on Ereg, MMP1 and MMP3 expression were determined by qRT-PCR. (E) The inhibitory efficiency of miR-93-5p inhibitor and/or siRNA Meg3 for their effects on inflammatory cytokines expression were determined by qRT-PCR. (F) The protein expression of Ereg, MMP1 and MMP3 were determined by Western blot. Cells were transfected with miR-93-5p mimic or pcDNA-Meg3 plasmid. (G) The effects of miR-93-5p mimic and/or Meg3 overexpressed plasmid on Ereg, MMP1 and MMP3 expression were determined by qRT-PCR. (H) The effects of miR-93-5p mimic and/or Meg3 overexpressed plasmid on inflammatory cytokines expression were determined by qRT-PCR. (I) The protein expression of Ereg, EGFR, pEGFR and MMP1 were determined by Western blot. Cells were transfected with miR-93-5p inhibitor and/or siRNA Meg3 after UVB irradiation. (J) The effects of miR-93-5p inhibitor and/or siRNA Meg3 on inflammatory cytokines expression were determined by qRT-PCR.
Ereg was first identified from the cultured medium of fibroblast-derived tumor cell lines and directly bound to activate EGFR, and ERBB4 [63–65]. Ereg was reported to interfere the proliferation and regeneration of several organs, including colon, liver, and salivary glands. It could also control inflammation and immune-related signaling pathways which were involved in the pathological processes of renal fibrosis, rheumatoid arthritis, and cancers. In healthy tissues, the expression levels of Ereg were reported to be low; whereas, they were up-regulated in cancer and inflammatory diseases [66–69].
WB results showed that Ereg, MMP1, and MMP3 expression increased after miR-93-5p inhibitor treatment, and the addition of siRNA-Ereg could reverse the up-regulated expression of these proteins (Figure 6C). qRT-PCR results of inflammatory cytokines demonstrated that miR-93-5p inhibitor elevated mRNA levels of Ereg, MMP1, MMP3, TNFα, IL1β, IL6, TGFβ1, and siRNA-Meg3 which played an antagonistic role to a miR-93-5p inhibitor (Figure 6D and 6E). Besides, the overexpression of adenovirus significantly increased the mRNA and protein levels of Ereg, MMP1, and MMP3 (Figure 6F and 6G). Similar results were also prominent in the qRT-PCR results of other inflammatory cytokines, including TNFα, IL1β, IL6, and TGFβ1 (Figure 6H). As expected, the miR-93-5p mimic suppressed the inflammatory effects of Ereg overexpression. In summary, the UVB irradiation stimulated lncRNA Meg3 expression, which activated Ereg expression, and resulted downstream EGFR phosphorylation levels increased, and activation of the inflammatory cytokines via acting as the miR-93-5p sponges (Figure 6I). With the addition of siRNA-Meg3 and miR-93-5p inhibitor, these effects were either suppressed or stimulated. The qRT-PCR results of several inflammatory cytokines confirmed the protective potencies of siRNA-Meg3 and inflammatory activities of miR-93-5p inhibitor in UVB-irradiated murine fibroblasts (Figure 6J).
SiRNA-Meg3 suppresses UVB-induced murine skin lesion in vivo
The protective effects of siRNA-Meg3 in UVB-irradiated skin lesion via sponging with miR-93-5p/Ereg prompted us to further validate this ceRNA mechanism in a murine UVB photodamaged model of murine skin. The siRNA-Meg3 was loaded in a cationic liposome and intravenously injected to nude mice, followed by 14-days of continuous UVB irradiation. Erythema scores on the dorsal skin of mice reached peaks within 3–7 days of UVB and UVB exposure plus si-NC groups. In the si-Meg3 treated group, there were lower erythema scores than that of UVB or UVB plus si-NC groups (Figure 7A). qRT-PCR results of Meg3, Ereg, and miR-93-5p showed that the UVB irradiation significantly inhibited miR-93-5p expression and increased the expression of Meg3 and Ereg, respectively. Moreover, the addition of si-Meg3 partially reversed the declined miR-93-5p and elevated Ereg expression after the UVB irradiation (Figure 7B). The H&E (hematoxylin and eosin) staining of the murine dorsal skin tissue confirmed that the UVB irradiation led to inflammatory changes, including increased epidermis thickness, hyperkeratosis, and hyperplastic sebaceous glands. The administration of siRNA-Meg3 partially reversed these morphological changes, which further confirmed the protective potential of the UVB-induced photodamage (Figure 7C). FISH analysis of lncRNA Meg3 demonstrated significant differences in the Meg3 levels between the control, and UVB irradiated groups, as well as the si-NC, and siRNA-Meg3 treated groups, respectively (Figure 7D). The overall distributions of Meg3 did not overlap with DAPI, which suggested Meg3 was probably located in the cytoplasm or extracellular matrix. We further determined the expression levels of Ereg, EGFR, pEGFR, MMP1, MMP3, and TNFα in each group by immunohistochemistry (Figure 8). As compared with the in vitro experiments, the expression of Ereg, pEGFR, MMP1, MMP3, and TNFα were significantly elevated in the UVB-irradiated group. No other changes were noticed in EGFR expression in all the groups; the decreased expression levels of Ereg, pEGFR, MMP1, MMP3, and TNFα in the si-Meg3 group varied from those of the si-NC group. These results were consistent with those of the UVB-irradiated murine fibroblasts, which revealed that the Meg3 mediated inflammatory response via sponging miR-93-5p/Ereg axis after the UVB irradiation.
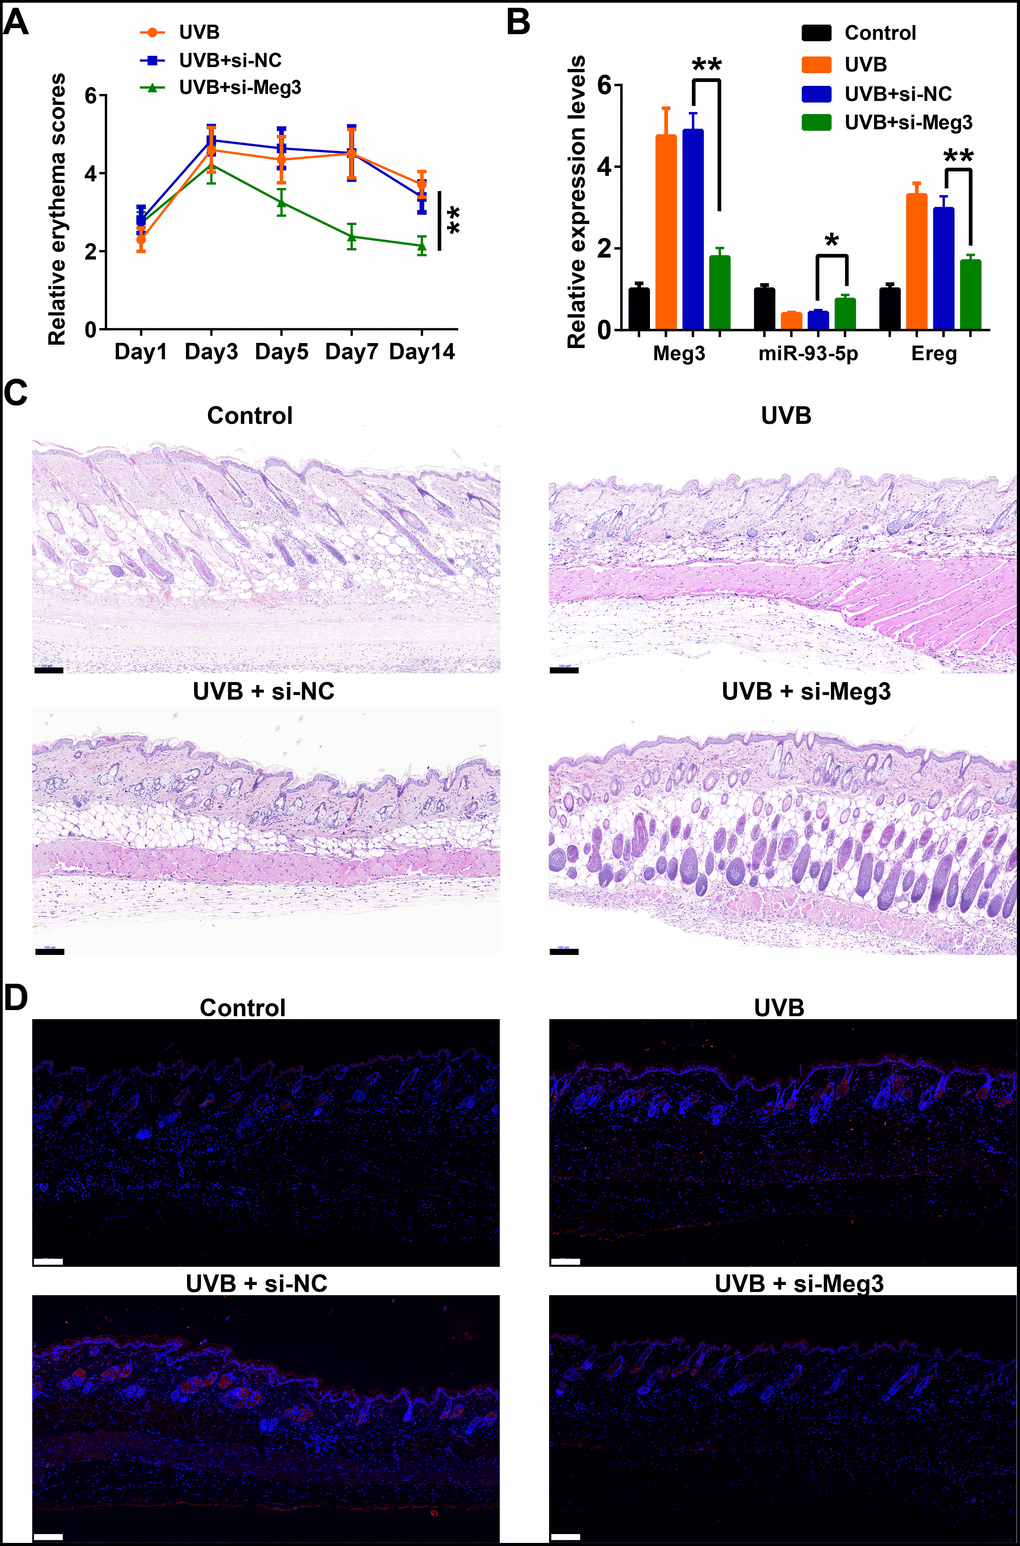
Figure 7. Meg3 siRNA alleviates UVB-induced skin lesions in a mouse model. (A) Measurement of average erythema score of the murine dorsal skin with or without UVB irradiation. Values presented as mean ± SD. (B) Relative expression levels of Meg3, miR-93-5p and Ereg were determined by qRT-PCR. (C) H&E staining of the murine dorsal skin sample after UVB irradiation with or without si-Meg3 treatment (scale bar = 100 μm). (D) FISH of Meg3 in the murine dorsal skin sample after UVB irradiation with or without si-Meg3 treatment (scale bar = 100 μm).
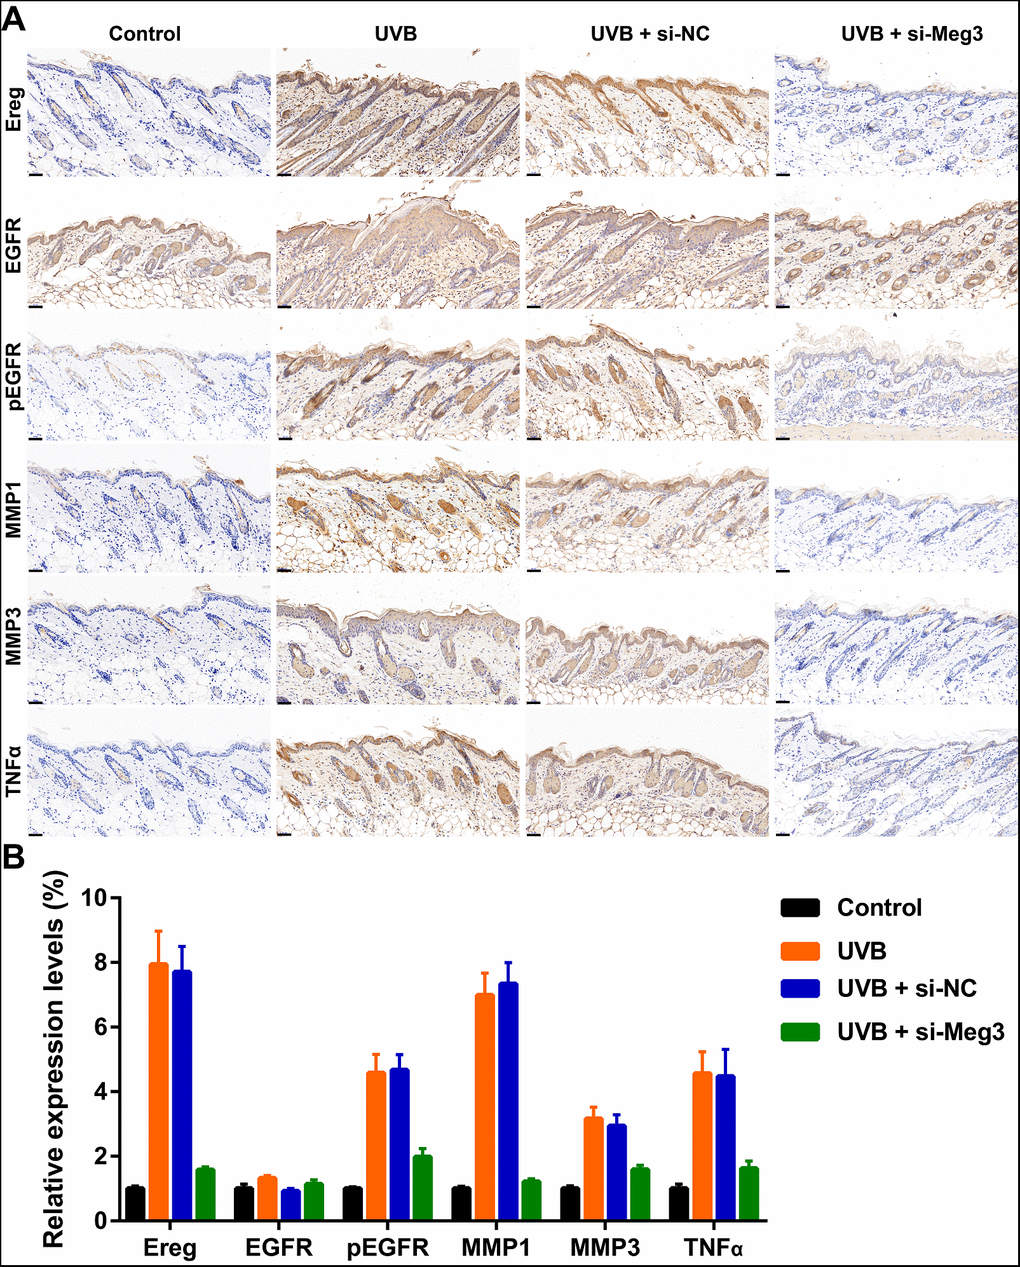
Figure 8. (A) Immunohistochemical staining for Ereg, EGFR, pEGFR, MMP1, MMP3 and TNFα in skin samples (scale bar = 50 μm). (B) The quantification analysis of relative expression levels.
Discussion
With the destruction of the ozone layer, the risk of skin damage due to increasing levels of ultraviolet radiation is alarming [ref]. Ultraviolet radiation can cause skin diseases by inducing DNA damage to the skin cells, oxidative stress, and programmed cell death [70]. According to the literature, lncRNA plays a vital role in the inflammatory responses, i.e., it controls the expression level changes of the immune cells during their differentiation, which affect other immune responses [71–74]. LncRNAs also control the inflammatory response by directly acting on the expression of inflammatory factors. LncRNAs participate in the immune and inflammatory pathways via a variety of mechanisms which plays a vital role in many skin diseases such as psoriasis, eczema, and photodamage. Sonkoly et al. reported that lncRNA-PRINS was overexpressed in the lesion tissues of psoriasis patients [75]. LncRNA-PRINS could increase the sensitivity of keratinocytes to spontaneous apoptosis by up-regulating the expression of GIP3, which promoted the proliferation of keratinocytes, and affected the development of psoriasis. Qiao et al. reported that lncRNA MSX2P1 could suppress miR-6731-5p in IL-22 stimulated keratinocytes which activated the expression of S100A7, IL-23, NFκB and TNFα [76]. LncRNA Meg3 located at chromosome 14q32 could encode a 1.5kb length transcript related to various human cancers. For the non-cancer diseases, Braconi et al. reported that overexpressed Meg3 significantly suppressed cell proliferation and induced apoptosis in human liver cancer cells. He et al. reported that Meg3 stimulated the pathogenesis and progress of liver fibrosis by activating HSC via a TGF-β1 dependent manner [77]. Furthermore, the expression level of Meg3 declined in fibrotic liver tissues after carbon tetrachloride (CCl4) treatment. Recently, Zhao et al. reported that Meg3 activated apoptosis in myocardial cells in hypoxic atmosphere mediated by FoxO1 pathway [78] Zha et al. reported that Meg3 sponged miR-181a/Egr-1/TLR4 signaling axis and activated inflammatory responses in diabetic nephropathy [33]. To our knowledge, competed endogenous RNA was one of the most important mechanism of lncRNA to regulate target gene expression in inflammatory response and cancer. For lncRNA Meg3, there was a panel of reports of its biological functions via the ceRNA mechanism. Recently, Zhang et al. reported that Meg3 suppressed laryngeal cancer cell proliferation via sponging miR-23a/APAF-1 axis [79]. Chen et al. reported that Meg3 alleviated ECM degradation in osteoarthritis chondrocytes by targeting miR-93/TGFBR2 axis [80]. Huang et al. reported that Meg3 could directly bind with miR-27a as a ceRNA and activate PHLPP2 expression to inhibit bladder cancer cells invasion [34]. Meg3 also affected the Treg/Th17 balance in asthma patients via miR-17/RORγt axis [81]. Although there was a panel of reports related to Meg3-mediated inflammatory responses, the role and mechanism of Meg3 in inflammatory skin disease and UVB-related damage remained unclear.
In the current study, lncRNA Meg3 was predicted as an inflammation mediator in the lncRNA reannotation of microarray data in UVB irradiated murine dorsal skin tissues. The WGCNA and ceRNA network analysis predicted that Meg3 sponged miR-93-5p and epiregulin by a lncRNA-miRNA-mRNA competed endogenous mechanism. Both qRT-PCR and FISH results validated that Meg3 was upregulated in UVB irradiated murine skin tissues. As one of the main component in the extracellular matrix of skin tissue, collagen was usually degraded by MMP1/3 under inflammatory or cancer microenvironment. Our results also suggested that MMP1 and MMP3 were useful markers for UVB-induced skin tissue injury. MMP1, MMP3, and Ereg were overexpressed after UVB irradiation at RNA and protein levels, respectively. The overexpressed proteins could be reversed by siRNA-Meg3 in primary murine skin fibroblasts. Both luciferase and RNA-pulldown assays indicated that the direct binding of miR-93-5p with Meg3 and Ereg, respectively. Our results further suggested that the UVB induced inflammatory skin lesions were dependent on Meg3/miR-93-5p/Ereg axis by a ceRNA mechanism.
In conclusion, our results suggested that lncRNA reannotation, bioinformatics analysis, and ceRNA network construction were valid predicted methods for discovering novel lncRNAs related to the identified biological functions and mechanisms. The current research revealed that lncRNA Meg3 upregulated Ereg mRNA levels by sponging miR-93-5p function via ceRNA mechanism. LncRNA Meg3 stimulated inflammatory responses after UVB irradiation both in vitro and in vivo. The RNA silence of Meg3 relieved UVB-induced photodamage by suppressing the MMP1/3 expression and inflammatory cytokine activation. Our results suggested that lncRNA Meg3 could potentially act as a biomarker and therapeutic target for UVB-induced skin injury. These results also provide a basis for the combination of bioinformatics, data mining, and experimental validation as an effective protocol to discover bioactive lncRNAs in diverse diseases.
Materials and Methods
LncRNA reannotation
LncRNA annotations were collected from two sources, i.e., the catalog of lncRNAs from the Gencode database (Mus musculus GRCm38.p6) and the catalog of lncRNAs generated based on the transcriptome assembly from RNA-seq data. Once such transcript of LncRNA overlapped on the same strand between these two sources, and therefore, the Ensembl annotation was kept to avoid redundancy. The probes that were mapped uniquely to the genome with no mismatch were kept; other probes that were mapped to protein-coding transcripts or pseudogene transcripts were removed. We obtained probes, and corresponding lncRNA genes with at least three probes by matching the rest of the probes to the ncRNA sequences. The lncRNA expression was quantile normalized across different biological samples.
Cell culture and UVB radiation
The primary murine skin fibroblasts were obtained according to the previous reports [82–84] and cultured in Dulbecco’s Modified Eagle’s Medium supplemented with 10% fetal bovine serum and 1% penicillin-streptomycin (Life Technologies) in 5% CO2 at 37 °C. The cells were washed and covered with a thin layer of PBS for UV irradiation. Mock-irradiated controls without UVB irradiation followed the same schedule of medium changes. For irradiation, a UVB lamp was used to deliver uniform irradiation at a distance of 15 cm, and the radiation intensity was monitored using a UVB light meter. The irradiation dosage of 100 mJ/cm2 was used, the cells were washed twice by PBS buffer and then incubated with DMEM culture after UVB irradiation.
ELISA and Western blot assays
An ELISA kit (Raybiotech, Inc.) was used to detect the secretion of MMP-1 and MMP-3 following the manufacturer's protocol. Proteins were extracted using a radioimmunoprecipitation assay buffer (Beyotime Institute of Biotechnology). Proteins quantified by a BCA protein assay kit were separated by 8%–10% SDS–PAGE, and then transferred onto polyvinylidene fluoride membranes (Millipore). The membranes were blocked with nonfat milk at room temperature for 2 h. The membranes were then incubated with primary antibodies overnight at 4 °C and HRP-conjugated secondary antibodies (Beyotime Institute of Biotechnology) for 1 h at room temperature. An enhanced chemiluminescence reagent (Beyotime Institute of Biotechnology) was used to visualize the blots. The band densities were analyzed using the software ImageQuant (Bio-Rad, ChemiDoc MP).
Animal study
All animal experiments were performed following the protocol approved by the Institutional Animal Care and Use Committee of the West China Hospital. Female Balb/c nude mice (6 weeks) were purchased from the Animal Center of Sichuan University (China). Mouse dorsal skin (each group, n = 6) was exposed to UVB irradiation at 300 mJ/cm2 according to our previous reports.55 Samples were given intravenous injection using a vehicle or siRNA-Meg3 lipoplex followed by UVB irradiation thrice a week for two weeks. Erythema in the skin of mice was evaluated following established protocols, and the mean grades were calculated at each time point after UVB irradiation. The brief protocol of lipoplex preparation was described below, DOTAP (dioleoyl trimethylammonium propane) and cholesterol (molar ratio 1:1) were dissolved in chloroform, and then the solvent was evaporated to form a lipid film. The lipid film was rehydrated in 5% Dextrose at 60 °C for 30 min, and the dispersed by a bath sonicate at 60 °C for 10 min to form cationic liposomes. The scramble siRNA or si-Meg3 were incubated to the cationic liposomes (w/w 1:20 or 1:30) at 37 °C for 10 min. Finally, the lipoplex was extruded through a 100 nm polycarbonate filter by using a Mini-Extruder instrument.
Ethical approval
All procedures involving animals were performed in compliance with guidelines of the Chengdu University of Traditional Chinese Medicine.
Conflicts of Interest
The authors declare that they have no conflicts of interest.
Funding
We are grateful for financial support from the National Natural Science Foundation of China (21772131, 818732535, 81573589 and 81773889), the Science and Technology Department of Sichuan Province (2019YFSY0004).
References
- 1. Denecker G, Hoste E, Gilbert B, Hochepied T, Ovaere P, Lippens S, Van den Broecke C, Van Damme P, D’Herde K, Hachem JP, Borgonie G, Presland RB, Schoonjans L, et al. Caspase-14 protects against epidermal UVB photodamage and water loss. Nat Cell Biol. 2007; 9:666–74. https://doi.org/10.1038/ncb1597 [PubMed]
- 2. Seité S, Fourtanier A, Moyal D, Young AR. Photodamage to human skin by suberythemal exposure to solar ultraviolet radiation can be attenuated by sunscreens: a review. Br J Dermatol. 2010; 163:903–14. https://doi.org/10.1111/j.1365-2133.2010.10018.x [PubMed]
- 3. Walker SL, Young AR. An action spectrum (290-320 nm) for TNFalpha protein in human skin in vivo suggests that basal-layer epidermal DNA is the chromophore. Proc Natl Acad Sci USA. 2007; 104:19051–54. https://doi.org/10.1073/pnas.0703385104 [PubMed]
- 4. Goyarts EC, Dong K, Pelle E, Pernodet N. Effect of SIRT6 knockdown on NF-κB induction and on residual DNA damage in cultured human skin fibroblasts. J Cosmet Sci. 2017; 68:25–33. [PubMed]
- 5. Lee KJ, Park KH, Hahn JH. Alleviation of Ultraviolet-B Radiation-Induced Photoaging by a TNFR Antagonistic Peptide, TNFR2-SKE. Mol Cells. 2019; 42:151–60. https://doi.org/10.14348/molcells.2018.0423 [PubMed]
- 6. Mirzoeva S, Tong X, Bridgeman BB, Plebanek MP, Volpert OV. Apigenin Inhibits UVB-Induced Skin Carcinogenesis: The Role of Thrombospondin-1 as an Anti-Inflammatory Factor. Neoplasia. 2018; 20:930–42. https://doi.org/10.1016/j.neo.2018.07.005 [PubMed]
- 7. Takabe P, Kärnä R, Rauhala L, Tammi M, Tammi R, Pasonen-Seppänen S. Melanocyte Hyaluronan Coat Fragmentation Enhances the UVB-Induced TLR-4 Receptor Signaling and Expression of Proinflammatory Mediators IL6, IL8, CXCL1, and CXCL10 via NF-κB Activation. J Invest Dermatol. 2019; 139:1993–2003.e4. https://doi.org/10.1016/j.jid.2019.03.1135 [PubMed]
- 8. Li X, Wu Z, Fu X, Han W. Long Noncoding RNAs: Insights from Biological Features and Functions to Diseases. Med Res Rev. 2013; 33:517–53. https://doi.org/10.1002/med.21254 [PubMed]
- 9. Deng J, Kong W, Wang S, Mou X, Zeng W. Prior Knowledge Driven Joint NMF Algorithm for ceRNA Co-Module Identification. Int J Biol Sci. 2018; 14:1822–33. https://doi.org/10.7150/ijbs.27555 [PubMed]
- 10. Feng C, Shen JM, Lv PP, Jin M, Wang LQ, Rao JP, Feng L. Construction of implantation failure related lncRNA-mRNA network and identification of lncRNA biomarkers for predicting endometrial receptivity. Int J Biol Sci. 2018; 14:1361–77. https://doi.org/10.7150/ijbs.25081 [PubMed]
- 11. Fu M, Huang Z, Zang X, Pan L, Liang W, Chen J, Qian H, Xu W, Jiang P, Zhang X. Long noncoding RNA LINC00978 promotes cancer growth and acts as a diagnostic biomarker in gastric cancer. Cell Prolif. 2018; 51:e12425. https://doi.org/10.1111/cpr.12425 [PubMed]
- 12. Li Z, Li X, Chen C, Li S, Shen J, Tse G, Chan MT, Wu WK. Long non-coding RNAs in nucleus pulposus cell function and intervertebral disc degeneration. Cell Prolif. 2018; 51:e12483. https://doi.org/10.1111/cpr.12483 [PubMed]
- 13. Liu XF, Hao JL, Xie T, Pant OP, Lu CB, Lu CW, Zhou DD. The BRAF activated non-coding RNA: A pivotal long non-coding RNA in human malignancies. Cell Prolif. 2018; 51:e12449. https://doi.org/10.1111/cpr.12449 [PubMed]
- 14. Pan Y, Wu Y, Hu J, Shan Y, Ma J, Ma H, Qi X, Jia L. Long noncoding RNA HOTAIR promotes renal cell carcinoma malignancy through alpha-2, 8-sialyltransferase 4 by sponging microRNA-124. Cell Prolif. 2018; 51:e12507. https://doi.org/10.1111/cpr.12507 [PubMed]
- 15. Qiu JJ, Lin XJ, Tang XY, Zheng TT, Lin YY, Hua KQ. Exosomal Metastasis-Associated Lung Adenocarcinoma Transcript 1 Promotes Angiogenesis and Predicts Poor Prognosis in Epithelial Ovarian Cancer. Int J Biol Sci. 2018; 14:1960–73. https://doi.org/10.7150/ijbs.28048 [PubMed]
- 16. She K, Yan H, Huang J, Zhou H, He J. miR-193b availability is antagonized by LncRNA-SNHG7 for FAIM2-induced tumour progression in non-small cell lung cancer. Cell Prolif. 2018; 51:e12406. https://doi.org/10.1111/cpr.12406 [PubMed]
- 17. Zhang ZC, Tang C, Dong Y, Zhang J, Yuan T, Tao SC, Li XL. Targeting the long noncoding RNA MALAT1 blocks the pro-angiogenic effects of osteosarcoma and suppresses tumour growth. Int J Biol Sci. 2017; 13:1398–408. https://doi.org/10.7150/ijbs.22249 [PubMed]
- 18. Jiao H, Xie D, Qiao Y. LncRNA PRINS is involved in the development of nephropathy in patients with diabetes via interaction with Smad7. Exp Ther Med. 2019; 17:3203–08. https://doi.org/10.3892/etm.2019.7307 [PubMed]
- 19. Wu GC, Pan HF, Leng RX, Wang DG, Li XP, Li XM, Ye DQ. Emerging role of long noncoding RNAs in autoimmune diseases. Autoimmun Rev. 2015; 14:798–805. https://doi.org/10.1016/j.autrev.2015.05.004 [PubMed]
- 20. Soltanzadeh-Yamchi M, Shahbazi M, Aslani S, Mohammadnia-Afrouzi M. MicroRNA signature of regulatory T cells in health and autoimmunity. Biomed Pharmacother. 2018; 100:316–323. https://doi.org/10.1016/j.biopha.2018.02.030 [PubMed]
- 21. Xu WD, Pan HF, Li JH, Ye DQ. MicroRNA-21 with therapeutic potential in autoimmune diseases. Expert Opin Ther Targets. 2013; 17:659–65. https://doi.org/10.1517/14728222.2013.773311 [PubMed]
- 22. Bhattacharya M, Ghosh S, Malick RC, Patra BC, Das BK. Therapeutic applications of zebrafish (Danio rerio) miRNAs linked with human diseases: A prospective review. Gene. 2018; 679:202–11. https://doi.org/10.1016/j.gene.2018.09.008 [PubMed]
- 23. Xiang Z, Yang Y, Chang C, Lu Q. The epigenetic mechanism for discordance of autoimmunity in monozygotic twins. J Autoimmun. 2017; 83:43–50. https://doi.org/10.1016/j.jaut.2017.04.003 [PubMed]
- 24. Cheung L, Fisher RM, Kuzmina N, Li D, Li X, Werngren O, Blomqvist L, Ståhle M, Landén NX. Psoriasis Skin Inflammation-Induced microRNA-26b Targets NCEH1 in Underlying Subcutaneous Adipose Tissue. J Invest Dermatol. 2016; 136:640–48. https://doi.org/10.1016/j.jid.2015.12.008 [PubMed]
- 25. Granata M, Skarmoutsou E, Trovato C, Rossi GA, Mazzarino MC, D'Amico F. Obesity, Type 1 Diabetes, and Psoriasis: An Autoimmune Triple Flip. Pathobiology. 2017; 84:71–79. https://doi.org/10.1159/000447777 [PubMed]
- 26. Mikovic J, Sadler K, Butchart L, Voisin S, Gerlinger-Romero F, Della Gatta P, Grounds MD, Lamon S. MicroRNA and Long Non-coding RNA Regulation in Skeletal Muscle From Growth to Old Age Shows Striking Dysregulation of the Callipyge Locus. Front Genet. 2018; 9:548. https://doi.org/10.3389/fgene.2018.00548 [PubMed]
- 27. Noren Hooten N, Evans MK. Age and poverty status alter the coding and noncoding transcriptome. Aging (Albany NY). 2019; 11:1189–203. https://doi.org/10.18632/aging.101823 [PubMed]
- 28. Schneider E, Pliushch G, El Hajj N, Galetzka D, Puhl A, Schorsch M, Frauenknecht K, Riepert T, Tresch A, Müller AM, Coerdt W, Zechner U, Haaf T. Spatial, temporal and interindividual epigenetic variation of functionally important DNA methylation patterns. Nucleic Acids Res. 2010; 38:3880–90. https://doi.org/10.1093/nar/gkq126 [PubMed]
- 29. Zhuo ZJ, Zhang R, Zhang J, Zhu J, Yang T, Zou Y, He J, Xia H. Associations between lncRNA MEG3 polymorphisms and neuroblastoma risk in Chinese children. Aging (Albany NY). 2018; 10:481–91. https://doi.org/10.18632/aging.101406 [PubMed]
- 30. Dong Z, Zhang A, Liu S, Lu F, Guo Y, Zhang G, Xu F, Shi Y, Shen S, Liang J, Guo W. Aberrant Methylation-Mediated Silencing of lncRNA MEG3 Functions as a ceRNA in Esophageal Cancer. Molecular cancer research. Mol Cancer Res. 2017; 15:800–10. https://doi.org/10.1158/1541-7786.MCR-16-0385 [PubMed]
- 31. Qiu YY, Wu Y, Lin MJ, Bian T, Xiao YL, Qin C. LncRNA-MEG3 functions as a competing endogenous RNA to regulate Treg/Th17 balance in patients with asthma by targeting microRNA-17/ RORγt. Biomed Pharmacother. 2019; 111:386–394. https://doi.org/10.1016/j.biopha.2018.12.080 [PubMed]
- 32. Peng W, Si S, Zhang Q, Li C, Zhao F, Wang F, Yu J, Ma R. Long non-coding RNA MEG3 functions as a competing endogenous RNA to regulate gastric cancer progression. J Exp Clin Cancer Res. 2015; 34:79. https://doi.org/10.1186/s13046-015-0197-7 [PubMed]
- 33. Zha F, Qu X, Tang B, Li J, Wang Y, Zheng P, Ji T, Zhu C, Bai S. Long non-coding RNA MEG3 promotes fibrosis and inflammatory response in diabetic nephropathy via miR-181a/Egr-1/TLR4 axis. Aging (Albany NY). 2019; 11:3716–30. https://doi.org/10.18632/aging.102011 [PubMed]
- 34. Huang C, Liao X, Jin H, Xie F, Zheng F, Li J, Zhou C, Jiang G, Wu XR, Huang C. MEG3, as a Competing Endogenous RNA, Binds with miR-27a to Promote PHLPP2 Protein Translation and Impairs Bladder Cancer Invasion. Mol Ther Nucleic Acids. 2019; 16:51–62. https://doi.org/10.1016/j.omtn.2019.01.014 [PubMed]
- 35. Yan H, Rao J, Yuan J, Gao L, Huang W, Zhao L, Ren J. Long non-coding RNA MEG3 functions as a competing endogenous RNA to regulate ischemic neuronal death by targeting miR-21/PDCD4 signaling pathway. Cell Death Dis. 2017; 8:3211. https://doi.org/10.1038/s41419-017-0047-y [PubMed]
- 36. Shi X, Sun M, Liu H, Yao Y, Song Y. Long non-coding RNAs: a new frontier in the study of human diseases. Cancer Lett. 2013; 339:159–66. https://doi.org/10.1016/j.canlet.2013.06.013 [PubMed]
- 37. Wang H, Li H, Zhang L, Yang D. Overexpression of MEG3 sensitizes colorectal cancer cells to oxaliplatin through regulation of miR-141/PDCD4 axis. Biomed Pharmacother. 2018; 106:1607–1615. https://doi.org/10.1016/j.biopha.2018.07.131 [PubMed]
- 38. Zhang J, Liang Y, Huang X, Guo X, Liu Y, Zhong J, Yuan J. STAT3-induced upregulation of lncRNA MEG3 regulates the growth of cardiac hypertrophy through miR-361-5p/HDAC9 axis. Sci Rep. 2019; 9:460. https://doi.org/10.1038/s41598-018-36369-1 [PubMed]
- 39. Degueurce G, D’Errico I, Pich C, Ibberson M, Schütz F, Montagner A, Sgandurra M, Mury L, Jafari P, Boda A, Meunier J, Rezzonico R, Brembilla NC, et al. Identification of a novel PPARβ/δ/miR-21-3p axis in UV-induced skin inflammation. EMBO Mol Med. 2016; 8:919–36. https://doi.org/10.15252/emmm.201505384 [PubMed]
- 40. Du Z, Fei T, Verhaak RG, Su Z, Zhang Y, Brown M, Chen Y, Liu XS. Integrative genomic analyses reveal clinically relevant long noncoding RNAs in human cancer. Nat Struct Mol Biol. 2013; 20:908–13. https://doi.org/10.1038/nsmb.2591 [PubMed]
- 41. Zhang X, Zhang W, Jiang Y, Liu K, Ran L, Song F. Identification of functional lncRNAs in gastric cancer by integrative analysis of GEO and TCGA data. J Cell Biochem. 2019; 120:17898–911. https://doi.org/10.1002/jcb.29058 [PubMed]
- 42. Gligorijević V, Janjić V, Pržulj N. Integration of molecular network data reconstructs Gene Ontology. Bioinformatics. 2014; 30:i594–600. https://doi.org/10.1093/bioinformatics/btu470 [PubMed]
- 43. Ogata H, Goto S, Sato K, Fujibuchi W, Bono H, Kanehisa M. KEGG: Kyoto Encyclopedia of Genes and Genomes. Nucleic Acids Res. 1999; 27:29–34. https://doi.org/10.1093/nar/27.1.29 [PubMed]
- 44. Yu G, Wang LG, Han Y, He QY. clusterProfiler: an R package for comparing biological themes among gene clusters. OMICS. 2012; 16:284–87. https://doi.org/10.1089/omi.2011.0118 [PubMed]
- 45. Joshi-Tope G, Gillespie M, Vastrik I, D’Eustachio P, Schmidt E, de Bono B, Jassal B, Gopinath GR, Wu GR, Matthews L, Lewis S, Birney E, Stein L. Reactome: a knowledgebase of biological pathways. Nucleic Acids Res. 2005; 33:D428–32. https://doi.org/10.1093/nar/gki072 [PubMed]
- 46. Langfelder P, Horvath S. WGCNA: an R package for weighted correlation network analysis. BMC Bioinformatics. 2008; 9:559. https://doi.org/10.1186/1471-2105-9-559 [PubMed]
- 47. Gao J, Wang H, Li Z, Wong AH, Wang YZ, Guo Y, Lin X, Zeng G, Liu H, Wang Y, Wang J. Candida albicans gains azole resistance by altering sphingolipid composition. Nat Commun. 2018; 9:4495. https://doi.org/10.1038/s41467-018-06944-1 [PubMed]
- 48. Hsu SD, Lin FM, Wu WY, Liang C, Huang WC, Chan WL, Tsai WT, Chen GZ, Lee CJ, Chiu CM, Chien CH, Wu MC, Huang CY, et al. miRTarBase: a database curates experimentally validated microRNA-target interactions. Nucleic Acids Res. 2011 (suppl_1); 39:D163–69. https://doi.org/10.1093/nar/gkq1107 [PubMed]
- 49. Wong N, Wang X. miRDB: an online resource for microRNA target prediction and functional annotations. Nucleic Acids Res. 2015; 43:D146–52. https://doi.org/10.1093/nar/gku1104 [PubMed]
- 50. Li JH, Liu S, Zhou H, Qu LH, Yang JH. starBase v2.0: decoding miRNA-ceRNA, miRNA-ncRNA and protein-RNA interaction networks from large-scale CLIP-Seq data. Nucleic Acids Res. 2014; 42:D92–97. https://doi.org/10.1093/nar/gkt1248 [PubMed]
- 51. Yang JH, Li JH, Shao P, Zhou H, Chen YQ, Qu LH. starBase: a database for exploring microRNA-mRNA interaction maps from Argonaute CLIP-Seq and Degradome-Seq data. Nucleic Acids Res. 2011 (suppl_1); 39:D202–09. https://doi.org/10.1093/nar/gkq1056 [PubMed]
- 52. Wang JD, Zhou HS, Tu XX, He Y, Liu QF, Liu Q, Long ZJ. Prediction of competing endogenous RNA coexpression network as prognostic markers in AML. Aging (Albany NY). 2019; 11:3333–47. https://doi.org/10.18632/aging.101985 [PubMed]
- 53. Wang W, Lou W, Ding B, Yang B, Lu H, Kong Q, Fan W. A novel mRNA-miRNA-lncRNA competing endogenous RNA triple sub-network associated with prognosis of pancreatic cancer. Aging (Albany NY). 2019; 11:2610–27. https://doi.org/10.18632/aging.101933 [PubMed]
- 54. Zhang F, Zhang R, Zhang X, Wu Y, Li X, Zhang S, Hou W, Ding Y, Tian J, Sun L, Kong X. Comprehensive analysis of circRNA expression pattern and circRNA-miRNA-mRNA network in the pathogenesis of atherosclerosis in rabbits. Aging (Albany NY). 2018; 10:2266–83. https://doi.org/10.18632/aging.101541 [PubMed]
- 55. Hao D, Wen X, Liu L, Wang L, Zhou X, Li Y, Zeng X, He G, Jiang X. Sanshool improves UVB-induced skin photodamage by targeting JAK2/STAT3-dependent autophagy. Cell Death Dis. 2019; 10:19. https://doi.org/10.1038/s41419-018-1261-y [PubMed]
- 56. Zhu SP, Wang JY, Wang XG, Zhao JP. Long intergenic non-protein coding RNA 00858 functions as a competing endogenous RNA for miR-422a to facilitate the cell growth in non-small cell lung cancer. Aging (Albany NY). 2017; 9:475–86. https://doi.org/10.18632/aging.101171 [PubMed]
- 57. Wang Z, Xu P, Chen B, Zhang Z, Zhang C, Zhan Q, Huang S, Xia ZA, Peng W. Identifying circRNA-associated-ceRNA networks in the hippocampus of Aβ1-42-induced Alzheimer’s disease-like rats using microarray analysis. Aging (Albany NY). 2018; 10:775–88. https://doi.org/10.18632/aging.101427 [PubMed]
- 58. Ye Y, Yang S, Han Y, Sun J, Xv L, Wu L, Wang Y, Ming L. Linc00472 suppresses proliferation and promotes apoptosis through elevating PDCD4 expression by sponging miR-196a in colorectal cancer. Aging (Albany NY). 2018; 10:1523–33. https://doi.org/10.18632/aging.101488 [PubMed]
- 59. Hu B, Mao Z, Du Q, Jiang X, Wang Z, Xiao Z, Zhu D, Wang X, Zhu Y, Wang H. miR-93-5p targets Smad7 to regulate the transforming growth factor-β1/Smad3 pathway and mediate fibrosis in drug-resistant prolactinoma. Brain Res Bull. 2019; 149:21–31. https://doi.org/10.1016/j.brainresbull.2019.03.013 [PubMed]
- 60. Infante T, Forte E, Punzo B, Cademartiri F, Cavaliere C, Soricelli A, Salvatore M, Napoli C. Correlation of Circulating miR-765, miR-93-5p, and miR-433-3p to Obstructive Coronary Heart Disease Evaluated by Cardiac Computed Tomography. Am J Cardiol. 2019; 124:176–82. https://doi.org/10.1016/j.amjcard.2019.04.016 [PubMed]
- 61. Liu J, Jiang M, Deng S, Lu J, Huang H, Zhang Y, Gong P, Shen X, Ruan H, Jin M, Wang H. miR-93-5p-Containing Exosomes Treatment Attenuates Acute Myocardial Infarction-Induced Myocardial Damage. Mol Ther Nucleic Acids. 2018; 11:103–15. https://doi.org/10.1016/j.omtn.2018.01.010 [PubMed]
- 62. Xue H, Tu Y, Ma T, Wen T, Yang T, Xue L, Cai M, Wang F, Guan M. miR-93-5p attenuates IL-1β-induced chondrocyte apoptosis and cartilage degradation in osteoarthritis partially by targeting TCF4. Bone. 2019; 123:129–36. https://doi.org/10.1016/j.bone.2019.03.035 [PubMed]
- 63. Komurasaki T, Toyoda H, Uchida D, Morimoto S. Epiregulin binds to epidermal growth factor receptor and ErbB-4 and induces tyrosine phosphorylation of epidermal growth factor receptor, ErbB-2, ErbB-3 and ErbB-4. Oncogene. 1997; 15:2841–48. https://doi.org/10.1038/sj.onc.1201458 [PubMed]
- 64. Shelly M, Pinkas-Kramarski R, Guarino BC, Waterman H, Wang LM, Lyass L, Alimandi M, Kuo A, Bacus SS, Pierce JH, Andrews GC, Yarden Y. Epiregulin is a potent pan-ErbB ligand that preferentially activates heterodimeric receptor complexes. J Biol Chem. 1998; 273:10496–505. https://doi.org/10.1074/jbc.273.17.10496 [PubMed]
- 65. Toyoda H, Komurasaki T, Uchida D, Takayama Y, Isobe T, Okuyama T, Hanada K. Epiregulin. A novel epidermal growth factor with mitogenic activity for rat primary hepatocytes. J Biol Chem. 1995; 270:7495–500. https://doi.org/10.1074/jbc.270.13.7495 [PubMed]
- 66. Cao Y, Xia DS, Qi SR, Du J, Ma P, Wang SL, Fan ZP. Epiregulin can promote proliferation of stem cells from the dental apical papilla via MEK/Erk and JNK signalling pathways. Cell Prolif. 2013; 46:447–56. https://doi.org/10.1111/cpr.12039 [PubMed]
- 67. Farooqui M, Bohrer LR, Brady NJ, Chuntova P, Kemp SE, Wardwell CT, Nelson AC, Schwertfeger KL. Epiregulin contributes to breast tumorigenesis through regulating matrix metalloproteinase 1 and promoting cell survival. Mol Cancer. 2015; 14:138. https://doi.org/10.1186/s12943-015-0408-z [PubMed]
- 68. Wang Y, Jing Y, Ding L, Zhang X, Song Y, Chen S, Zhao X, Huang X, Pu Y, Wang Z, Ni Y, Hu Q. Epiregulin reprograms cancer-associated fibroblasts and facilitates oral squamous cell carcinoma invasion via JAK2-STAT3 pathway. J Exp Clin Cancer Res. 2019; 38:274. https://doi.org/10.1186/s13046-019-1277-x [PubMed]
- 69. Yang WW, Yang LQ, Zhao F, Chen CW, Xu LH, Fu J, Li SL, Ge XY. Epiregulin Promotes Lung Metastasis of Salivary Adenoid Cystic Carcinoma. Theranostics. 2017; 7:3700–14. https://doi.org/10.7150/thno.19712 [PubMed]
- 70. Ke B, Tian M, Li J, Liu B, He G. Targeting Programmed Cell Death Using Small-Molecule Compounds to Improve Potential Cancer Therapy. Med Res Rev. 2016; 36:983–1035. https://doi.org/10.1002/med.21398 [PubMed]
- 71. Huang M, Wang H, Hu X, Cao X. lncRNA MALAT1 binds chromatin remodeling subunit BRG1 to epigenetically promote inflammation-related hepatocellular carcinoma progression. Oncoimmunology. 2018; 8:e1518628. https://doi.org/10.1080/2162402X.2018.1518628 [PubMed]
- 72. Ma M, Pei Y, Wang X, Feng J, Zhang Y, Gao MQ. LncRNA XIST mediates bovine mammary epithelial cell inflammatory response via NF-κB/NLRP3 inflammasome pathway. Cell Prolif. 2019; 52:e12525. https://doi.org/10.1111/cpr.12525 [PubMed]
- 73. Xue YZ, Li ZJ, Liu WT, Shan JJ, Wang L, Su Q. Down-regulation of lncRNA MALAT1 alleviates vascular lesion and vascular remodeling of rats with hypertension. Aging (Albany NY). 2019; 11:5192–205. https://doi.org/10.18632/aging.102113 [PubMed]
- 74. Zhang P, Cao L, Zhou R, Yang X, Wu M. The lncRNA Neat1 promotes activation of inflammasomes in macrophages. Nat Commun. 2019; 10:1495. https://doi.org/10.1038/s41467-019-09482-6 [PubMed]
- 75. Sonkoly E, Bata-Csorgo Z, Pivarcsi A, Polyanka H, Kenderessy-Szabo A, Molnar G, Szentpali K, Bari L, Megyeri K, Mandi Y, Dobozy A, Kemeny L, Szell M. Identification and characterization of a novel, psoriasis susceptibility-related noncoding RNA gene, PRINS. J Biol Chem. 2005; 280:24159–67. https://doi.org/10.1074/jbc.M501704200 [PubMed]
- 76. Qiao M, Li R, Zhao X, Yan J, Sun Q. Up-regulated lncRNA-MSX2P1 promotes the growth of IL-22-stimulated keratinocytes by inhibiting miR-6731-5p and activating S100A7. Exp Cell Res. 2018; 363:243–54. https://doi.org/10.1016/j.yexcr.2018.01.014 [PubMed]
- 77. He Y, Meng XM, Huang C, Wu BM, Zhang L, Lv XW, Li J. Long noncoding RNAs: novel insights into hepatocelluar carcinoma. Cancer Lett. 2014; 344:20–27. https://doi.org/10.1016/j.canlet.2013.10.021 [PubMed]
- 78. Zhao LY, Li X, Gao L, Xu Y. LncRNA MEG3 accelerates apoptosis of hypoxic myocardial cells via FoxO1 signaling pathway. Eur Rev Med Pharmacol Sci. 2019 (3 Suppl); 23:334–40. https://doi.org/10.26355/eurrev_201908_18665 [PubMed]
- 79. Zhang X, Wu N, Wang J, Li Z. LncRNA MEG3 inhibits cell proliferation and induces apoptosis in laryngeal cancer via miR-23a/APAF-1 axis. J Cell Mol Med. 2019; 23:6708–19. https://doi.org/10.1111/jcmm.14549 [PubMed]
- 80. Chen K, Zhu H, Zheng MQ, Dong QR. LncRNA MEG3 Inhibits the Degradation of the Extracellular Matrix of Chondrocytes in Osteoarthritis via Targeting miR-93/TGFBR2 Axis. Cartilage. 2019. [Epub ahead of print]. https://doi.org/10.1177/1947603519855759 [PubMed]
- 81. Sannigrahi MK, Sharma R, Panda NK, Khullar M. Role of non-coding RNAs in head and neck squamous cell carcinoma: A narrative review. Oral Dis. 2018; 24:1417–27. https://doi.org/10.1111/odi.12782 [PubMed]
- 82. Moullier P, Maréchal V, Danos O, Heard JM. Continuous systemic secretion of a lysosomal enzyme by genetically modified mouse skin fibroblasts. Transplantation. 1993; 56:427–32. https://doi.org/10.1097/00007890-199308000-00034 [PubMed]
- 83. Naffakh N, Henri A, Villeval JL, Rouyer-Fessard P, Moullier P, Blumenfeld N, Danos O, Vainchenker W, Heard JM, Beuzard Y. Sustained delivery of erythropoietin in mice by genetically modified skin fibroblasts. Proc Natl Acad Sci USA. 1995; 92:3194–98. https://doi.org/10.1073/pnas.92.8.3194 [PubMed]
- 84. Rogers KM, Black DH, Eberle R. Primary mouse dermal fibroblast cell cultures as an in vitro model system for the differential pathogenicity of cross-species herpesvirus papio 2 infections. Arch Virol. 2007; 152:543–52. https://doi.org/10.1007/s00705-006-0865-1 [PubMed]