


Introduction
Parkinson’s disease (PD) is the second most common neurodegenerative disease after Alzheimer’s disease (AD) in the elderly people. For over 50 years, levodopa has been the best drug to treat the motor symptoms of PD [1]. However, levodopa-related motor complications including levodopa-induced dyskinesia (LID) and on-off phenomenon limits its usefulness [2]. What’s worse, motor complications not only have a bad effect on the quality of life but also increase treatment cost for PD patients [3]. LID is broadly divided into peak-dose dyskinesia, wearing-off or off-period dyskinesia, and diphasic dyskinesia according to their clinical movement patterns and the temporal correlation between the occurrence of dyskinesia and the levodopa pharmacokinetic changes [4, 5]. Diphasic dyskinesia, initially termed “dyskinesia-improvement-dyskinesia” or “beginning-/end-of-dose dyskinesias”, appear typically at the onset and end of levodopa antiparkinsonian action, coinciding with ascending and descending levodopa levels in the plasma [6]. Among three main categories of LID, diphasic dyskinesia is the most difficult to treat [7]. The reported prevalence of diphasic dyskinesia showed a wide range (from 3% to 20%) in PD patients showing motor fluctuations because of different study methods, selection of patients and patient populations [6]. Up to now, few studies focus on the pathogenesis of diphasic dyskinesia and it is still poorly understood.
Cerasa et al. have carried on several studies to explore alterations in the structure of brain in PD patients with LID [8–10]. They reported that dyskinetic group showed higher gray matter (GM) volume in the bilateral inferior frontal gyrus than nondyskinetic group [8, 9]. Moreover, they found a pronounced increase of thickness in the right inferior frontal sulcus in dyskinetic group when compared with nondyskinetic group [10]. Furthermore, they thought that age at onset influenced neurodegenerative processes underlying PD with LID [9]. However, dyskinetic group enrolled in their studies was limited to PD patients with peak-dose dyskinesia. As LID includes three categories, their results cannot be suitable for all LID. There are major discrepancies between peak-dose dyskinesia and diphasic dyskinesia. On the one hand, the pattern of peak-dose dyskinesia is the “improvement - dystonia - improvement” and it occurs around the time of peak plasma levels of medication [11]. The pattern of diphasic dyskinesia is the “dystonia - improvement - dystonia” and it occurs when the effects of levodopa are wearing on and off [12]. On the other hand, the performance of peak-dose dyskinesia is usually choreoathetoid, but can also be ballistic or dystonic [4]. Diphasic dyskinesia occurs more often in the lower limbs than the upper limbs, and it often consists of repetitive alternating movements in a stereotyped manner [6, 13]. Abnormal dopaminergic modulation of the cortico-basal ganglia motor loops is widely acknowledged to result in the emergence of LID [14]. Based on completely different clinical features between peak-dose dyskinesia and diphasic dyskinesia, we hypothesized that there were characteristic features in the structure of the cortico-basal ganglia motor loops, especially where associated with somato-motor function, which might be different from peak-dose dyskinesia.
In this study, we were the first to conducted a cross-sectional study to investigate alterations in the GM volume and the cortical thickness of the brain in PD patients with diphasic dyskinesia. Moreover, we conducted this study in early-onset PD patients (less than 50 ages) and late-onset PD patients (more than 50 ages) separately in order to take age at onset into consideration.
Results
Demographic and neuropsychological characteristics
Demographic and neuropsychological characteristics of all participants were shown in Table 1. There were no significant differences in gender, age, education, MMSE scores and HAMD scores among groups. Moreover, no significant differences in disease duration, H&Y stage, LEDD and UPDRS-β scores were detected between PD patients with diphasic dyskinesia and PD patients without dyskinesia.
Table 1. Demographic data of participant.
| Items | EO PD with diphasic dyskinetic (n=17) | EO PD patients without dyskinesia (n=16) | HC (n=12) | p | |||||||||||||||||||||||||||||||||||||||||||||||||||||||||||||||||||||||||||||||||||||||||||||||
| Gender (male/female) | 9/8 | 10/6 | 9/3 | 0.48a | |||||||||||||||||||||||||||||||||||||||||||||||||||||||||||||||||||||||||||||||||||||||||||||||
| Age (years) | 51.18±9.54 | 51.75±4.67 | 56.75±2.30 | 0.07b | |||||||||||||||||||||||||||||||||||||||||||||||||||||||||||||||||||||||||||||||||||||||||||||||
| Education (years) | 10.71±3.51 | 10.81±2.90 | 12.58±3.61 | 0.28b | |||||||||||||||||||||||||||||||||||||||||||||||||||||||||||||||||||||||||||||||||||||||||||||||
| Disease duration (years) | 10.41±5.15 | 8.37±4.02 | NA | 0.22c | |||||||||||||||||||||||||||||||||||||||||||||||||||||||||||||||||||||||||||||||||||||||||||||||
| Age at onset (years) | 40.76±9.05 | 43.38±6.249 | NA | 0.35c | |||||||||||||||||||||||||||||||||||||||||||||||||||||||||||||||||||||||||||||||||||||||||||||||
| H&Y stage | 2.53±0.41 | 2.50±0.37 | NA | 0.83c | |||||||||||||||||||||||||||||||||||||||||||||||||||||||||||||||||||||||||||||||||||||||||||||||
| LEDD (mg/day) | 650.00±201.75 | 693.13±209.78 | NA | 0.55c | |||||||||||||||||||||||||||||||||||||||||||||||||||||||||||||||||||||||||||||||||||||||||||||||
| UPDRS-III | 37.88±8.87 | 35.94±11.53 | NA | 0.59c | |||||||||||||||||||||||||||||||||||||||||||||||||||||||||||||||||||||||||||||||||||||||||||||||
| MMSE | 28.94±0.90 | 28.63±1.50 | 28.75±1.22 | 0.76b | |||||||||||||||||||||||||||||||||||||||||||||||||||||||||||||||||||||||||||||||||||||||||||||||
| HAMD | 4.24±2.73 | 5.13±3.20 | 4.42±2.64 | 0.66b | |||||||||||||||||||||||||||||||||||||||||||||||||||||||||||||||||||||||||||||||||||||||||||||||
| UDysRS | 54.65±19.67 | NA | NA | NA | |||||||||||||||||||||||||||||||||||||||||||||||||||||||||||||||||||||||||||||||||||||||||||||||
| Items | LO PD with diphasic dyskinetic (n=31) | LO PD patients without dyskinesia (n=44) | HC (n=36) | p | |||||||||||||||||||||||||||||||||||||||||||||||||||||||||||||||||||||||||||||||||||||||||||||||
| Gender (male/female) | 16/15 | 24/20 | 23/13 | 0.56a | |||||||||||||||||||||||||||||||||||||||||||||||||||||||||||||||||||||||||||||||||||||||||||||||
| Age (years) | 66.65±7.01 | 66.20±6.05 | 65.61±3.80 | 0.76b | |||||||||||||||||||||||||||||||||||||||||||||||||||||||||||||||||||||||||||||||||||||||||||||||
| Education (years) | 10.42±4.22 | 11.02±3.55 | 11.19±3.29 | 0.67b | |||||||||||||||||||||||||||||||||||||||||||||||||||||||||||||||||||||||||||||||||||||||||||||||
| Disease duration (years) | 8.45±2.89 | 8.43±2.31 | NA | 0.97c | |||||||||||||||||||||||||||||||||||||||||||||||||||||||||||||||||||||||||||||||||||||||||||||||
| Age at onset (years) | 58.19±6.77 | 57.77±6.16 | NA | 0.78c | |||||||||||||||||||||||||||||||||||||||||||||||||||||||||||||||||||||||||||||||||||||||||||||||
| H&Y stage | 2.58±0.53 | 2.50±0.61 | NA | 0.56c | |||||||||||||||||||||||||||||||||||||||||||||||||||||||||||||||||||||||||||||||||||||||||||||||
| LEDD (mg/day) | 745.08±272.62 | 659.49±191.82 | NA | 0.11c | |||||||||||||||||||||||||||||||||||||||||||||||||||||||||||||||||||||||||||||||||||||||||||||||
| UPDRS-III | 36.55±8.921 | 35.93±10.08 | NA | 0.79c | |||||||||||||||||||||||||||||||||||||||||||||||||||||||||||||||||||||||||||||||||||||||||||||||
| MMSE | 28.16±1.42 | 28.30±1.76 | 28.69±1.43 | 0.34b | |||||||||||||||||||||||||||||||||||||||||||||||||||||||||||||||||||||||||||||||||||||||||||||||
| HAMD | 4.61±2.83 | 4.75±3.85 | 4.08±2.76 | 0.64b | |||||||||||||||||||||||||||||||||||||||||||||||||||||||||||||||||||||||||||||||||||||||||||||||
| UDysRS | 40.71±20.21 | NA | NA | NA | |||||||||||||||||||||||||||||||||||||||||||||||||||||||||||||||||||||||||||||||||||||||||||||||
| Abbreviations: EO, Early-Onset; LO, Late-Onset; PD, Parkinson’s disease; HC, Healthy control; H&Y stage, Hoehn and Yahr stage; LEDD, levodopa-equivalent daily dose; UPDRS, Unified Parkinson’s disease rating scale; MMSE, Mini-Mental State Examination; HAMD, Hamilton Depression Scale; UDysRS, Unified Dyskinesia Rating Scale. | |||||||||||||||||||||||||||||||||||||||||||||||||||||||||||||||||||||||||||||||||||||||||||||||||||
| Values except gender were expressed as mean±S.D. | |||||||||||||||||||||||||||||||||||||||||||||||||||||||||||||||||||||||||||||||||||||||||||||||||||
| aChi-square tests. | |||||||||||||||||||||||||||||||||||||||||||||||||||||||||||||||||||||||||||||||||||||||||||||||||||
| bTwo-way analysis of variance (ANOVA). | |||||||||||||||||||||||||||||||||||||||||||||||||||||||||||||||||||||||||||||||||||||||||||||||||||
| cindependent-sample t tests | |||||||||||||||||||||||||||||||||||||||||||||||||||||||||||||||||||||||||||||||||||||||||||||||||||
| *p<0.05 | |||||||||||||||||||||||||||||||||||||||||||||||||||||||||||||||||||||||||||||||||||||||||||||||||||
VBM findings
Compared with early-onset PD patients without dyskinesia, early-onset PD patients with diphasic dyskinesia showed higher GM volumes in right precentral gyrus (MNI local maxima: x = 33, y = −9, z = 54, F = 4.66, Cluster size: 162 mm3, PFWE-corr < 0.02) (Figure 1). Moreover, early-onset PD patients with diphasic dyskinesia showed higher GM volumes in right precentral gyrus (MNI local maxima: x = 33, y = −6, z = 54, F = 5.16, Cluster size: 891 mm3, PFWE-corr < 0.01) (Figure 2) than healthy controls (HCs). There was no significant GM difference between early-onset PD patients without dyskinesia and HCs at a threshold of FWE-corrected P < 0.05.
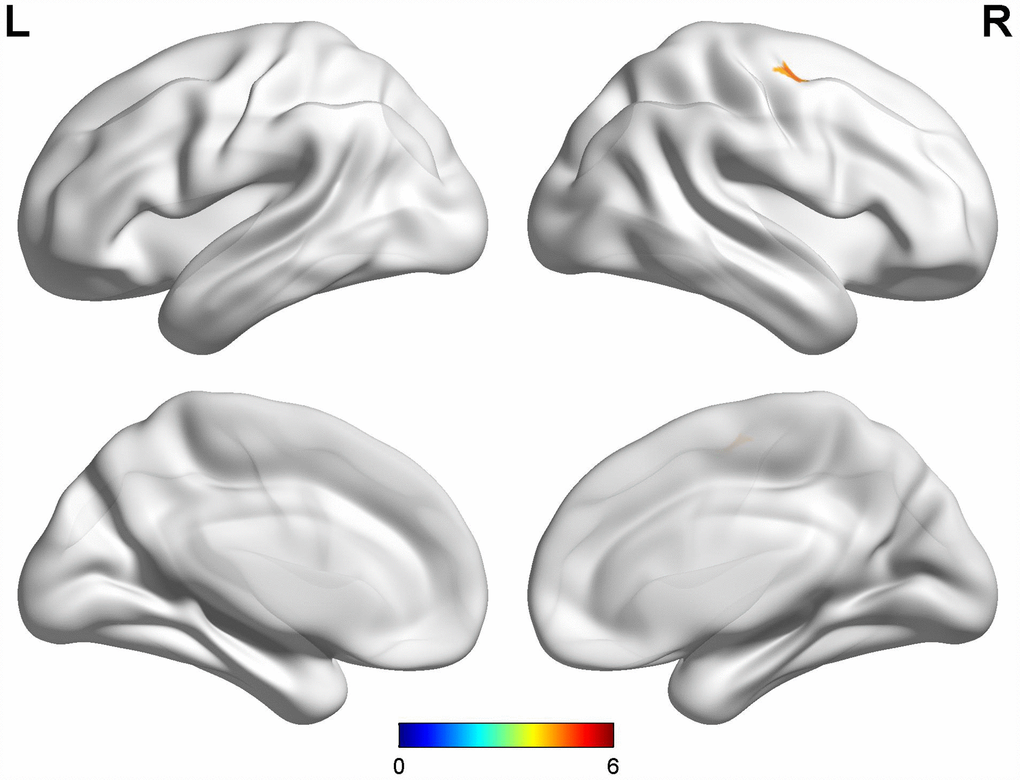
Figure 1. Comparison between early-onset PD patients with diphasic dyskinesia and early-onset PD patients without dyskinesia. Compared with early-onset PD patients without dyskinesia, early-onset PD patients with diphasic dyskinesia showed higher GM volumes in right precentral gyrus (Cluster size: 162 mm3). Correction for multiple comparisons (family-wise error rate (FWE), P < 0.05) was used to threshold the analysis. Abbreviations: PD, Parkinson’s disease; GM, gray matter.
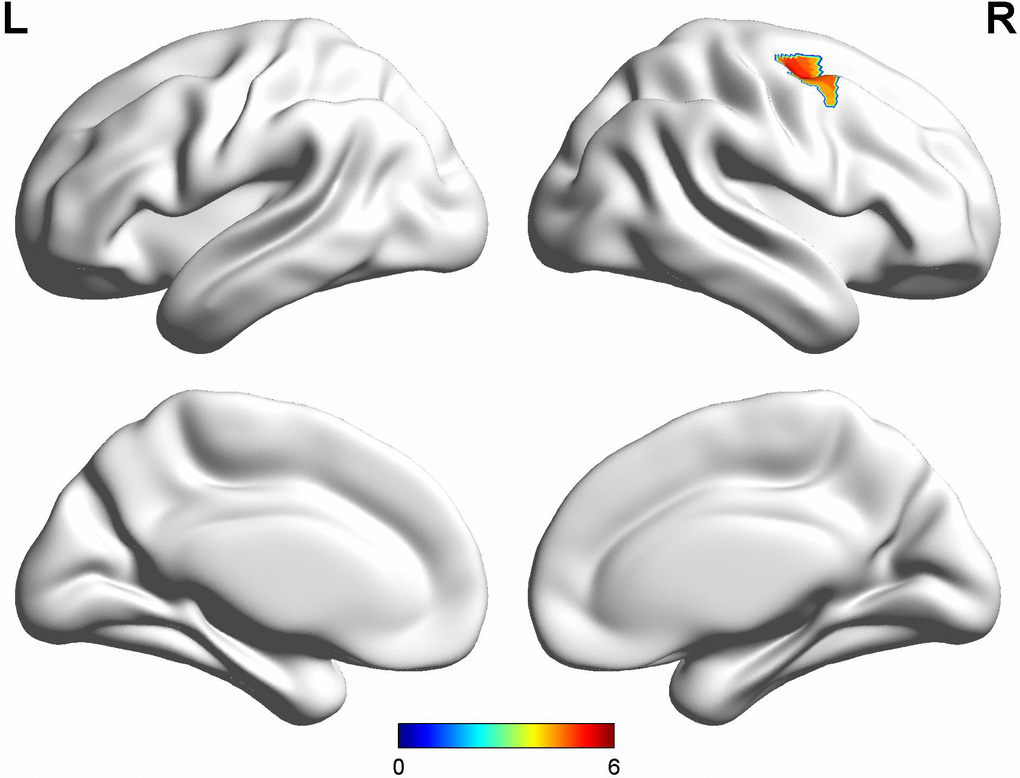
Figure 2. Comparison between early-onset PD patients with diphasic dyskinesia and HCs. Compared with HCs, early-onset PD patients with diphasic dyskinesia showed higher GM volumes in right precentral gyrus (Cluster size: 891 mm3). Correction for multiple comparisons (family-wise error rate (FWE), P < 0.05) was used to threshold the analysis. Abbreviations: PD, Parkinson’s disease; HC, Healthy control; GM, gray matter.
Compared with late-onset PD patients without dyskinesia, late-onset PD patients with diphasic dyskinesia showed higher GM volumes in left precentral gyrus (MNI local maxima: x = -39, y = -12, z = 54, F = 4.91, Cluster size: 189 mm3, PFWE-corr < 0.01) (Figure 3). There was no significant GM difference between HCs and late-onset PD patients with diphasic dyskinesia or late-onset PD patients without dyskinesia at a threshold of FWE-corrected P < 0.05.
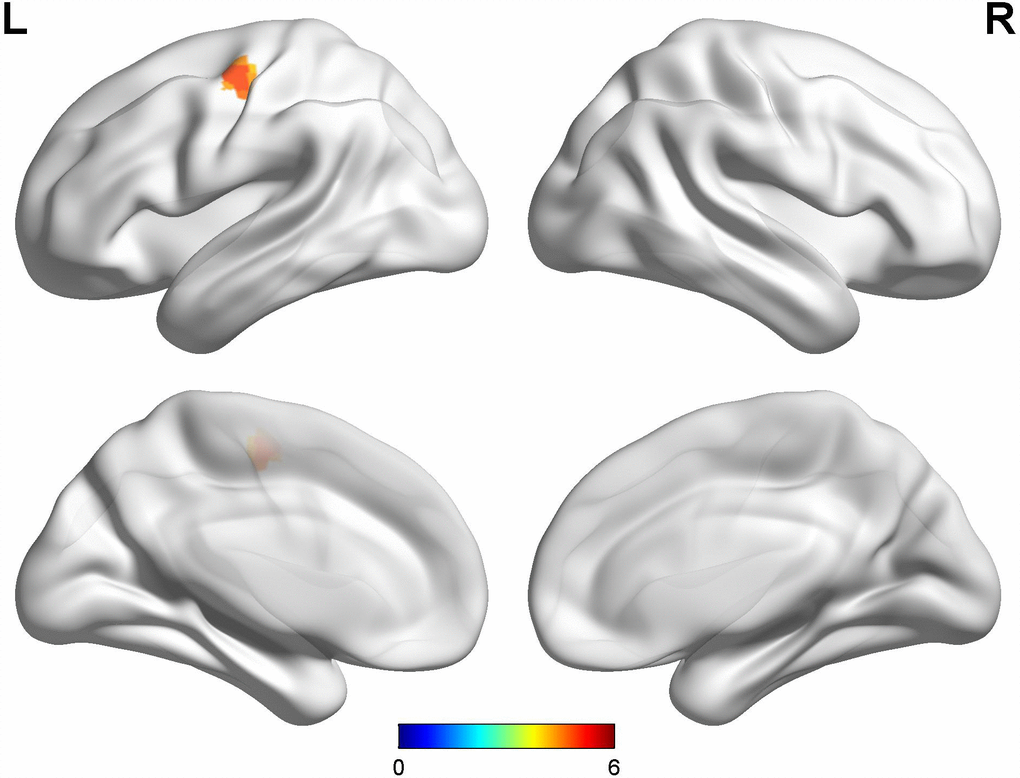
Figure 3. Comparison between late-onset PD patients with diphasic dyskinesia and late-onset PD patients without dyskinesia. Compared with late-onset PD patients without dyskinesia, late-onset PD patients with diphasic dyskinesia showed higher GM volumes in left precentral gyrus (Cluster size: 189 mm3). Correction for multiple comparisons (family-wise error rate (FWE), P < 0.05) was used to threshold the analysis. Abbreviations: PD, Parkinson’s disease; GM, gray matter.
Cortical thickness findings
The data of cortical thickness was provided in Supplementary Table 1. There was no significant difference in cortical thickness among groups at a threshold of Bonferroni-corrected P < 0.05.
Correlation analysis
The mean GM volumes of the cluster which showed differences between early-onset PD patients with diphasic dyskinesia and early-onset PD patients without dyskinesia in right precentral gyrus was positively correlated with UDysRS scores in early-onset PD patients with diphasic dyskinesia (r = 0.75, P < 0.01) (Figure 4). Moreover, the mean GM volumes of the cluster which showed differences between late-onset PD patients with diphasic dyskinesia and late-onset PD patients without dyskinesia in left precentral gyrus was positively correlated with UDysRS scores in late-onset PD patients with diphasic dyskinesia (r = 0.52, P < 0.01) (Figure 5).
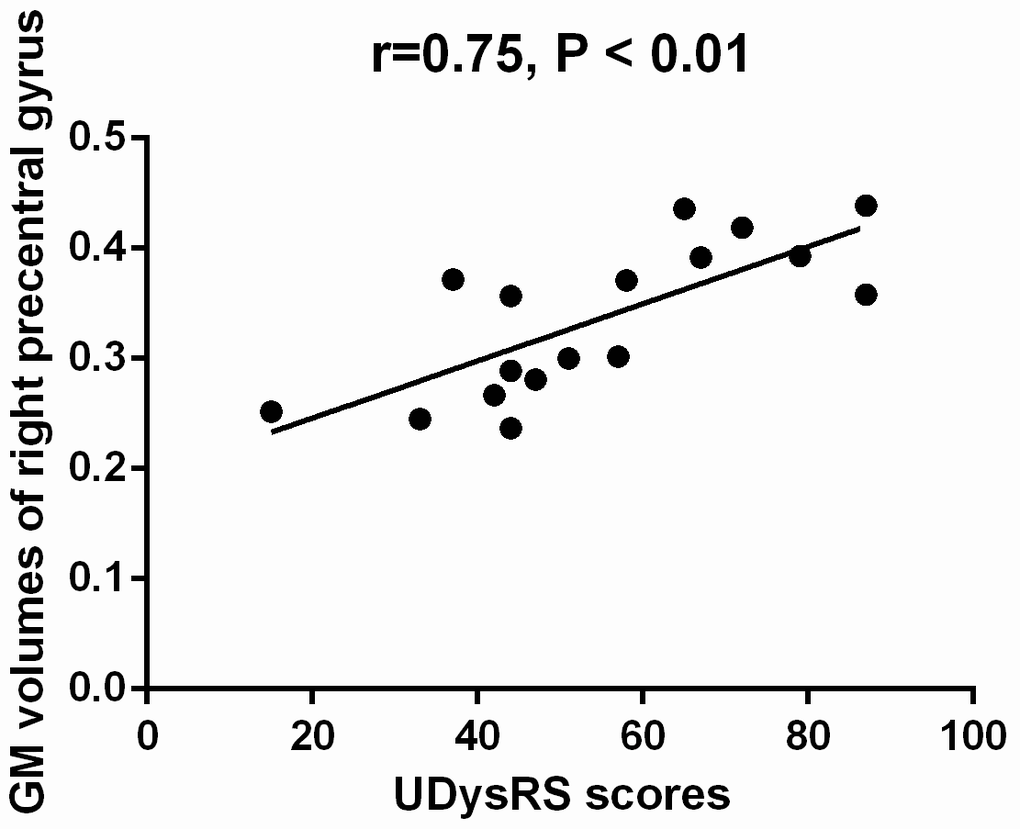
Figure 4. Correlation between the mean GM volumes of the cluster showing difference and UDysRS scores in early-onset PD patients with diphasic dyskinesia. The mean GM volumes of right precentral gyrus was positively correlated with UDysRS scores (r=0.75, P < 0.01).
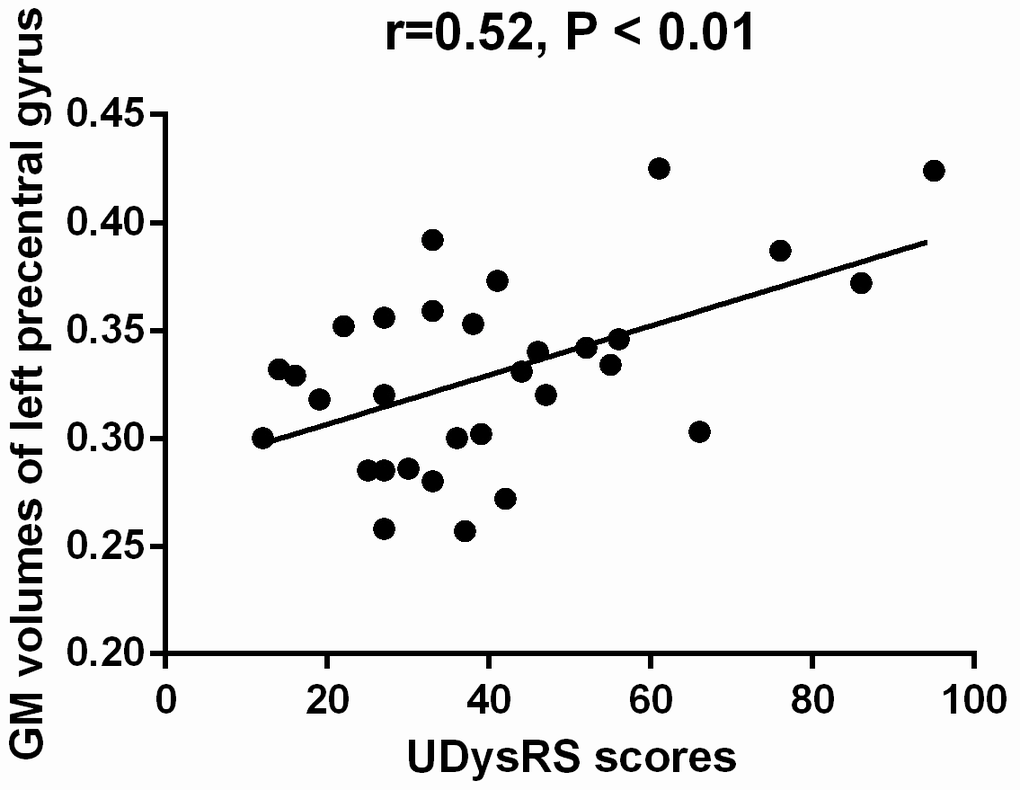
Figure 5. Correlation between the mean GM volumes of the cluster showing difference and UDysRS scores in late-onset PD patients with diphasic dyskinesia. The mean GM volumes of left precentral gyrus was positively correlated with UDysRS scores (r=0.52, P < 0.01).
Discussion
Our analysis showed that the GM volumes in right precentral gyrus were higher in early-onset PD patients with diphasic dyskinesia when compared with early-onset PD patients without dyskinesia. The GM volumes in left precentral gyrus were higher in late-onset PD patients with diphasic dyskinesia when compared with late-onset PD patients without dyskinesia. The difference might be attributed to unilateral limb onset in PD and the sample size. What’s more mean GM volumes of clusters in precentral gyri which showed differences were positively correlated with UDysRS scores, indicating that the increased GM volumes of precentral gyri might be associated with the severity and the pathogenesis of diphasic dyskinesia. However, there was no significant difference in cortical thickness among groups. The main cause might be that the increased GM volumes were the portion of precentral gyri and the cluster size was small. The cortical thickness related data got from FreeSurfer were mean cortical thickness of each brain region. The mean cortical thickness of the whole precentral gyri showed no difference among groups, indicating changes of precentral gyri were partial. Previous studies about peak-dose dyskinesia reported that GM volumes and thickness in the inferior frontal gyrus was higher in dyskinetic group when compared with nondyskinetic group [8–10]. We found that alterations in the structure of the brain in diphasic dyskinesia were different from peak-dose dyskinesia, which supported the hypothesis that alterations in the GM volume of the cortico-basal ganglia motor loops might have characteristic features which is different from peak-dose dyskinesia, indicating that peak-dose dyskinesia and diphasic dyskinesia had different pathogenesis.
Although, the pathogenesis of LID is not well understood, it is widely acknowledged that abnormal dopaminergic modulation of the cortico-basal ganglia motor loops results in the emergence of LID [14]. Loss of nigral dopaminergic neurons is the feature of PD. Progressive degeneration of presynaptic nigral neurons leads to the large dopamine fluctuation in the brain [15]. It leads to abnormalities in the connectivity between the motor cortex and the striatum and establishes a functional disturbance in basal ganglia, which is associated with the generation of involuntary abnormal movements [5]. The role of dopamine in the striatum is to alter the response of medium spiny neurons (MSNs) in both the direct and indirect pathways to excitatory input from the corticostriatal pathway [16]. In the dyskinetic state, uncontrolled and excessive dopaminergic stimulation over the direct pathway (striatonigral) MSNs increases thalamocortical feedback [16, 17], which leads to thalamo-cortical pathway disinhibition and frontal motor area overactivation [18]. Then, the overactive frontal motor area produces exaggerated motor function. The precentral gyrus is the site of the primary motor cortex (Brodmann area 4). The different body parts in the primary motor cortex has a precise somatotopic representation. The clusters which showed increased GM volumes of precentral gyri in our study were mainly located in the upper of precentral gyrus. Hence, the increased GM volumes of precentral gyri might be associated with repetitive alternating movements in the lower limbs in PD patients with diphasic dyskinesia.
However, we couldn’t judge whether the increased GM volumes of precentral gyri were the consequence or the cause of diphasic dyskinesia. Previous studies have proved that impaired brain plasticity results in the development of dyskinesias during the long-term dopaminergic therapy in PD [19]. PD patients with LIDs show absent or poor plastic responses in the primary motor cortex, which cannot be compensated by chronic dopaminergic replacement therapy [19–21]. The normal bidirectional plasticity in both direct and indirect pathways was replaced by unidirectional plasticity (Long-Term Potentiation-like in the direct pathway and Long-Term Depression-like in the indirect pathway) in the rodent PD model with dyskinesia in the presence of levodopa [22]. We speculate that the GM volumes of increased precentral gyri might be the consequence of impaired brain plasticity during the long-term dopaminergic therapy. Another hypothesis is that the increased GM volumes of precentral gyri were normal variation from birth, and PD patients with increased GM volumes of precentral gyri were easier to appear impaired brain plasticity and develop diphasic dyskinesia. It’s hard to judge which hypothesis is right based on the current study, so further studies are necessary to be carried on to confirm related mechanisms.
It is worth noting that the development of diphasic dyskinesia could be influenced by several clinical variables including levodopa dose, age, gender, duration of disease, clinical subtype, disease progression and disease severity [4]. Therefore, we chose closely matched diphasic dyskinetic group and nondyskinetic group to minimize the possible influence of these clinical variables on cerebral structure. Moreover, gender, age and education were entered as covariate of no interest in our analysis to ensure the reliability of our study. Further correlation analysis showed that the increased GM volumes in precentral gyri were only associated with UDysRS scores, but not associated with disease duration, H&Y stage, LEDD and UPDRS-III scores, indicating that the increased GM volumes in precentral gyri were specific in PD patients with diphasic dyskinesia.
We must take several limitations in the present study into consideration. Firstly, this study was confined to investigate alterations in the GM volume and the cortical thickness of the brain, and the mechanism of diphasic dyskinesia should be further explored by other methods such as functional magnetic resonance imaging (fMRI) and diffusion tensor imaging (DTI). Secondly, we used a highly stringent statistical threshold (FWE < 0.05), so our study might be underpowered to detect some minor alterations in the GM volume of the brain in PD patients with diphasic dyskinesia. Thirdly, this is a cross-sectional investigation, and a prospective study would be better to observe dynamically cerebral change in the structure. Fourthly, the sample size of participants was relatively small. Therefore, results of our study need to be reproduced and validated in the further.
In conclusion, we present firstly the cerebral structural abnormalities in PD patients with diphasic dyskinesia. The GM volumes of precentral gyri were increased in PD patients with diphasic dyskinesia, which might be associated with the pathogenesis and the severity of diphasic dyskinesia. The structural characteristics of diphasic dyskinesia is different from peak-dose dyskinesia. The GM volumes of precentral gyri would be considered as biomarkers for diphasic dyskinesia in PD.
Materials and Methods
Study participants
From June 2015 and September 2018, 114 well-characterized idiopathic PD patients who had received levodopa treatment more than six months were consecutively recruited from the First Affiliated Hospital of Nanjing Medical University according to the UK Parkinson’s Disease Society Brain Bank Research criteria [23]. Exclusion criteria were: (1) other forms of parkinsonism such as atypical parkinsonism and secondary parkinsonism, (2) a family history of PD, (3) structural abnormalities in the brain which might affect the gray matter, (4) head movement artifacts during the MRI Session, (5) severe cognitive impairment (mini-mental state exam (MMSE) score < 24) [24] or depression (Hamilton Depression Scale (HAMD) score > 17) [25]. As a result, six PD patients were excluded from our study (three PD patients because of head movement artifacts during the MRI Session, two patients because of severe cognitive impairment, one PD patient because of depression). The presence or absence of diphasic dyskinesia was judged by two experienced neurologists, Kezhong Zhang and Yongsheng Yuan, depending on involuntary movements appearance in the time window after an acute levodopa test on the occasion of the last visit at least one week before MRI examination, along with relevant clinical symptoms previously. Among 108 PD patients, 48 patients suffered from diphasic dyskinesia, and 60 patients were nondyskinetic. According to previous published criteria, each PD group was further divided into early-onset group (age < 50) and late-onset group (age > 50) [26]. Thus, PD patients were divided into four groups: early-onset PD with diphasic dyskinesia (n=17); late-onset PD with diphasic dyskinesia (n=31); early-onset PD without dyskinesia a (n=17) and late-onset PD without dyskinesia (n=43). Moreover, 48 healthy individuals without neurological diseases, a family history of PD or cognitive impairment were enrolled as controls. All HCs were matched for age, sex, and education with PD patients well. All participants gave us written informed consent before participating in the experiment and the study was approved by the ethics committee of the First Affiliated Hospital of Nanjing Medical University.
Clinical assessment
We used the Hoehn and Yahr (H&Y) staging and the third part of the Unified Parkinson’s Disease Rating Scale (UPDRSIII) [27] to evaluate the motor severity of PD patients. Moreover, the Unified Dyskinesia Rating Scale (UDysRS) [28] was used to evaluated the severity of diphasic dyskinesia in diphasic dyskinetic PD group. The UDysRS is a comprehensive rating tool of dyskinesia in Parkinson’s disease [28]. It has been proved to have acceptable internal consistency, inter- and intrarater reliability, and temporal stability [28, 29]. Furthermore, the presence of depression was detected using the Hamilton Depression Scale (HAMD) [26]. Cognitive functioning of all participants were evaluated by the mini–mental state examination (MMSE) [25]. We calculated levodopa equivalent daily dose (LEDD) according to established methods [30].
Image acquisition
All participants were fasting in the morning and to PD patients at least 12 hours withdrawal of levodopa treatment. Experienced doctors from the radiology department using a 3.0 Tesla Siemens MAGNETOM Verio whole-body MRI system (Siemens Medical Solutions, Germany) which was equipped with eight-channel and phase-array head coils to scan all participants. Ear-plugs were used because of the big noise made by the scanner. Moreover, tight foam padding was used to minimize head motion. Three-dimensional T1-weighted anatomical images were obtained using a volumetric 3D magnetization-prepared rapid gradient-echo (MP-RAGE) sequence (repetition time (TR) = 1900 ms, echo time (TE) = 2.95 ms, flip angle (FA) = 9°, slice thickness = 1 mm, slices = 160, field of view (FOV) = 230×230 mm2, matrix size = 256×256 and voxel size = 1×1×1 mm3).
Voxel-based morphometry (VBM)
Structural data analysis and atrophy measurements were performed with optimized VBM [31]. Statistical Parametric Mapping (SPM8, http://www.fil.ion.ucl.ac.uk) software was used to process and examine MRI data preprocessing. Three PD patients with head motions exceeded 2.5 mm or 2.5° of translation or rotation in any direction throughout the course of the scan were excluded in our study VBM standard routines and default parameters implemented were applied in the VBM8 toolbox (http://www.neuro.uni-jena.de/vbm/). The DARTEL toolbox was incorporated with the VBM8 toolbox to obtain a high-dimensional normalization protocol. Firstly, images were bias-corrected, tissue-classified, and registered by a generative model of VBM preprocessing which was provided by unified segmentation. Secondly, the segmented GM images were normalized by the Montreal Neurological Institute (MNI) brain. After that, GM images were modulated by the Jacobian determinants derived from the spatial normalization. Finally, the modulated volumes were smoothed with a Gaussian kernel of 8 mm full width at half maximum.
Two doctors who had no knowledge of the participants statistically analyzed the GM volume maps using the general linear model based on Gaussian random field theory. The smoothed GM images were entered into a second-level analysis of covariance (ANCOVA) model to evaluate the main effect of group. In order to rule out the possibility that GM differences caused by specific factors, gender, age, education and total intracranial volume were entered as covariate of no interest in the ANCOVA analysis. Distinct ANCOVA analyses were performed for early- and late-onset PD groups. Linear contrasts were used to test for differences in GM volumes between the groups. Correction for multiple comparisons (family-wise error rate (FWE), P < 0.05) was used to threshold all analyses.
Cortical thickness
Cortical thickness analysis was performed with the FreeSurfer software (http://surfer.nmr.mgh.harvard. edu/, version 6.0) using “recon-all” processing stream [32] which included: (1) motion correction and averaging of volumetric T1 weighted images, (2) removal of non-brain tissue including stripping of the skull, (3) automated Talairach transformation, (4) segmentation of the subcortical white matter and deep gray matter volumetric structures, (5) intensity normalization, (6) tessellation of the gray/white matter boundary, (7) automated topology correction, (8) surface deformation [33–35]. Two doctors who had no knowledge of the participants performed initial visual inspection of segmentations and minor manual corrections of regional segmentation. Then we extracted cortical thickness from all available cortical structures in both hemispheres. Comparison of cortical thickness from all available cortical structures was evaluated using ANOVA among groups. Gender, age and education were entered as covariate of no interest in the ANCOVA analysis. Distinct ANCOVA analyses were performed for early- and late-onset PD groups. Linear contrasts were used to test for differences in cortical thickness between the groups. Correction for multiple comparisons (Bonferroni, P < 0.05) was used to threshold analyses.
Statistical analysis
SPSS 20.0 statistical analysis software (SPSS Inc. Chicago, IL, USA) was used to perform the analysis of demographic and neuropsychological data. Continuous variables and categorical variables were shown as mean±S.D and a percentage respectively. Chi-square test was used to compare gender among groups. Comparisons of age, education, MMSE scores and HAMD scores were evaluated using two-way analysis of variance (ANOVA). Moreover, independent-sample t tests were employed for the comparison of disease duration, H&Y stage, LEDD and UPDRS-Ⅲ scores between PD patients with diphasic dyskinesia and PD patients without dyskinesia. Furthermore, we extracted the mean GM volumes of clusters show differences between PD patients with diphasic dyskinesia and PD patients without dyskinesia. A imaging analysis program developed described in Yuan et al. [36] was used to perform mean GM volume measurements. Pearson correlation was employed to calculate correlations between mean GM volumes of clusters and UDysRS scores in PD patients with diphasic dyskinesia. Correlations between cortical thickness from cortical structures which showed difference and UDysRS scores in PD patients with diphasic dyskinesia were calculated by Pearson correlation, as also. Two tailed levels of significance (P < 0.05) was used.
Supplementary Materials
Author Contributions
Yan Zhi: study concept or design, acquisition of clinical data, writing of the first draft, revising the manuscript for content and data analysis. Yu-Ting Shen: study concept or design, acquisition of clinical data, revising the manuscript for content. Yong-Sheng Yuan: study concept or design, acquisition of clinical data, revising the manuscript for content. Ke-Wei Ma: acquisition of clinical data, revising the manuscript for content. Min Wang: collecting image data. Hui Zhang: acquisition of clinical data, revising the manuscript for content. Qian-Qian Si: data analysis. Li-Na Wang: data analysis. Ke-Zhong Zhang: study concept or design, revising the manuscript for content, study supervision, obtaining funding. All authors approved the final version of the manuscript.
Acknowledgments
The authors are grateful to all the subjects who participated in this study, and all members of the neurology and radiology staff at The First Affiliated Hospital of Nanjing Medical University.
Conflicts of Interest
All authors report no conflicts of interest.
Funding
This work was supported by the National Natural Science Foundation of China [No.81671258, 81901297], the Science and Technology Project of Jiangsu Provincial Commission of Health and Family Planning [No.H201602], the Natural science foundation of Jiangsu Province [No.BK20141494], the Jiangsu Provincial Personnel Department “the Great of Six Talented Man Peak” Project [No.2014-WSN-013], the Project Funded by the Priority Academic Program Development of Jiangsu Higher Education Institutions (PAPD), and the Science and Technology Project of Jiangsu Bureau of Traditional Chinese Medicine [No.YB2015163].
References
- 1. Matarazzo M, Perez-Soriano A, Stoessl AJ. Dyskinesias and levodopa therapy: why wait? J Neural Transm (Vienna). 2018; 125:1119–30. https://doi.org/10.1007/s00702-018-1856-6 [PubMed]
- 2. Jankovic J. Complications and limitations of drug therapy for Parkinson’s disease. Neurology. 2000 (Suppl 6); 55:S2–6. [PubMed]
- 3. Péchevis M, Clarke CE, Vieregge P, Khoshnood B, Deschaseaux-Voinet C, Berdeaux G, Ziegler M, and Trial Study Group. Effects of dyskinesias in Parkinson’s disease on quality of life and health-related costs: a prospective European study. Eur J Neurol. 2005; 12:956–63. https://doi.org/10.1111/j.1468-1331.2005.01096.x [PubMed]
- 4. Tran TN, Vo TN, Frei K, Truong DD. Levodopa-induced dyskinesia: clinical features, incidence, and risk factors. J Neural Transm (Vienna). 2018; 125:1109–17. https://doi.org/10.1007/s00702-018-1900-6 [PubMed]
- 5. Pandey S, Srivanitchapoom P. Levodopa-induced Dyskinesia: Clinical Features, Pathophysiology, and Medical Management. Ann Indian Acad Neurol. 2017; 20:190–98. [PubMed]
- 6. Alegre M, López-Azcárate J, Alonso-Frech F, Rodríguez-Oroz MC, Valencia M, Guridi J, Artieda J, Obeso JA. Subthalamic activity during diphasic dyskinesias in Parkinson’s disease. Mov Disord. 2012; 27:1178–81. https://doi.org/10.1002/mds.25090 [PubMed]
- 7. Vijayakumar D, Jankovic J. Drug-Induced Dyskinesia, Part 1: Treatment of Levodopa-Induced Dyskinesia. Drugs. 2016; 76:759–77. https://doi.org/10.1007/s40265-016-0566-3 [PubMed]
- 8. Cerasa A, Messina D, Pugliese P, Morelli M, Lanza P, Salsone M, Novellino F, Nicoletti G, Arabia G, Quattrone A. Increased prefrontal volume in PD with levodopa-induced dyskinesias: a voxel-based morphometry study. Mov Disord. 2011; 26:807–12. https://doi.org/10.1002/mds.23660 [PubMed]
- 9. Cerasa A, Salsone M, Morelli M, Pugliese P, Arabia G, Gioia CM, Novellino F, Quattrone A. Age at onset influences neurodegenerative processes underlying PD with levodopa-induced dyskinesias. Parkinsonism Relat Disord. 2013; 19:883–88. https://doi.org/10.1016/j.parkreldis.2013.05.015 [PubMed]
- 10. Cerasa A, Morelli M, Augimeri A, Salsone M, Novellino F, Gioia MC, Arabia G, Quattrone A. Prefrontal thickening in PD with levodopa-induced dyskinesias: new evidence from cortical thickness measurement. Parkinsonism Relat Disord. 2013; 19:123–25. https://doi.org/10.1016/j.parkreldis.2012.06.003 [PubMed]
- 11. Muenter MD, Tyce GM. L-dopa therapy of Parkinson’s disease: plasma L-dopa concentration, therapeutic response, and side effects. Mayo Clin Proc. 1971; 46:231–39. [PubMed]
- 12. Muenter MD, Sharpless NS, Tyce GM, Darley FL. Patterns of dystonia (“I-D-I” and "D-I-D-") in response to l-dopa therapy for Parkinson’s disease. Mayo Clin Proc. 1977; 52:163–74. [PubMed]
- 13. Obeso JA, Grandas F, Vaamonde J, Luquin MR, Artieda J, Lera G, Rodriguez ME, Martinez-Lage JM. Motor complications associated with chronic levodopa therapy in Parkinson’s disease. Neurology. 1989 (Suppl 2); 39:11–19. [PubMed]
- 14. Herz DM, Haagensen BN, Christensen MS, Madsen KH, Rowe JB, Løkkegaard A, Siebner HR. Abnormal dopaminergic modulation of striato-cortical networks underlies levodopa-induced dyskinesias in humans. Brain. 2015; 138:1658–66. https://doi.org/10.1093/brain/awv096 [PubMed]
- 15. Metman LV, Konitsiotis S, Chase TN. Pathophysiology of motor response complications in Parkinson’s disease: hypotheses on the why, where, and what. Mov Disord. 2000; 15:3–8. https://doi.org/10.1002/1531-8257(200001)15:1<3::AID-MDS1003>3.0.CO;2-E [PubMed]
- 16. Finlay CJ, Duty S, Vernon AC. Brain morphometry and the neurobiology of levodopa-induced dyskinesias: current knowledge and future potential for translational pre-clinical neuroimaging studies. Front Neurol. 2014; 5:95. https://doi.org/10.3389/fneur.2014.00095 [PubMed]
- 17. Picconi B, Hernández LF, Obeso JA, Calabresi P. Motor complications in Parkinson’s disease: striatal molecular and electrophysiological mechanisms of dyskinesias. Mov Disord. 2018; 33:867–76. https://doi.org/10.1002/mds.27261 [PubMed]
- 18. Ponzo V, Picazio S, Benussi A, Di Lorenzo F, Brusa L, Caltagirone C, Koch G. Altered inhibitory interaction among inferior frontal and motor cortex in l-dopa-induced dyskinesias. Mov Disord. 2016; 31:755–59. https://doi.org/10.1002/mds.26520 [PubMed]
- 19. Rajan R, Popa T, Quartarone A, Ghilardi MF, Kishore A. Cortical plasticity and levodopa-induced dyskinesias in Parkinson’s disease: connecting the dots in a multicomponent network. Clin Neurophysiol. 2017; 128:992–99. https://doi.org/10.1016/j.clinph.2017.03.043 [PubMed]
- 20. Ueki Y, Mima T, Kotb MA, Sawada H, Saiki H, Ikeda A, Begum T, Reza F, Nagamine T, Fukuyama H. Altered plasticity of the human motor cortex in Parkinson’s disease. Ann Neurol. 2006; 59:60–71. https://doi.org/10.1002/ana.20692 [PubMed]
- 21. Suppa A, Marsili L, Belvisi D, Conte A, Iezzi E, Modugno N, Fabbrini G, Berardelli A. Lack of LTP-like plasticity in primary motor cortex in Parkinson’s disease. Exp Neurol. 2011; 227:296–301. https://doi.org/10.1016/j.expneurol.2010.11.020 [PubMed]
- 22. Thiele SL, Chen B, Lo C, Gertler TS, Warre R, Surmeier JD, Brotchie JM, Nash JE. Selective loss of bi-directional synaptic plasticity in the direct and indirect striatal output pathways accompanies generation of parkinsonism and l-DOPA induced dyskinesia in mouse models. Neurobiol Dis. 2014; 71:334–44. https://doi.org/10.1016/j.nbd.2014.08.006 [PubMed]
- 23. Hughes AJ, Daniel SE, Kilford L, Lees AJ. Accuracy of clinical diagnosis of idiopathic Parkinson’s disease: a clinico-pathological study of 100 cases. J Neurol Neurosurg Psychiatry. 1992; 55:181–84. https://doi.org/10.1136/jnnp.55.3.181 [PubMed]
- 24. Folstein MF, Folstein SE, McHugh PR. “Mini-mental state”. A practical method for grading the cognitive state of patients for the clinician. J Psychiatr Res. 1975; 12:189–98. https://doi.org/10.1016/0022-3956(75)90026-6 [PubMed]
- 25. Hamilton M. A rating scale for depression. J Neurol Neurosurg Psychiatry. 1960; 23:56–62. https://doi.org/10.1136/jnnp.23.1.56 [PubMed]
- 26. Koch G, Brusa L, Caltagirone C, Peppe A, Oliveri M, Stanzione P, Centonze D. rTMS of supplementary motor area modulates therapy-induced dyskinesias in Parkinson disease. Neurology. 2005; 65:623–25. https://doi.org/10.1212/01.wnl.0000172861.36430.95 [PubMed]
- 27. Fahn S, Elton RL, and UPDRS Development Committee. Unified Parkinson’s disease rating scale. In: Fahn S, Marsden CD, Calne DB, Goldstein M, eds. Recent Developments in Parkinson’s Disease, Vol 2. Florham Park, NJ. Macmillan Health Care Information 1987, 153-163.
- 28. Goetz CG, Nutt JG, Stebbins GT. The Unified Dyskinesia Rating Scale: presentation and clinimetric profile. Mov Disord. 2008; 23:2398–403. https://doi.org/10.1002/mds.22341 [PubMed]
- 29. Goetz CG, Stebbins GT, Theeuwes A, Stocchi F, Ferreira JJ, van de Witte S, Bronzova J. Temporal stability of the Unified Dyskinesia Rating Scale. Mov Disord. 2011; 26:2556–59. https://doi.org/10.1002/mds.23931 [PubMed]
- 30. Tomlinson CL, Stowe R, Patel S, Rick C, Gray R, Clarke CE. Systematic review of levodopa dose equivalency reporting in Parkinson’s disease. Mov Disord. 2010; 25:2649–53. https://doi.org/10.1002/mds.23429 [PubMed]
- 31. Ashburner J, Friston KJ. Unified segmentation. Neuroimage. 2005; 26:839–51. https://doi.org/10.1016/j.neuroimage.2005.02.018 [PubMed]
- 32. Fischl B, Dale AM. Measuring the thickness of the human cerebral cortex from magnetic resonance images. Proc Natl Acad Sci USA. 2000; 97:11050–55. https://doi.org/10.1073/pnas.200033797 [PubMed]
- 33. Dale AM, Fischl B, Sereno MI. Cortical surface-based analysis. I. Segmentation and surface reconstruction. Neuroimage. 1999; 9:179–94. https://doi.org/10.1006/nimg.1998.0395 [PubMed]
- 34. Ségonne F, Pacheco J, Fischl B. Geometrically accurate topology-correction of cortical surfaces using nonseparating loops. IEEE Trans Med Imaging. 2007; 26:518–29. https://doi.org/10.1109/TMI.2006.887364 [PubMed]
- 35. Birner A, Bengesser SA, Seiler S, Dalkner N, Queissner R, Platzer M, Fellendorf FT, Hamm C, Maget A, Pilz R, Lenger M, Reininghaus B, Pirpamer L, et al. Total gray matter volume is reduced in individuals with bipolar disorder currently treated with atypical antipsychotics. J Affect Disord. 2020; 260:722–27. https://doi.org/10.1016/j.jad.2019.09.068 [PubMed]
- 36. Yuan Y, Zhang Z, Bai F, Yu H, You J, Shi Y, Qian Y, Liu W, Jiang T. Larger regional white matter volume is associated with executive function deficit in remitted geriatric depression: an optimized voxel-based morphometry study. J Affect Disord. 2009; 115:225–29. https://doi.org/10.1016/j.jad.2008.09.018 [PubMed]