


Introduction
In a recent epidemiologic study of 20,922 children in the US, approximately 1 in 7 children experienced at least 1 episode of surgical procedure under general anesthesia before 3 years of age [1]. Of them, more than 1 in 4 children who received general anesthesia were at high risk for neurodevelopmental problems, as defined by Food and Drug Administration warning—“repeated or lengthy use of general anesthetic and sedative agents may affect brain development in children < 3 years” [1, 2].
Over the years, studies have shown that anesthesia and surgery during childhood was associated not only with postoperative behavioral changes, but also with long-term deficits in neurocognitive function, learning ability, and academic performance [3–7]. Recent studies provided evidence that a single brief anesthesia for approximately 1 h in infancy or under age 3 did not have significant impact on neurodevelopment [8–10]; however, in children receiving multiple anesthesia exposures, their parents reported problems of behaviors, executive function, and reading [11]. Animal studies also indicated neurotoxicity after neonatal exposure to general anesthesia [12–17]. To date, the extent of the risk of neurotoxicity associated with anesthetics and the exact mechanisms remain elusive.
Sevoflurane is the most popular inhalational anesthetic agent for pediatric patients, with excellent properties of respiratory tolerance, rapid onset, rapid offset, and hemodynamic stability [18]. Recent studies showed that repeated sevoflurane exposures in the neonatal period led to subsequent learning impairment, memory deficits, and behavioral abnormalities in the young animal [12, 19–21]. However, these studies investigated the expression of several genes, related proteins, and a small number of signaling pathways.
Several brain regions including hippocampus, parahippocampal cortex, entorhinal cortex, retrosplenial cortex, and dorsolateral prefrontal cortex are involved in the cognitive processes [22, 23]. Of these, the hippocampus plays an essential role in navigation, cognition, and memory. Animal studies showed that gene knockout or pharmacological intervention in the hippocampus caused loss of learning ability and memory storage [24, 25]. In addition, the hippocampus and prefrontal cortex are related to impairments in cognitive function and memory during aging [26, 27].
In this study, the model of multiple neonatal exposures to sevoflurane was used to assess cognitive function, social interaction, anxiety, depression, and stereotyped behaviors in young mice. The main objective was to reveal the genome-wide expression profile and differentially expressed genes (DEGs) in the hippocampus between sevoflurane-treated and control mice by using the high-throughput mRNA-sequencing (RNA-seq). The biological processes, signaling pathways, and protein interactions of target DEGs were analyzed. Furthermore, real-time quantitative reverse transcription polymerase chain reaction (qPCR) assays were performed to validate the RNA-seq results.
Results
Multiple neonatal exposures to sevoflurane led to cognitive and social behavior impairment in the young mice
The study design is presented in Figure 1A. After sevoflurane anesthesia on postnatal day (PND) 6, 8, and 10, arterial blood gas tests were performed on PND 10, behavioral tests were carried out on PND 31–36, and the hippocampal tissues were harvested on PND 37 for RNA-Seq analysis.
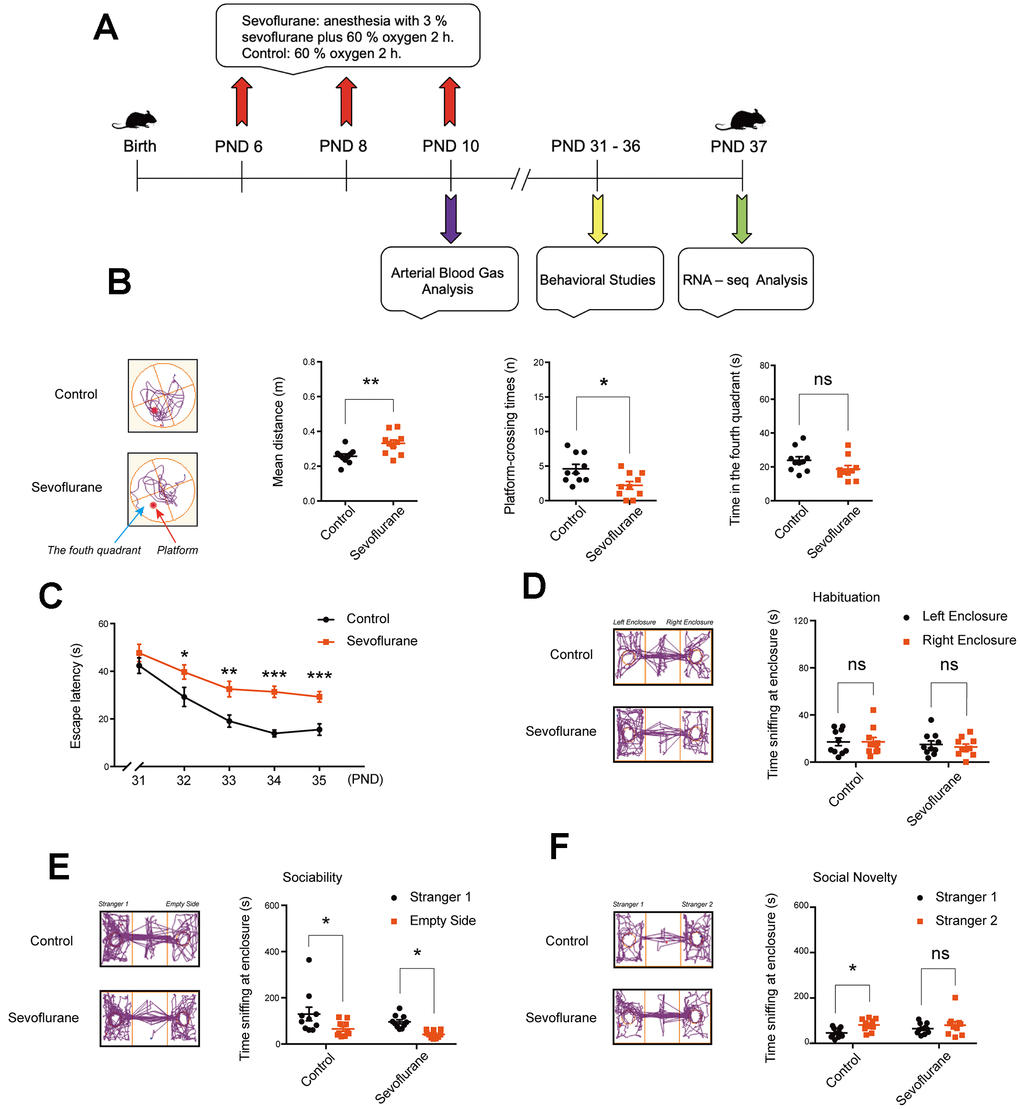
Figure 1. Cognitive function and social behaviors in young mice after multiple sevoflurane exposures during the neonatal period. (A) 3% sevoflurane 2 h daily on postnatal day (PND) 6, 8, and 10, arterial blood test on PND 10, behavioral test on PND 31–36, and RNA-seq analysis of hippocampal tissues on PND 37. (B) Morris water maze (testing phase on PND 36) showing longer mean distance from the original platform area and fewer platform-crossing times in the sevoflurane group, without significant difference in time spent in the fourth quadrant. (C) Morris water maze (training phase on PND 31–35) showing longer escape latency in the sevoflurane group. (D) Social interaction test on habituation showing no significant difference in time of sniffing at the left and right empty enclosures for both groups. (E) Social interaction test on sociability showing that both groups spent more time sniffing at Stranger 1 than at the empty enclosure. (F) Social interaction test on preference for social novelty showing that the control group, but not sevoflurane group, spent more time sniffing at Stranger 2 than Stranger 1. n = 10. *p < 0.05, **p < 0.01, ***p < 0.001 for the comparisons shown.
Cognitive function was evaluated using the Morris water maze (MWM) test. In the testing phase on PND 36, mice in the sevoflurane group had longer mean distance from the platform (0.33 ± 0.02 vs. 0.26 ± 0.01 m, p = 0.006) and fewer platform-crossing times (2.20 ± 0.55 vs. 4.60 ± 0.65, p = 0.011) compared to the control group (Figure 1B), while time spent in the fourth quadrant did not differ between the two groups. In the training phase on PND 32–35, the sevoflurane group showed longer escape latency than the control group (31.36 ± 2.37 vs. 13.91 ± 1.44 s, p < 0.0001 for PND 34; Figure 1C).
In addition, social interaction tests were carried out. In the habituation session, both groups spent similar time sniffing at the left and right empty enclosures (Figure 1D). In the sociability session, both groups spent more time sniffing at Stranger 1 than at the empty enclosure (Figure 1E). In the preference for social novelty session, the control group spent more time sniffing at Stranger 2 than Stranger 1 (81.05 ± 6.60 vs. 42.31 ± 5.64 s, p = 0.02; Figure 1F), while the sevoflurane group showed no difference (80.48 ± 15.53 vs. 64.73 ± 7.57 s, p = 0.48).
Multiple neonatal exposures to sevoflurane did not induce anxiety-like, depression-like, or stereotyped behaviors
First, in the open field test, two groups had similar time of stay in the center, speed of movement, and distance traveled (Supplementary Figure 1A–1C), indicating that sevoflurane did not induce anxiety-like behaviors. Next, in the elevated plus maze and light-dark box tests, the two groups had similar time in the open arms, numbers of open and closed arms entries, and time in the caliginous section (Supplementary Figure 1D–1G), suggesting no significant depression-like behaviors. Finally, in the self-grooming test, similar numbers and time of self-grooming showed that sevoflurane did not induce stereotyped behaviors (Supplementary Figure 1H–1I).
Oxygenation and homeostasis were maintained during sevoflurane anesthesia
To rule out the possibility that the specific changes noted in behaviors or gene expression may be due to poor oxygenation, arterial blood samples were taken for analysis at PND 10 in the sevoflurane group. The value of PO2 was lower at 115 min than that at 5 min (89.25 ± 1.66 vs. 94.13 ± 0.91 mmHg, p = 0.02; Supplementary Figure 2A), but both within the normal range. In addition, the other parameters including PCO2, Hct, pH, Na+, K+, Ca+, and Cl- remained stable (Supplementary Figure 2B–2H).
RNA-seq analysis identified 49 up-regulated and 265 down-regulated DEGs
RNA-seq analysis showed the expression level of 17,107 genes in the mice hippocampus of the sevoflurane and control groups. Of these, a total of 314 DEGs were determined (Figure 2A), including 49 up-regulated genes (Figure 2B, Supplementary Table 2) and 265 down-regulated genes (Figure 2C, Supplementary Table 3). These DEGs present differential expression profiles, which distinguishes the sevoflurane group from the control group apparently. The top 20 up- and down-regulated DEGs are listed in Table 1.
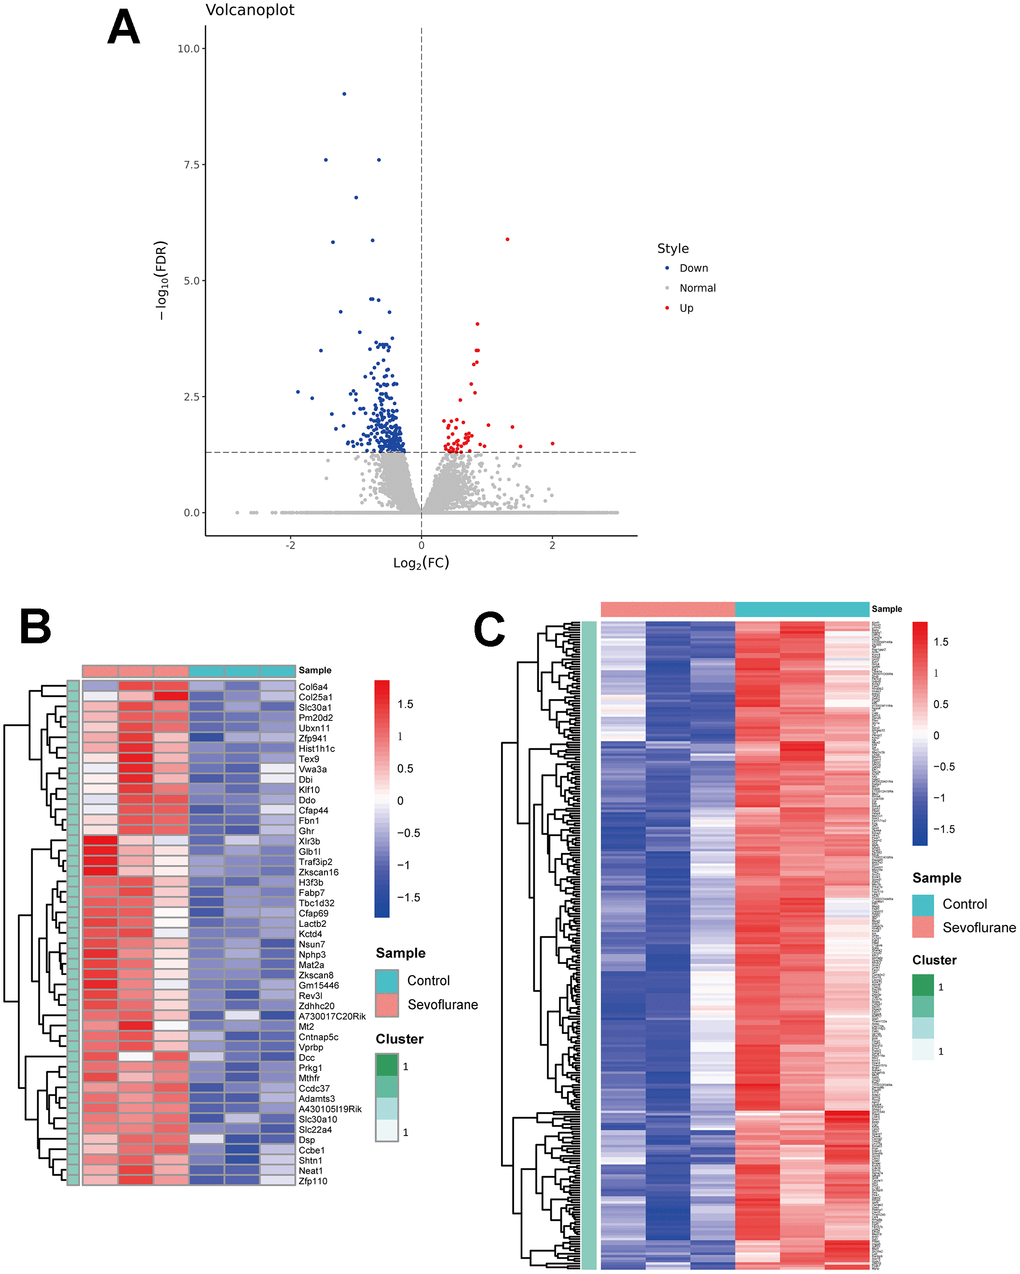
Figure 2. Volcano plot and heatmaps of DEGs in hippocampal tissues between sevoflurane-treated and control mice. (A) Volcano plot showing up-regulated (red dots) and down-regulated (blue dots) DEGs and normally expressed genes (gray dots). (B) Heatmap of 49 up-regulated DEGs. (C) Heatmap of 265 down-regulated DEGs.
Table 1. Top 20 up-regulated and down-regulated DEGs.
| Gene | log2FC | p-value | FDR | Location | |||||||||||||||||||||||||||||||||||||||||||||||||||||||||||||||||||||||||||||||||||||||||||||||
| Up-regulated | |||||||||||||||||||||||||||||||||||||||||||||||||||||||||||||||||||||||||||||||||||||||||||||||||||
| Hist1h1c | 1.312676 | 5.32E-10 | 1.29E-06 | chr13:23738807-23739531 | |||||||||||||||||||||||||||||||||||||||||||||||||||||||||||||||||||||||||||||||||||||||||||||||
| Fabp7 | 0.853611 | 9.19E-08 | 8.57E-05 | chr10:57784923-57788450 | |||||||||||||||||||||||||||||||||||||||||||||||||||||||||||||||||||||||||||||||||||||||||||||||
| Neat1 | 0.836954 | 6.96E-07 | 0.000319 | chr19:5824710-5845478 | |||||||||||||||||||||||||||||||||||||||||||||||||||||||||||||||||||||||||||||||||||||||||||||||
| Tbc1d32 | 0.862511 | 7.10E-07 | 0.000319 | chr10:56014294-56228689 | |||||||||||||||||||||||||||||||||||||||||||||||||||||||||||||||||||||||||||||||||||||||||||||||
| Klf10 | 0.843942 | 1.46E-06 | 0.000573 | chr15:38294406-38300711 | |||||||||||||||||||||||||||||||||||||||||||||||||||||||||||||||||||||||||||||||||||||||||||||||
| Mt2 | 0.796616 | 1.74E-06 | 0.00064 | chr8:94172618-94173567 | |||||||||||||||||||||||||||||||||||||||||||||||||||||||||||||||||||||||||||||||||||||||||||||||
| Fbn1 | 0.758222 | 6.25E-06 | 0.001693 | chr2:125300594-125506438 | |||||||||||||||||||||||||||||||||||||||||||||||||||||||||||||||||||||||||||||||||||||||||||||||
| Ccbe1 | 0.815541 | 1.23E-05 | 0.002613 | chr18:66056856-66291838 | |||||||||||||||||||||||||||||||||||||||||||||||||||||||||||||||||||||||||||||||||||||||||||||||
| Prkg1 | 0.591146 | 2.20E-05 | 0.003748 | chr19:30564487-31765033 | |||||||||||||||||||||||||||||||||||||||||||||||||||||||||||||||||||||||||||||||||||||||||||||||
| Pm20d2 | 0.537705 | 9.04E-05 | 0.009937 | chr4:33170406-33189737 | |||||||||||||||||||||||||||||||||||||||||||||||||||||||||||||||||||||||||||||||||||||||||||||||
| H3f3b | 0.34208 | 0.000102 | 0.01057 | chr11:116021961-116024504 | |||||||||||||||||||||||||||||||||||||||||||||||||||||||||||||||||||||||||||||||||||||||||||||||
| Slc30a1 | 0.456209 | 0.000105 | 0.010728 | chr1:191906781-191913247 | |||||||||||||||||||||||||||||||||||||||||||||||||||||||||||||||||||||||||||||||||||||||||||||||
| Cntnap5c | 0.637167 | 0.000114 | 0.011397 | chr17:57769570-58410342 | |||||||||||||||||||||||||||||||||||||||||||||||||||||||||||||||||||||||||||||||||||||||||||||||
| Ddo | 1.020954 | 0.000134 | 0.01302 | chr10:40630011-40649931 | |||||||||||||||||||||||||||||||||||||||||||||||||||||||||||||||||||||||||||||||||||||||||||||||
| Mthfr | 0.416183 | 0.000141 | 0.013283 | chr4:148041189-148059562 | |||||||||||||||||||||||||||||||||||||||||||||||||||||||||||||||||||||||||||||||||||||||||||||||
| Cfap44 | 1.387494 | 0.000160 | 0.014272 | chr16:44394799-44482428 | |||||||||||||||||||||||||||||||||||||||||||||||||||||||||||||||||||||||||||||||||||||||||||||||
| Mat2a | 0.40471 | 0.000174 | 0.014828 | chr6:72432799-72439558 | |||||||||||||||||||||||||||||||||||||||||||||||||||||||||||||||||||||||||||||||||||||||||||||||
| Zkscan8 | 0.524755 | 0.000175 | 0.014828 | chr13:21513221-21531114 | |||||||||||||||||||||||||||||||||||||||||||||||||||||||||||||||||||||||||||||||||||||||||||||||
| Cfap69 | 0.72325 | 0.000263 | 0.019481 | chr5:5580982-5664232 | |||||||||||||||||||||||||||||||||||||||||||||||||||||||||||||||||||||||||||||||||||||||||||||||
| Slc30a10 | 0.474247 | 0.000284 | 0.020126 | chr1:185454848-185468761 | |||||||||||||||||||||||||||||||||||||||||||||||||||||||||||||||||||||||||||||||||||||||||||||||
| Down-regulated | |||||||||||||||||||||||||||||||||||||||||||||||||||||||||||||||||||||||||||||||||||||||||||||||||||
| Sdf2l1 | -1.1809 | 7.82E-14 | 9.48E-10 | chr16:17130138-17132383 | |||||||||||||||||||||||||||||||||||||||||||||||||||||||||||||||||||||||||||||||||||||||||||||||
| E130012A19Rik | -1.4612 | 5.89E-12 | 2.51E-08 | chr11:97627387-97629716 | |||||||||||||||||||||||||||||||||||||||||||||||||||||||||||||||||||||||||||||||||||||||||||||||
| Gatsl2 | -0.65162 | 6.22E-12 | 2.51E-08 | chr5:134099748-134141758 | |||||||||||||||||||||||||||||||||||||||||||||||||||||||||||||||||||||||||||||||||||||||||||||||
| Rims4 | -0.99919 | 5.35E-11 | 1.62E-07 | chr2:163863881-163918683 | |||||||||||||||||||||||||||||||||||||||||||||||||||||||||||||||||||||||||||||||||||||||||||||||
| Doc2a | -0.74835 | 6.73E-10 | 1.36E-06 | chr7:126847553-126852705 | |||||||||||||||||||||||||||||||||||||||||||||||||||||||||||||||||||||||||||||||||||||||||||||||
| Klf4 | -1.35382 | 8.59E-10 | 1.49E-06 | chr4:55527137-55532475 | |||||||||||||||||||||||||||||||||||||||||||||||||||||||||||||||||||||||||||||||||||||||||||||||
| Efhd2 | -0.74812 | 1.74E-08 | 2.51E-05 | chr4:141858142-141874920 | |||||||||||||||||||||||||||||||||||||||||||||||||||||||||||||||||||||||||||||||||||||||||||||||
| Ccdc184 | -0.7742 | 1.86E-08 | 2.51E-05 | chr15:98167806-98170134 | |||||||||||||||||||||||||||||||||||||||||||||||||||||||||||||||||||||||||||||||||||||||||||||||
| Stx1a | -0.65659 | 2.18E-08 | 2.65E-05 | chr5:135023572-135051099 | |||||||||||||||||||||||||||||||||||||||||||||||||||||||||||||||||||||||||||||||||||||||||||||||
| Sox18 | -1.23674 | 4.24E-08 | 4.68E-05 | chr2:181669837-181671640 | |||||||||||||||||||||||||||||||||||||||||||||||||||||||||||||||||||||||||||||||||||||||||||||||
| Nr2f1 | -0.49017 | 4.73E-08 | 4.78E-05 | chr13:78188973-78198982 | |||||||||||||||||||||||||||||||||||||||||||||||||||||||||||||||||||||||||||||||||||||||||||||||
| Cit | -0.94487 | 1.49E-07 | 0.000129 | chr5:115845656-116006341 | |||||||||||||||||||||||||||||||||||||||||||||||||||||||||||||||||||||||||||||||||||||||||||||||
| 9430020K01Rik | -0.44648 | 2.16E-07 | 0.000175 | chr18:4634929-4682869 | |||||||||||||||||||||||||||||||||||||||||||||||||||||||||||||||||||||||||||||||||||||||||||||||
| Kcnab3 | -0.69399 | 2.83E-07 | 0.000215 | chr11:69326258-69333041 | |||||||||||||||||||||||||||||||||||||||||||||||||||||||||||||||||||||||||||||||||||||||||||||||
| Lasp1 | -0.63517 | 3.35E-07 | 0.000239 | chr11:97799672-97838764 | |||||||||||||||||||||||||||||||||||||||||||||||||||||||||||||||||||||||||||||||||||||||||||||||
| Cacna1i | -0.53254 | 3.60E-07 | 0.000239 | chr15:80287238-80398292 | |||||||||||||||||||||||||||||||||||||||||||||||||||||||||||||||||||||||||||||||||||||||||||||||
| Fosl2 | -0.59154 | 3.75E-07 | 0.000239 | chr5:32136472-32157839 | |||||||||||||||||||||||||||||||||||||||||||||||||||||||||||||||||||||||||||||||||||||||||||||||
| Pdia6 | -0.55648 | 3.98E-07 | 0.000239 | chr12:17266595-17284770 | |||||||||||||||||||||||||||||||||||||||||||||||||||||||||||||||||||||||||||||||||||||||||||||||
| Xbp1 | -0.59461 | 4.14E-07 | 0.000239 | chr11:5520641-5525993 | |||||||||||||||||||||||||||||||||||||||||||||||||||||||||||||||||||||||||||||||||||||||||||||||
| Pgr | -0.5794 | 5.15E-07 | 0.000271 | chr9:8899833-8968611 | |||||||||||||||||||||||||||||||||||||||||||||||||||||||||||||||||||||||||||||||||||||||||||||||
| DEG, differentially expressed gene; FDR, false discovery rate. | |||||||||||||||||||||||||||||||||||||||||||||||||||||||||||||||||||||||||||||||||||||||||||||||||||
Gene Ontology (GO) analysis revealed significantly enriched GO terms and interactions of biological processes
For the biological process, the top 10 categories with associated DEGs are presented in Table 2. The top 3 enriched GO terms of up-regulated DEGs were positive regulation of vascular endothelial growth factor signaling pathway, cellular zinc ion homeostasis, and zinc ion transport (Figure 3A), while those associated with down-regulated DEGs included regulation of ion transmembrane transport, potassium ion transmembrane transport, and potassium ion transport (Figure 3B). Several significantly enriched biological processes were related to brain development (nervous system development, exocytosis, synapse assembly, and phosphorylation) and cognitive function (learning, memory, and long-term memory), all of which were associated with down-regulated DEGs. All GO terms of biological process are listed in Supplementary Tables 4–5.
Table 2. Top 10 enriched BP terms of up-regulated and down-regulated DEGs.
| ID | Term | DEG(s) | p-value | FDR | Enrichment | ||||||||||||||||||||||||||||||||||||||||||||||||||||||||||||||||||||||||||||||||||||||||||||||
| Up-regulated | |||||||||||||||||||||||||||||||||||||||||||||||||||||||||||||||||||||||||||||||||||||||||||||||||||
| GO:1900748 | positive regulation of vascular endothelial growth factor signaling pathway | Adamts3, Ccbe1 | 1.503E-05 | 0.0040579 | 294.52778 | ||||||||||||||||||||||||||||||||||||||||||||||||||||||||||||||||||||||||||||||||||||||||||||||
| GO:0006882 | cellular zinc ion homeostasis | Slc30a1, Mt2 | 0.0003851 | 0.0406079 | 67.967949 | ||||||||||||||||||||||||||||||||||||||||||||||||||||||||||||||||||||||||||||||||||||||||||||||
| GO:0006829 | zinc ion transport | Slc30a1, Slc30a10 | 0.0015749 | 0.0406079 | 33.983974 | ||||||||||||||||||||||||||||||||||||||||||||||||||||||||||||||||||||||||||||||||||||||||||||||
| GO:0006730 | one-carbon metabolic process | Mat2a, Mthfr | 0.0020959 | 0.0406079 | 29.452778 | ||||||||||||||||||||||||||||||||||||||||||||||||||||||||||||||||||||||||||||||||||||||||||||||
| GO:0035212 | cell competition in a multicellular organism | Vprbp | 0.0022635 | 0.0406079 | 441.79167 | ||||||||||||||||||||||||||||||||||||||||||||||||||||||||||||||||||||||||||||||||||||||||||||||
| GO:0090230 | regulation of centromere complex assembly | H3f3b | 0.0022635 | 0.0406079 | 441.79167 | ||||||||||||||||||||||||||||||||||||||||||||||||||||||||||||||||||||||||||||||||||||||||||||||
| GO:0030575 | nuclear body organization | Neat1 | 0.0022635 | 0.0406079 | 441.79167 | ||||||||||||||||||||||||||||||||||||||||||||||||||||||||||||||||||||||||||||||||||||||||||||||
| GO:1990245 | histone H2A-T120 phosphorylation | Vprbp | 0.0022635 | 0.0406079 | 441.79167 | ||||||||||||||||||||||||||||||||||||||||||||||||||||||||||||||||||||||||||||||||||||||||||||||
| GO:0036018 | cellular response to erythropoietin | Mt2 | 0.0022635 | 0.0406079 | 441.79167 | ||||||||||||||||||||||||||||||||||||||||||||||||||||||||||||||||||||||||||||||||||||||||||||||
| GO:0071584 | negative regulation of zinc ion transmembrane import | Slc30a1 | 0.0022635 | 0.0406079 | 441.79167 | ||||||||||||||||||||||||||||||||||||||||||||||||||||||||||||||||||||||||||||||||||||||||||||||
| Down-regulated | |||||||||||||||||||||||||||||||||||||||||||||||||||||||||||||||||||||||||||||||||||||||||||||||||||
| GO:0034765 | regulation of ion transmembrane transport | Cacng2, Kcnh3, Kcna3, Kcnj4, Cacna1i, Kcnc4, Kcnab3, Kcnj11, Scn1b, Kcnj9, Kcnf1, Kcnb1, Cacng7, Kcnk3, Kcnc1, Kcnj2 | 6.587E-10 | 8.642E-07 | 7.3469317 | ||||||||||||||||||||||||||||||||||||||||||||||||||||||||||||||||||||||||||||||||||||||||||||||
| GO:0071805 | potassium ion transmembrane transport | Kcnh3, Kcna3, Kcnk12, Kcnj4, Kcnc4, Kcnab3, Kcnj11, Kcnf1, Kcnb1, Kcnk3, Kcnc1, Kcnj2 | 6.591E-08 | 3.715E-05 | 7.5871199 | ||||||||||||||||||||||||||||||||||||||||||||||||||||||||||||||||||||||||||||||||||||||||||||||
| GO:0006813 | potassium ion transport | Kcnh3, Kcna3, Kcnj4, Kcnc4, Kcnab3, Kcnj11, Kcnj9, Kcnf1, Kcnb1, Kcnk3, Kcnc1, Kcnj2 | 8.495E-08 | 3.715E-05 | 7.4159818 | ||||||||||||||||||||||||||||||||||||||||||||||||||||||||||||||||||||||||||||||||||||||||||||||
| GO:0000122 | negative regulation of transcription from RNA polymerase II promoter | Scrt1, Fgfr3, Mxi1, Egr1, Pou3f3, Zbtb16, Nfix, Bcl6, Nr2f1, Klf5, Tbx3, Eng, Xbp1, Fezf2, Satb2, Calr, Dab2ip, Ppard, Foxg1, Sox18, Hivep1, Dusp26, Klf4, Cry1 | 4.431E-06 | 0.0014534 | 2.850652 | ||||||||||||||||||||||||||||||||||||||||||||||||||||||||||||||||||||||||||||||||||||||||||||||
| GO:0007399 | nervous system development | Igsf9, Ina, Pou3f3, Sema7a, Nes, Nr2f1, Lmtk2, Fezf2, Cit, Ndel1, Brsk1, Nrsn1, Gdpd5, Sema6c, Bax, Pten | 8.858E-06 | 0.0023242 | 3.6734659 | ||||||||||||||||||||||||||||||||||||||||||||||||||||||||||||||||||||||||||||||||||||||||||||||
| GO:0018105 | peptidyl-serine phosphorylation | Ulk1, Adrbk1, Pink1, Lmtk2, Brsk1, Ttbk1, Csnk1e, Sbk1 | 1.945E-05 | 0.0041297 | 6.9952169 | ||||||||||||||||||||||||||||||||||||||||||||||||||||||||||||||||||||||||||||||||||||||||||||||
| GO:0006811 | ion transport | Cacng2, Kcnh3, Kcna3, Slc38a2, Kcnk12, Kcnj4, Cacna1i, Lasp1, Kcnc4, Fxyd7, Kcnab3, Kcnj11, Grid1, Scn1b, Kcnj9, Kcnf1, Kcnb1, Cacng7, Kcnk3, Kcnc1, Kcnj2 | 2.203E-05 | 0.0041297 | 2.8111885 | ||||||||||||||||||||||||||||||||||||||||||||||||||||||||||||||||||||||||||||||||||||||||||||||
| GO:0006887 | exocytosis | Stxbp1, Doc2a, Cdk16, Stx1a, Rims3, Srcin1, Rims4, Cplx1 | 3.524E-05 | 0.0057795 | 6.4465724 | ||||||||||||||||||||||||||||||||||||||||||||||||||||||||||||||||||||||||||||||||||||||||||||||
| GO:0007416 | synapse assembly | Plxnd1, Farp1, Shank2, Clstn3, Pten | 4.606E-05 | 0.0067145 | 12.453606 | ||||||||||||||||||||||||||||||||||||||||||||||||||||||||||||||||||||||||||||||||||||||||||||||
| GO:0016310 | phosphorylation | Camk2n2, Prkar1b, Fgfr3, Ulk1, Limk1, Adrbk1, Cdk16, Pink1, Lmtk2, Stk32c, Nlk, Cit, Brsk1, Pik3cd, Ttbk1, Pak6, Camkk2, Tnk2, Mast2, Csnk1e, Sbk1, Cerk | 5.219E-05 | 0.0068479 | 2.575874 | ||||||||||||||||||||||||||||||||||||||||||||||||||||||||||||||||||||||||||||||||||||||||||||||
| BP: biological process; DEG: differentially expressed gene; FDR: false discovery rate. | |||||||||||||||||||||||||||||||||||||||||||||||||||||||||||||||||||||||||||||||||||||||||||||||||||
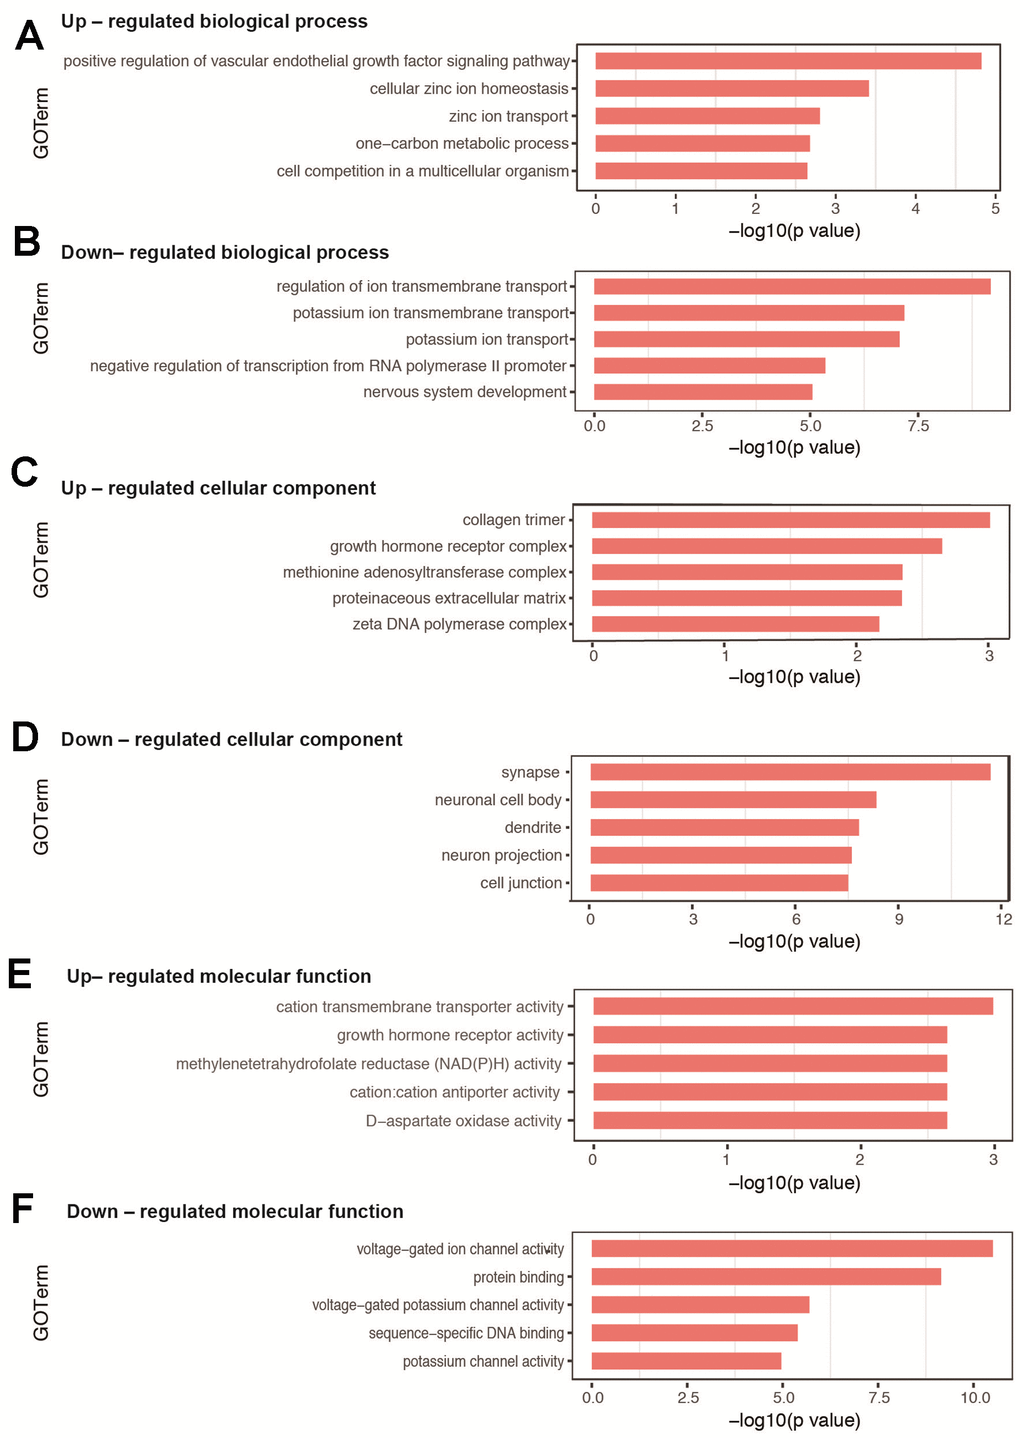
Figure 3. GO analysis of DEGs in hippocampal tissues between sevoflurane-treated and control mice. (A, B) Top 5 GO terms of biological process based on up- and down-regulated DEGs. (C, D) Top 5 GO terms of cellular component based on up- and down-regulated DEGs. (E, F) Top 5 GO terms of molecular function based on up- and down-regulated DEGs. Blue columns indicate terms without significant difference.
The enriched GO terms of DEGs were also classified according to cellular component and molecular function. For cellular component, the most significantly categories were collagen trimer for up-regulated DEGs (Figure 3C) and synapse for down-regulated DEGs (Figure 3D). All GO terms on cellular component are shown in Supplementary Tables 6–7. For molecular function, the most significantly categories were cation transmembrane transporter activity for up-regulated DEGs (Figure 3E) and voltage-gated ion channel activity for down-regulated DEGs (Figure 3F). All GO terms on molecular function are shown in Supplementary Tables 8–9.
GO-Tree analysis illustrated the interactions within the biological processes, as shown in Figure 4. A total of 37 GO terms were involved, with 5 terms associated with up-regulated genes and 32 terms associated with down-regulated genes (Supplementary Table 10). There were several types of relations including complete subordination, partly subordination, positive regulation, and negative regulation within the GO terms.
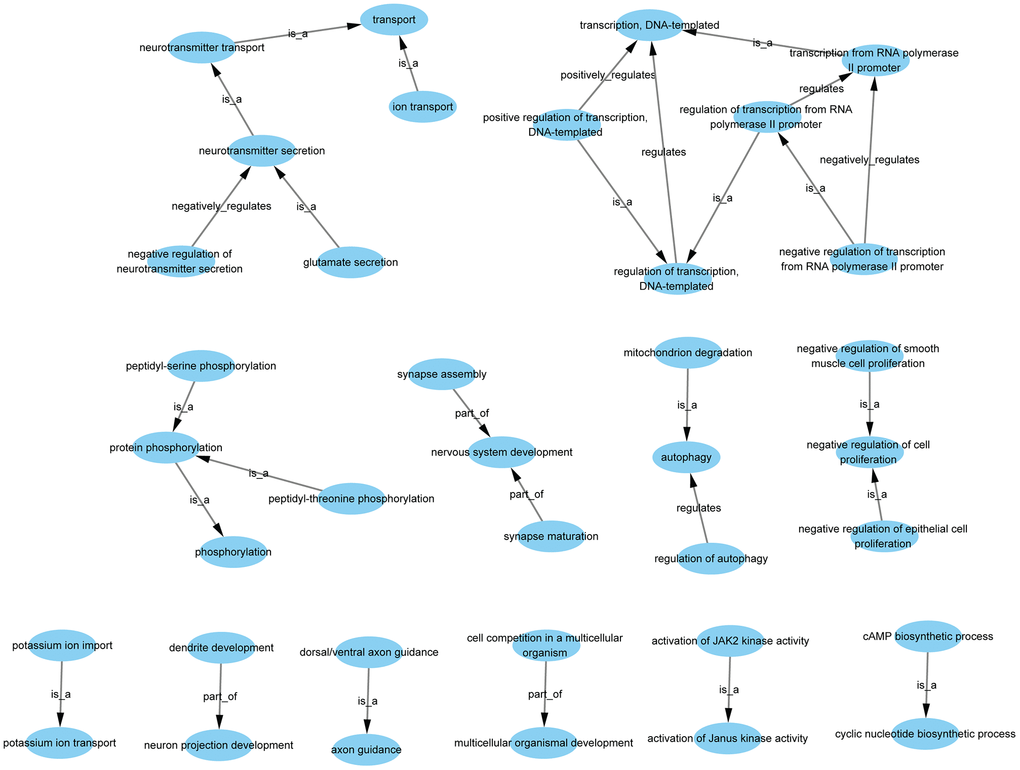
Figure 4. GO-tree analysis based on biological process. Arrow source, a GO term at a lower level; arrow target, a GO term at a higher level. Relation: is a, the downstream GO term is completely subordinate to the upstream GO term; part of, a part of the downstream GO term is subordinate to the upstream GO term; regulates, the downstream GO term can regulate the upstream GO term; positive regulates, the downstream GO term can regulate the upstream GO term positively; negative regulates, the downstream GO term can regulate the upstream GO term negatively.
Pathway analysis revealed significantly enriched signaling pathways and their relationship
Kyoto Encyclopedia of Genes and Genomes (KEGG) pathway analysis revealed 40 significantly enriched signaling pathways, including 3 associated with up-regulated DEGs and 37 associated with down-regulated DEGs. The top enriched pathways for up- and down-regulated genes are presented in Table 3. Mineral absorption, PPAR signaling pathway, and one carbon pool by folate were the top 3 enriched pathways associated with up-regulated DEGs (Figure 5A). For down-regulated DEGs, the top 3 enriched pathways were oxytocin signaling pathway, protein processing in endoplasmic reticulum, and glutamatergic synapse (Figure 5B). Several significantly enriched signaling pathways were associated with the regulation of synapses, including glutamatergic synapse, cholinergic synapse, and GABAergic synapse. All results of KEGG pathway enrichment are listed in Supplementary Tables 11–12.
Table 3. Signaling pathway enrichment of up-regulated and down-regulated DEGs.
| ID | Term | DEG(s) | p-value | FDR | Enrichment | ||||||||||||||||||||||||||||||||||||||||||||||||||||||||||||||||||||||||||||||||||||||||||||||
| Up-regulated | |||||||||||||||||||||||||||||||||||||||||||||||||||||||||||||||||||||||||||||||||||||||||||||||||||
| PATH:04978 | Mineral absorption | Slc30a1, Mt2 | 0.0037153 | 0.1263212 | 21.611594 | ||||||||||||||||||||||||||||||||||||||||||||||||||||||||||||||||||||||||||||||||||||||||||||||
| PATH:03320 | PPAR signaling pathway | Dbi, Fabp7 | 0.0111679 | 0.1898536 | 12.273251 | ||||||||||||||||||||||||||||||||||||||||||||||||||||||||||||||||||||||||||||||||||||||||||||||
| PATH:00670 | One carbon pool by folate | Mthfr | 0.0375845 | 0.3333577 | 26.161404 | ||||||||||||||||||||||||||||||||||||||||||||||||||||||||||||||||||||||||||||||||||||||||||||||
| Down-regulated | |||||||||||||||||||||||||||||||||||||||||||||||||||||||||||||||||||||||||||||||||||||||||||||||||||
| PATH:04921 | Oxytocin signaling pathway | Cacng2, Adcy1, Kcnj4, Kcnj9, Adcy8, Pik3cd, Elk1, Adcy4, Camkk2, Cacng7, Nos3, Kcnj2 | 2.428E-07 | 3.569E-05 | 6.5089481 | ||||||||||||||||||||||||||||||||||||||||||||||||||||||||||||||||||||||||||||||||||||||||||||||
| PATH:04141 | Protein processing in endoplasmic reticulum | Ubqln4, Hspa5, Hyou1, Syvn1, Xbp1, Calr, Pdia4, Fbxo2, Pdia6, Bax, Man1c1 | 2.924E-06 | 0.0002149 | 5.71341 | ||||||||||||||||||||||||||||||||||||||||||||||||||||||||||||||||||||||||||||||||||||||||||||||
| PATH:04724 | Glutamatergic synapse | Slc38a2, Grm4, Adcy1, Grm2, Adrbk1, Glul, Adcy8, Adcy4, Shank2 | 1.52E-05 | 0.000745 | 6.0733098 | ||||||||||||||||||||||||||||||||||||||||||||||||||||||||||||||||||||||||||||||||||||||||||||||
| PATH:04915 | Estrogen signaling pathway | Adcy1, Kcnj9, Adcy8, Pik3cd, Fkbp4, Adcy4, Nos3 | 0.0001353 | 0.0049722 | 6.1215107 | ||||||||||||||||||||||||||||||||||||||||||||||||||||||||||||||||||||||||||||||||||||||||||||||
| PATH:04971 | Gastric acid secretion | Adcy1, Sst, Adcy8, Cckbr, Adcy4, Kcnj2 | 0.0002082 | 0.0061217 | 6.9487418 | ||||||||||||||||||||||||||||||||||||||||||||||||||||||||||||||||||||||||||||||||||||||||||||||
| PATH:04261 | Adrenergic signaling in cardiomyocytes | Cacng2, Adrb1, Adcy1, Scn1b, Adcy8, Pik3cd, Adcy4, Cacng7 | 0.0003244 | 0.0079469 | 4.601404 | ||||||||||||||||||||||||||||||||||||||||||||||||||||||||||||||||||||||||||||||||||||||||||||||
| PATH:05414 | Dilated cardiomyopathy | Cacng2, Adrb1, Adcy1, Adcy8, Adcy4, Cacng7 | 0.0005682 | 0.0119312 | 5.7776056 | ||||||||||||||||||||||||||||||||||||||||||||||||||||||||||||||||||||||||||||||||||||||||||||||
| PATH:05020 | Prion diseases | Egr1, Hspa5, Elk1, Bax | 0.0006871 | 0.0126259 | 9.7944171 | ||||||||||||||||||||||||||||||||||||||||||||||||||||||||||||||||||||||||||||||||||||||||||||||
| PATH:04918 | Thyroid hormone synthesis | Adcy1, Hspa5, Adcy8, Pdia4, Adcy4 | 0.0013702 | 0.0223796 | 6.0352922 | ||||||||||||||||||||||||||||||||||||||||||||||||||||||||||||||||||||||||||||||||||||||||||||||
| PATH:04725 | Cholinergic synapse | Adcy1, Kcnj4, Adcy8, Pik3cd, Adcy4, Kcnj2 | 0.0018898 | 0.0277797 | 4.591133 | ||||||||||||||||||||||||||||||||||||||||||||||||||||||||||||||||||||||||||||||||||||||||||||||
| DEG: differentially expressed gene; FDR: false discovery rate. | |||||||||||||||||||||||||||||||||||||||||||||||||||||||||||||||||||||||||||||||||||||||||||||||||||
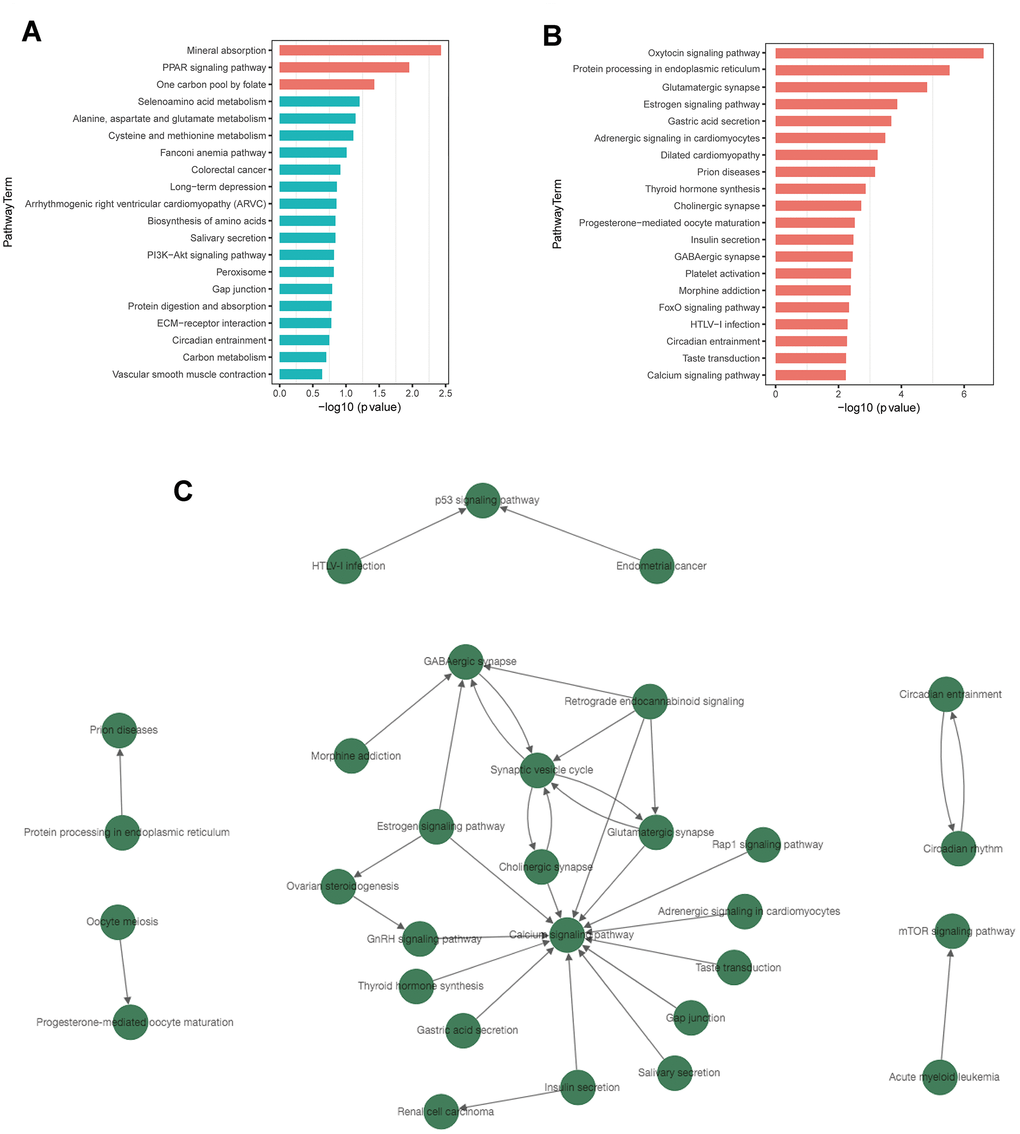
Figure 5. KEGG pathway enrichment and pathway-tree analysis. (A) Top 20 enriched pathways of up-regulated DEGs. (B) Top 20 enriched pathways of down-regulated DEGs. (C) Pathway-tree analysis showing relationship between pathway terms. Arrow source, an upstream signal pathway; arrow target, a downstream signaling pathway. Blue columns indicate pathways without significant difference.
Pathway network analysis showed the upstream and downstream relationship of the significantly enriched signaling pathways (Figure 5C). A total of 30 signaling pathways were involved, all of which were associated with down-regulated DEGs. (Supplementary Table 13). Calcium signaling pathway, synaptic vesicle cycle, and GABAergic synapse were the top 3 pathways with rich connections with other pathways.
GO and KEGG pathway analysis of top 20 up- and down-regulated DEGs
To further investigate the role of top 20 up- and down-regulated DEGs, GO and KEGG analyses were carried out. These genes were labeled in the volcano plot (Supplementary Figure 3A), and their differential expression profiles were visualized in heatmaps (Supplementary Figure 3B–3C). Based on these DEGs, significantly enriched biological processes, cellular components, and molecular functions were categorized by GO analysis (Supplementary Figure 3D–3E). Besides, KEGG pathway analysis found several significantly enriched pathways associated with up- and down-regulated DEGs (Supplementary Figure 3F–3G).
Protein-protein interaction (PPI) network revealed several hub proteins
PPI network analysis showed the interactions among the proteins. Several hub proteins that had rich connectivity with other proteins were identified. Pten (degree = 16), Nos3 (degree = 14), Pik3cd (degree = 12), Cdk16 (degree = 11), Rhobtb2 (degree = 11), Hyou1 (degree = 9), Hspa5 (degree = 9), Pdia4 (degree = 8), Pdia6 (degree = 8), Tbr1 (degree = 8) were the top 10 hub proteins (Figure 6). All results of protein-protein interactions are shown in Supplementary Figure 4.
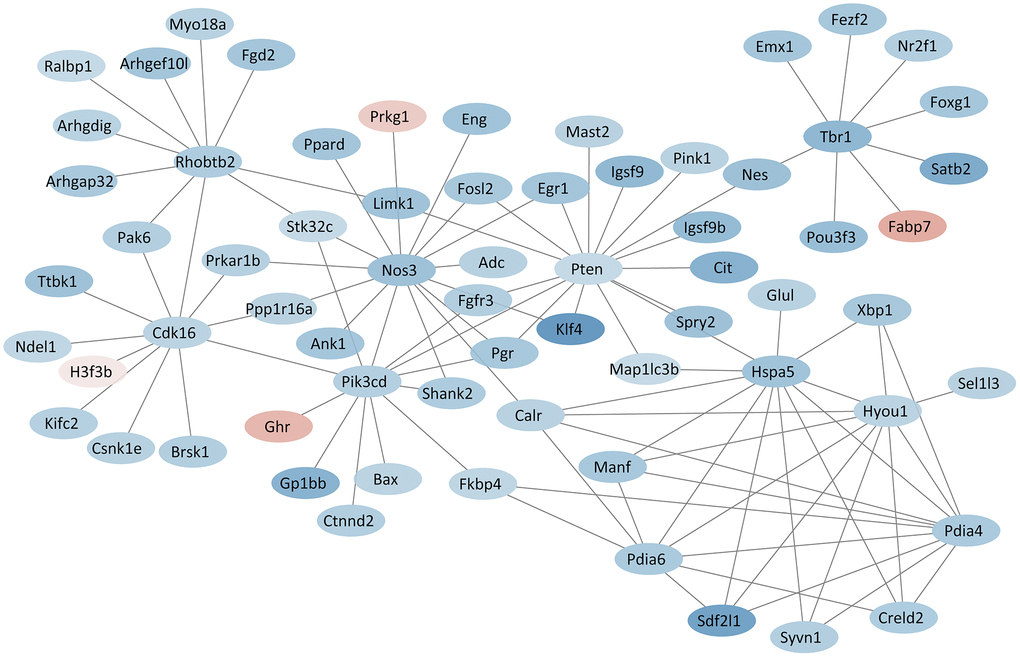
Figure 6. PPI network based on hub proteins. Red and blue colors indicate proteins with up- and down-regulated expression, respectively.
RNA-Seq results were validated by qPCR
The top 20 up- and down-regulated DEGs from RNA-seq analysis were verified by qPCR. For up-regulated DEGs, both RNA-seq analysis and qPCR revealed 9 genes with significantly positive expression change (Fabp7, Klf10, Mt2, Ccbe1, Slc30a1, Mthfr, Cfap44, Zkscan8, and Cfap69), while the expression of Prkg1 showed a negative change in the qPCR results (Figure 7). For down-regulated DEGs, both methods identified 9 genes with a significantly negative expression change (Sdf2l1, Gatsl2, Klf4, Sox18, Nr2fl, Cacna1i, Fols2, Pdia6, and Xbp1), while qPCR showed that the expression of Ccdc184 changed positively (Figure 8).
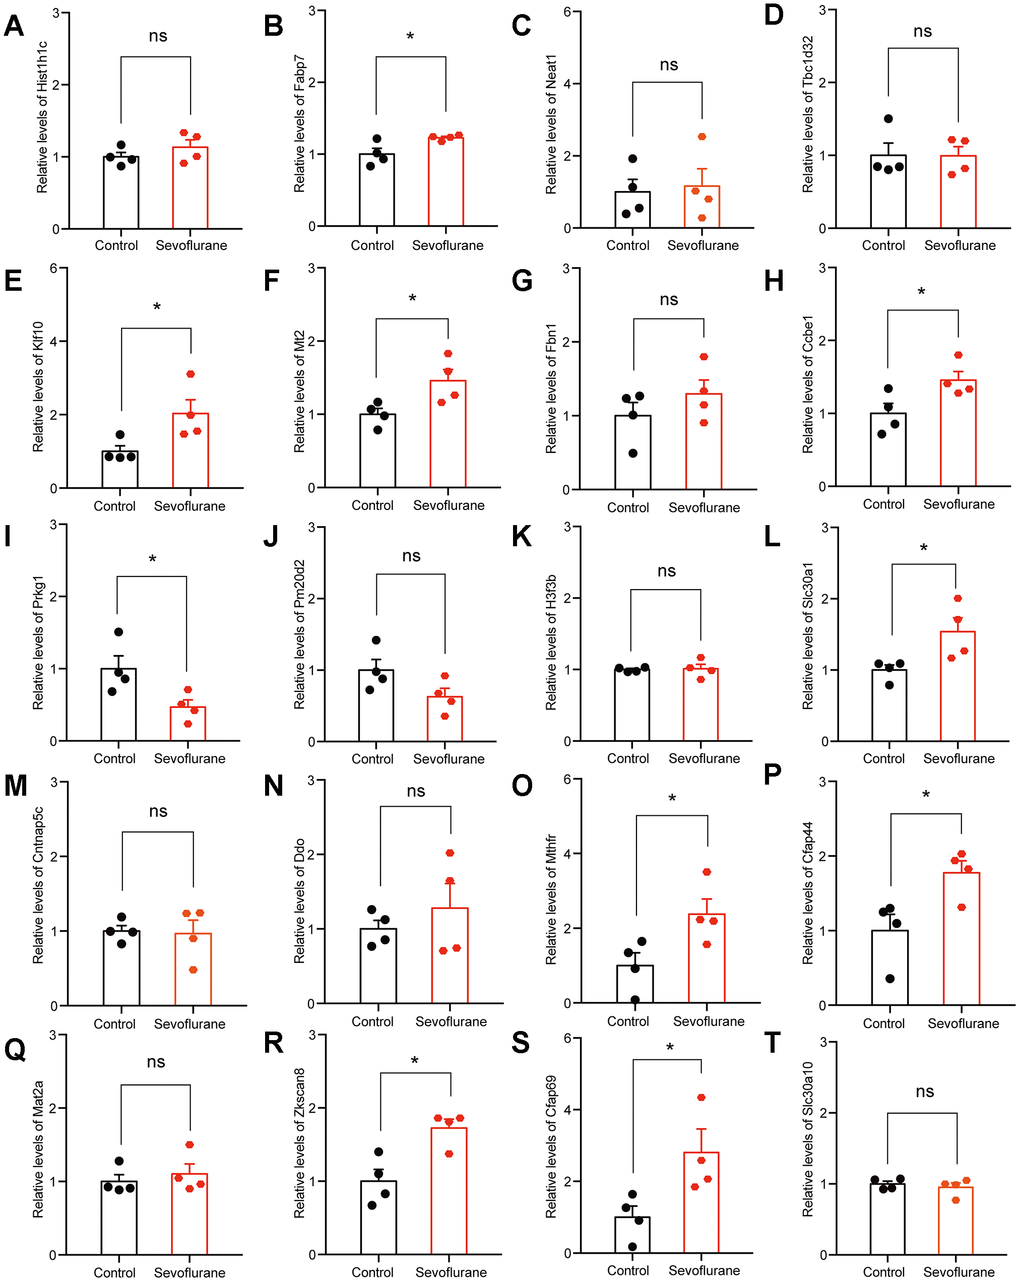
Figure 7. qPCR verification of top 20 up-regulated DEGs. (A) Hist1h1c. (B) Fabp7. (C) Neat1. (D) Tbc1d32. (E) Klf10. (F) Mt2. (G) Fbn1. (H) Ccbe1. (I) Prkg1. (J) Pm20d2. (K) H3f3b. (L) Slc30a1. (M) Cntnap5c. (N) Ddo. (O) Mthfr. (P) Cfap44. (Q) Mat2a. (R) Zkscan8. (S) Cfap69. (T) Slc30a10. n = 4. *p < 0.05 for the comparisons shown.
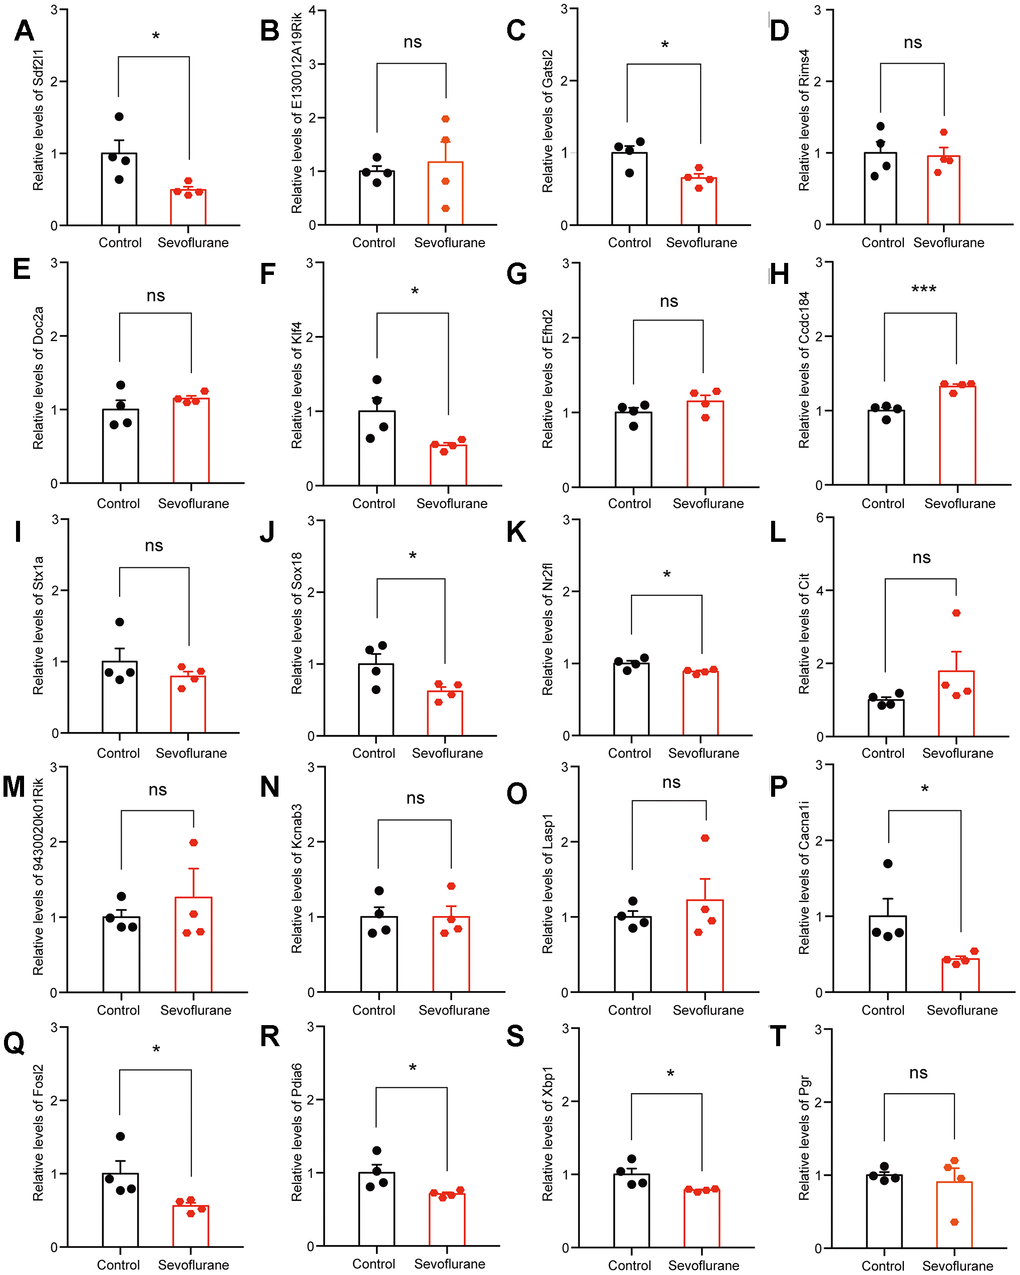
Figure 8. qPCR verification of top 20 down-regulated DEGs. (A) Sdf2l1. (B) E130012A19Rik. (C) Gatsl2. (D) Rims4. (E) Doc2a. (F) Klf4. (G) Efhd2. (H) Ccdc184. (I) Stx1a. (J) Sox18. (K) Nr2f1. (L) Cit. (M) 9430020K01Rik. (N) Kcnab3. (O) Lasp1. (P) Cacna1i. (Q) Fosl2. (R) Pdia6. (S) Xbp1. (T) Pgr. n = 4. *p < 0.05, ***p < 0.001 for the comparisons shown.
Discussion
This is the first study revealing the genome-wide response of the transcriptome of the hippocampus of young mice to neonatal sevoflurane exposures for 3 non-consecutive days. Sevoflurane induced cognitive impairment and social behavior disorders in young mice, but not anxiety-like, depression-like, or stereotyped behaviors. During the sevoflurane procedures, oxygenation and homeostasis were maintained. RNA-seq analysis of the hippocampal tissues identified a total of 314 DEGs and revealed their functional enrichment and interactions. The most significantly enriched biological processes included positive regulation of vascular endothelial growth factor signaling pathway and regulation of ion transmembrane transport. The most significantly enriched signaling pathways included mineral absorption and oxytocin signaling pathway. Pten, Nos3, and Pik3cd were the top 3 hub proteins. The expression of some top DEGs were confirmed by qPCR.
During the human brain development, a unique peak of synaptogenesis occurs in the primary sensorimotor cortex near the birth, temporal cortex at 9 months, and prefrontal cortex at age 3, which is also known as a window of vulnerability [28]. For rodents, the vulnerability window seems to happen on PND 7–30 when exposure to sevoflurane affected brain development [14, 29, 30]. In terms of the sevoflurane concentration, our study used a clinically relevant anesthetic concentration (minimum alveolar concentration of 3.3 ± 0.2% in human neonates) [31]. In addition, studies suggest that 3% sevoflurane did not significantly alter the values of pH, arterial oxygen tension, arterial carbon dioxide tension, or electrolyte contents in mice [31, 32], which was in line with our blood gas results. Thus, the anesthesia protocol of 3% sevoflurane for 2 h on PND 6, 8, and 10 was used in this study. Regarding the MWM test, mice at one-month age may experience relative higher stress in the Morris water maze as compared to adult mice. In fact, MWM performance may be affected by several factors including training procedure, apparatus, and characteristics of the experimental animals (species, strain, sex, age, nutritional status, stress, and infection) [33]. The MWM test has been successfully used to determine cognitive function in young mice at 1-month age in recent studies [12, 20].
Studies showed that neonatal sevoflurane exposures induced long-term neurodegenerative change, learning disability, and memory impairment [12, 34–37]. In the immature brain, sevoflurane caused excitatory effects of the type A gamma-amino butyric acid (GABA-A) receptors, which might contribute to sevoflurane-induced long-term cognitive disorders [38, 39]. Besides, the function of N-Methyl-d-aspartate (NMDA) receptors which is critical for learning and memory has been interfered by repeated sevoflurane anesthesia at the neonatal stage [40, 41]. On the other hand, sevoflurane-induced neurotoxicity was alleviated by treatments of tanshinone IIA, dexmedetomidine, or JNK inhibitor [42–44]. In this study, MWM and social interaction tests confirmed that multiple exposures to sevoflurane in the neonatal period induced cognitive impairment in the young mice. Moreover, RNA-seq analysis of the hippocampus revealed several genes and biological processes related to brain development, including nervous system development (GO:0007399; Igsf9, Ina, Pou3f3, Sema7a, Nes, Nr2f1, Lmtk2, Fezf2, Cit, Ndel1, Brsk1, Nrsn1, Gdpd5, Sema6c, Bax, Pten), exocytosis (GO:0006887; Stxbp1, Doc2a, Cdk16, Stx1a, Rims3, Srcin1, Rims4, Cplx1), synapse assembly (GO:0007416; Plxnd1, Farp1, Shank2, Clstn3, Pten), and phosphorylation (GO:0016310; Camk2n2, Prkar1b, Fgfr3, Ulk1, Limk1, Adrbk1, Cdk16, Pink1, Lmtk2, Stk32c, Nlk, Cit, Brsk1, Pik3cd, Ttbk1, Pak6, Camkk2, Tnk2, Mast2, Csnk1e, Sbk1, Cerk). In addition, there were several biological processes related to learning and memory, including learning (GO:0007612; Grm4, Ctnnd2, Pak6, Shank2), memory (GO:0007613; Adrb1, Pak6, Shank2, Pten), learning or memory (GO:0007611; Prkar1b, Egr1, Pten), and long-term memory (GO:0007616; Adcy1, Adcy8). Of note, all the above-mentioned genes were significantly down-regulated in the hippocampus of sevoflurane-treated mice, suggesting potential new mechanisms which underlie the cognitive impairment by sevoflurane exposure.
In the GO analysis, several top enriched biological processes were related to ion channels. Cellular zinc ion homeostasis (GO:0006882; Adamts3, Ccbe1), zinc ion transport (GO:0006829; Slc30a1, Slc30a10), and negative regulation of zinc ion transmembrane import (GO:0071584; Slc30a1) were associated with up-regulated DEGs. Regulation of ion transmembrane transport (GO:0034765; Cacng2, Kcnh3, Kcna3, Kcnj4, Cacna1i, Kcnc4, Kcnab3, Kcnj11, Scn1b, Kcnj9, Kcnf1, Kcnb1, Cacng7, Kcnk3, Kcnc1, Kcnj2), potassium ion transmembrane transport (GO:0071805; Kcnh3, Kcna3, Kcnk12, Kcnj4, Kcnc4, Kcnab3, Kcnj11, Kcnf1, Kcnb1, Kcnk3, Kcnc1, Kcnj2), potassium ion transport (GO:0006813; Kcnh3, Kcna3, Kcnj4, Kcnc4, Kcnab3, Kcnj11, Kcnj9, Kcnf1, Kcnb1, Kcnk3, Kcnc1, Kcnj2), and ion transport (GO:0006811; Cacng2, Kcnh3, Kcna3, Slc38a2, Kcnk12, Kcnj4, Cacna1i, Lasp1, Kcnc4, Fxyd7, Kcnab3, Kcnj11, Grid1, Scn1b, Kcnj9, Kcnf1, Kcnb1, Cacng7, Kcnk3, Kcnc1, Kcnj2) were based on down-regulated DEGs. Consistently, previous findings support that sevoflurane could influence the activities of ion channels [45–48].
Cellular response to hypoxia and apoptotic process are also involved in the effects of sevoflurane on the neonatal brain. We found enriched biological process of cellular response to hypoxia associated with down-regulated DEGs (GO:0071456; Egr1, Pink1, Ppard, Kcnk3). Previous studies showed that early exposure to sevoflurane could cause apoptosis in the cerebral cortex and hippocampus [49, 50]. In this study, the GO analysis revealed a number of biological processes related to apoptosis, such as regulation of neuron apoptotic process (GO:0043523; Grm2, Pink1, Bax), positive regulation of apoptotic process (GO:0043065; Adrb1, Zbtb16, Bcl6, Dab2ip, Zmat3, Nos3, Bax, Pten), positive regulation of neuron apoptotic process (GO:0043525; Fgfr3, Egr1, Bax), and negative regulation of neuron apoptotic process (GO:0043524; Stxbp1, Nes, Pink1, Bax, Sncb). These results suggest that multiple sevoflurane exposures may affect neurodevelopment through regulating cellular response to hypoxia and the apoptotic process.
Autism spectrum disorder (ASD), a common childhood neurodevelopmental disorder, is characterized by social interaction impairment and repetitive behaviors [51]. It is unclear whether sevoflurane exposure may contribute to the development of ASD. Some studies reported that neonatal exposures to sevoflurane induced abnormal social behaviors [31, 52, 53], while others found no autism-like behaviors after sevoflurane anesthesia [36, 54]. In this study, multiple neonatal exposures to sevoflurane had a negative impact on social interactions, evidence by the loss of ability to distinguish a new mouse. This result can also be explained by the impairments of the frontal cortex functions, which is most vulnerable in the observed period of ontogenesis. A recent study found that multiple sevoflurane anesthesia impaired the prefrontal cortex functions in the developmental brain [55]. Our RNA-seq analysis identified 3 down-regulated genes (Grid1, Shank2, Pten) related to social behaviors, 5 down-regulated genes (Sobp, Fezf2, Pak6, Apba1, Pten) related to locomotory behaviors, and 1 up-regulated gene (Ddo) related to grooming-like stereotyped behaviors. The current results may help to detect the key genes for ASD treatment in further investigations.
Among the significantly enriched signaling pathways from KEGG analysis, oxytocin signaling pathway (PATH:04921; Cacng2, Adcy1, Kcnj4, Kcnj9, Adcy8, Pik3cd, Elk1, Adcy4, Camkk2, Cacng7, Nos3, Kcnj2) may play an important role in the sevoflurane-induced cognitive impairment. Tara et al. found that oxytocin signaling pathway in the hippocampus was essential for social recognition [56]. In this study, a significantly decreased activity of oxytocin signaling in the hippocampus was noted. In addition, several enriched signaling pathways of down-regulated DEGs were on the regulation of synapses, including glutamatergic synapse (PATH:04724; Slc38a2, Grm4, Adcy1, Grm2, Adrbk1, Glul, Adcy8, Adcy4, Shank2), cholinergic synapse (PATH:04725; Adcy1, Kcnj4, Adcy8, Pik3cd, Adcy4, Kcnj2), and GABAergic synapse (PATH:04727; Slc38a2, Adcy1, Glul, Adcy8, Adcy4). The above-mentioned pathways and related genes may be useful for further research.
The PPI network revealed several hub-proteins encoded by DEGs, including phosphatase and tensin homolog (Pten), nitric oxide synthase 3 (Nos3), phosphatidylinositol-4,5-bisphosphate 3-kinase catalytic subunit delta (Pik3cd), cyclin-dependent kinase 16 (Cdk16), Rho-related BTB domain containing 2 (Rhobtb2), hypoxia up-regulated 1 (Hyou1), heat shock protein 5 (Hspa5), protein disulfide isomerase associated 4 (Pdia4), protein disulfide isomerase associated 6 (Pdia6), and T-box brain gene 1 (Tbr1). Among these, Pten was involved in the processes of nervous system development, synapse assembly, learning and memory, and locomotory and social behaviors in the GO analysis. A recent study found that sevoflurane exposure on gestational day 14 induced neurotoxicity in the fetal brain of rats through the Pten signaling [57]. For other hub-proteins, Nos3 and Pik3cd were involved in the oxytocin signaling pathway in the KEGG analysis, and Cdk16 was involved in exocytosis and phosphorylation. Recent studies also showed that Nos3 and Pik3cd play an important role in neurodevelopmental disorders [58, 59].
This study has several limitations. First, the RNA-seq only tested the expression profile of mRNAs, without other types of RNAs such as lncRNAs or miRNAs. Second, the sample size of RNA-seq analysis was relatively small. Third, there were variations in gene expression detected by RNA-seq and qPCR, which may be due to the methodological or statistical differences. Fourth, the transcriptomic profile may need to be further validated by using the western blot experiment. Last, the entire hippocampal tissues of mice were harvested for RNA-seq. The discrepancy of gene expression and signaling pathway enrichment among different hippocampal regions including cornu amonis (CA)1, CA2, CA3, and gyrus dentatus should be considered. Therefore, based on the current findings, further experiments with larger sample size are needed to identify the role of key genes in response to multiple neonatal sevoflurane exposures.
In summary, multiple neonatal exposures to sevoflurane induced cognitive impairment and social behavior disorders in young mice. RNA-seq analysis identified 314 DEGs that encode proteins participating in relevant biological processes (ion channels, brain development, synapse assembly, learning, and memory) and signaling pathways (oxytocin signaling pathway, glutamatergic synapse, cholinergic synapse, and GABAergic synapse), via which the mice hippocampus responded to sevoflurane. With a novel insight into the sevoflurane-related neurotoxicity in developing brain, this study helps to provide a fundamental work for elucidation of underlying mechanisms and exploration of potential prophylactic targets.
Materials and Methods
Animals and sevoflurane anesthesia
The experimental protocol was approved (protocol number: 201808A076) by the Institutional Animal Care and Use Committee of Soochow University (Suzhou, China). C57BL/6J mice were purchased from the Slaccas Laboratory (Shanghai, China) and received standard rodent food and water. The male pups were used in this study. Using a computer-generated table, the neonatal mice were randomly assigned to either of the two study groups (control or sevoflurane).
The animal model was described in a recent study [12]. On PND 6, 8, and 10, the sevoflurane group received 3% sevoflurane with 60% oxygen (balanced with nitrogen) for 2 h (2 L/min fresh gas for 3 min, followed by 1 L/min) in a chamber using the Datex-Ohmeda anesthesia system (Madison, WI, USA), while the control group received 60% oxygen in nitrogen for 2 h. The sevoflurane concentration was monitored and adjusted by using a gas analyzer (Vamos; Dräger Medical, Germany). The rectal temperature of mice was maintained at 37 ± 0.5 °C. After treatment, the mice were returned to home cages under standard care.
Arterial blood gas analysis
Blood samples (100 μL each) were taken from the abdominal aorta at 5 min and 115 min during sevoflurane exposure on PND 10 (n = 8 for each group). The samples were then immediately analyzed by using a blood gas analyzer (Radiometer, ABL80 FLEX, Carlsbad, CA, USA). The values of pH, partial pressures of oxygen (PO2) and carbon dioxide (PCO2), hematocrit (Hct), Na+, K+, Ca2+, and Cl- were recorded.
Behavioral studies
The behavioral tests (n = 10 for each group) in this study included MWM at 03:00-5:00 pm on PND 31–36, social interaction test at 09:00-12:00 am on PND 31, open field test at 09:00-11:00 am on PND 32, elevated plus maze at 09:00-11:00 am on PND 33, light-dark box test at 09:00-11:00 am on PND 34, and self-grooming test at 09:00-11:00 am on PND 35. The motions of each mouse were monitored and recorded by the ANY-maze Behavior Tracking System (Stoelting Co., Wood Dale, IL, USA).
MWM tests were conducted as previously described [60]. The water maze device was filled with opaque water using titanium dioxide to reach the level of 1.0 cm above the surface of a platform (diameter, 10 cm). Throughout the experiment, the water temperature was kept at 22 °C, and the surrounding environment remained quiet. In the training phase on PND 31–35, the mice were trained to reach the platform for 5 days with 4 trials per day, and the escape latency (time for mice to reach the platform) was recorded for the evaluation of spatial learning. In the testing phase on PND 36, the platform was removed, and mean distance from the original platform area, platform-crossing times, and time spent in the fourth quadrant (the platform quadrant) were recorded for the assessment of memory function. A heat lamp was used to warm and dry the mice before returning to home cages.
Social interaction tests were performed as previously presented [61]. In the first session (habituation), the mouse was initially placed in the middle chamber, with free access to the left and right chambers. During 5 min of observation, the time of sniffing (direct snout-to-enclosure contact) at both enclosures in the center of chambers was recorded. In the second session (sociability), a different mouse, Stranger 1, was placed into one enclosure, and the motions of the experiment mouse were tracked for 10 min. The time of sniffing at Stranger 1 and at the empty enclosure were recorded. In the third session (preference for social novelty), another mouse, Stranger 2, was placed into the other enclosure, and the motions of the experiment mouse was tracked for 10 min. The time of sniffing at Stranger 1 and Stranger 2 was recorded.
Open field tests were carried out to investigate the anxiety-like and exploratory behaviors, according to the previously described methods [62]. A central area of 10 × 10 cm2 was defined in the field box (40 × 40 × 40 cm3). The mouse was initially placed in the corner of the box and allowed to explore the field freely for 10 min. The time spent in the central area, speed of movement, and distance travelled were recorded.
Elevated plus maze and light-dark box tests were used to assess the depression-like behaviors [63, 64]. The mouse was initially placed at the center of the maze and allowed to explore the maze freely for 10 min. The time of exploring open arms and number of open and closed arms entries were recorded. For the light-dark box, a large bright compartment was connected to a small caliginous compartment by a door of 7 cm. The mouse was initially placed in the center of the bright compartment and allowed to explore the two compartments freely for 5 min. The time spent in the caliginous compartment was recorded.
Self-grooming tests were performed to evaluate the stereotyped behaviors using the previously described methods [65]. The mouse was housed individually and habituated to the circumstances in the open field box. Self-grooming behaviors (elliptical strokes, small strokes, bilateral strokes, flank licks, and tail and genital licks) [66], were tracked for 10 min. The numbers and time of self-grooming of each mouse were recorded.
RNA isolation and sequencing
Total RNA was isolated from the mouse hippocampus using the Trizol reagent (Ambion, Shanghai, China). RNA purity and concentration were evaluated by using the Nanodrop ND-2000 spectrophotometer (Thermo Fisher Scientific, Waltham, MA, USA). RNA purity and integrity were checked by 1.5% agarose gel electrophoresis. RNA Integrity Number value > 7.0 was confirmed by using the Agilent 2100 Bioanalyzer (Agilent Technologies, Santa Clara, CA, USA).
Sequencing library was generated by using the TruSeq RNA preparation kit (Illumina, San Diego, CA, USA), following the manufacturer’s protocols. In Brief, the mRNA was purified by Oligo (dT) magnetic beads and fragmented into 200 bp short fragments. The complementary DNA (cDNA) was synthesized and purified. The concentration of cDNA was assessed by using the Qubit 2.0 (Thermo Fisher Scientific, Waltham, MA, USA), and the length of library fragments was determined by using the Agilent 2100 Bioanalyzer. Finally, sequencing was performed by using an Illumina HiSeq 2500 platform (Illumina, San Diego, CA, USA) and 125 bp paired-end reads were generated.
Quality assessment of raw RNA-seq data
The raw data derived from RNA-seq was analyzed by using the FastQC (version 0.11.8, Babraham Bioinformatics, Babraham Institute, Cambridge, UK). To obtain the high-quality clean reads for subsequent analysis, the low-quality reads including the adaptor sequences, sequences with quality score of < 20, and reads with > 5% ambiguous bases (N bases) were removed from the sequencing data by using the Cutadapt v2.3 [67]. The raw data was uploaded onto the National Center for Biotechnology Information (NCBI), with the accession number of PRJNA556843 (available at: https://dataview.ncbi.nlm.nih.gov/object/PRJNA556843).
Identification of DEGs
The clean reads from RNA-seq were aligned to mm10_UCSC genome by using the STAR tool [68]. Reads Per Kb per Million reads (RPKM) was used for the normalization and calculation of gene expression, and the DESeq2 algorithm (http://bioconductor.org/packages/DESeq2/) was applied to filter the DEGs [69]. The raw p-value was adjusted to false discovery rate (FDR), and FDR < 0.05 was considered as the cut-off criteria for DEGs screening [70]. To get an inclusive set of DEGs, we did not apply a fold change threshold for DEGs screening [71–74]. To overview the characteristics of gene expression profiles, volcano plots and heatmaps were generated by using the R package.
Functional annotation of DEGs
GO analysis was performed to evaluate the functional enrichment of DEGs in the biological process, cellular component, and molecular function [75]. The annotations were downloaded from NCBI (www.ncbi.nlm.nih.gov/), UniProt (www.uniprot.org/), and Gene Ontology (www.geneontology.org/). A p-value < 0.05 was set as the threshold value. In addition, GO-Tree was constructed based on the significant GO-terms of DEGs. The GO-Tree is a directed acyclic graph, showing the relationships of GO-terms [76].
Kyoto Encyclopedia of Genes and Genomes (KEGG) pathway analysis was performed to analyze the enriched signaling pathways of DEGs based on the KEGG database (www.genome.jp/kegg/) [77]. A p-value < 0.05 was set as the threshold value. In addition to gene annotation in signaling pathways, the upstream and downstream relationships of the enriched pathways were shown by pathway network analysis.
Protein-protein interaction network integration
The interactions among the proteins translated from the DEGs were analyzed by using the STRING database (version 10.5; www.string-db.org/), and the PPI network was visualized by using the Cytoscape software (www.cytoscape.org/) [78]. The proteins in the central node (hub proteins) may be the key proteins or genes that play an important role in regulating the physiological functions.
qPCR
RNA was extracted from the mouse hippocampus (n = 4 for each group), and cDNA was synthesized using a reverse transcription kit (Transgen Biotech, Beijing, China). qPCR was carried out with the SYBR Green MasterMix in a 20 μL reaction volume by using the 7500 Fast Real-Time PCR System (Applied Biosystems, Bedford, MA, USA). Primers specific to the top 20 up- and down-regulated DEGs were synthesized by the Sangon Biotech (Shanghai, China), as shown in Supplementary Table 1. GAPDH was used as an internal control. Cycle threshold (Ct) value of a gene was obtained, and gene abundance was determined by using the 2−ΔΔCt method.
Statistical analysis
Data obtained from blood gas analysis, behavioral studies, and qPCR were checked for normal distribution and presented as mean ± standard error of the mean (SEM). Data were analyzed using the unpaired student’s t test or two-way analysis of variance (ANOVA) with repeated measurement followed by Bonferroni’s post hoc test as appropriate. All analyses were performed by using the GraphPad Prism 7.0 (San Diego, CA, USA). A two-tailed p-value < 0.05 indicates a statistically significant difference.
Supplementary Materials
Conflicts of Interest
The authors have no conflicts of interest.
Funding
This study was supported by National Natural Science Foundation of China (81601659 to KP, 81873925 and 81671880 to FHJ, 81601666 to JZ, and 81701098 to XWM), Jiangsu Provincial Medical Youth Talents Program (QNRC2016741 to KP), Jiangsu Provincial Medical Innovation Team (CXTDA2017043 to FHJ), and Suzhou Key Disease Program (LCZX201603 to FHJ).
References
- 1. Shi Y, Hu D, Rodgers EL, Katusic SK, Gleich SJ, Hanson AC, Schroeder DR, Flick RP, Warner DO. Epidemiology of general anesthesia prior to age 3 in a population-based birth cohort. Paediatr Anaesth. 2018; 28:513–19. https://doi.org/10.1111/pan.13359 [PubMed]
- 2. Vinson AE, Houck CS. Neurotoxicity of Anesthesia in Children: prevention and Treatment. Curr Treat Options Neurol. 2018; 20:51. https://doi.org/10.1007/s11940-018-0536-z [PubMed]
- 3. Kain ZN, Mayes LC, Caldwell-Andrews AA, Karas DE, McClain BC. Preoperative anxiety, postoperative pain, and behavioral recovery in young children undergoing surgery. Pediatrics. 2006; 118:651–58. https://doi.org/10.1542/peds.2005-2920 [PubMed]
- 4. Wilder RT, Flick RP, Sprung J, Katusic SK, Barbaresi WJ, Mickelson C, Gleich SJ, Schroeder DR, Weaver AL, Warner DO. Early exposure to anesthesia and learning disabilities in a population-based birth cohort. Anesthesiology. 2009; 110:796–804. https://doi.org/10.1097/01.anes.0000344728.34332.5d [PubMed]
- 5. Sun L. Early childhood general anaesthesia exposure and neurocognitive development. Br J Anaesth. 2010 (Suppl 1); 105:i61–68. https://doi.org/10.1093/bja/aeq302 [PubMed]
- 6. Vutskits L, Xie Z. Lasting impact of general anaesthesia on the brain: mechanisms and relevance. Nat Rev Neurosci. 2016; 17:705–17. https://doi.org/10.1038/nrn.2016.128 [PubMed]
- 7. Glatz P, Sandin RH, Pedersen NL, Bonamy AK, Eriksson LI, Granath F. Association of Anesthesia and Surgery During Childhood With Long-term Academic Performance. JAMA Pediatr. 2017; 171:e163470. https://doi.org/10.1001/jamapediatrics.2016.3470 [PubMed]
- 8. Davidson AJ, Disma N, de Graaff JC, Withington DE, Dorris L, Bell G, Stargatt R, Bellinger DC, Schuster T, Arnup SJ, Hardy P, Hunt RW, Takagi MJ, et al, and GAS consortium. Neurodevelopmental outcome at 2 years of age after general anaesthesia and awake-regional anaesthesia in infancy (GAS): an international multicentre, randomised controlled trial. Lancet. 2016; 387:239–50. https://doi.org/10.1016/S0140-6736(15)00608-X [PubMed]
- 9. Sun LS, Li G, Miller TL, Salorio C, Byrne MW, Bellinger DC, Ing C, Park R, Radcliffe J, Hays SR, DiMaggio CJ, Cooper TJ, Rauh V, et al. Association Between a Single General Anesthesia Exposure Before Age 36 Months and Neurocognitive Outcomes in Later Childhood. JAMA. 2016; 315:2312–20. https://doi.org/10.1001/jama.2016.6967 [PubMed]
- 10. McCann ME, de Graaff JC, Dorris L, Disma N, Withington D, Bell G, Grobler A, Stargatt R, Hunt RW, Sheppard SJ, Marmor J, Giribaldi G, Bellinger DC, et al, and GAS Consortium. Neurodevelopmental outcome at 5 years of age after general anaesthesia or awake-regional anaesthesia in infancy (GAS): an international, multicentre, randomised, controlled equivalence trial. Lancet. 2019; 393:664–77. https://doi.org/10.1016/S0140-6736(18)32485-1 [PubMed]
- 11. Warner DO, Zaccariello MJ, Katusic SK, Schroeder DR, Hanson AC, Schulte PJ, Buenvenida SL, Gleich SJ, Wilder RT, Sprung J, Hu D, Voigt RG, Paule MG, et al. Neuropsychological and Behavioral Outcomes after Exposure of Young Children to Procedures Requiring General Anesthesia: The Mayo Anesthesia Safety in Kids (MASK) Study. Anesthesiology. 2018; 129:89–105. https://doi.org/10.1097/ALN.0000000000002232 [PubMed]
- 12. Lu H, Liufu N, Dong Y, Xu G, Zhang Y, Shu L, Soriano SG, Zheng H, Yu B, Xie Z. Sevoflurane Acts on Ubiquitination-Proteasome Pathway to Reduce Postsynaptic Density 95 Protein Levels in Young Mice. Anesthesiology. 2017; 127:961–75. https://doi.org/10.1097/ALN.0000000000001889 [PubMed]
- 13. Lei X, Guo Q, Zhang J. Mechanistic insights into neurotoxicity induced by anesthetics in the developing brain. Int J Mol Sci. 2012; 13:6772–99. https://doi.org/10.3390/ijms13066772 [PubMed]
- 14. Jevtovic-Todorovic V, Hartman RE, Izumi Y, Benshoff ND, Dikranian K, Zorumski CF, Olney JW, Wozniak DF. Early exposure to common anesthetic agents causes widespread neurodegeneration in the developing rat brain and persistent learning deficits. J Neurosci. 2003; 23:876–82. https://doi.org/10.1523/JNEUROSCI.23-03-00876.2003 [PubMed]
- 15. Hofacer RD, Deng M, Ward CG, Joseph B, Hughes EA, Jiang C, Danzer SC, Loepke AW. Cell age-specific vulnerability of neurons to anesthetic toxicity. Ann Neurol. 2013; 73:695–704. https://doi.org/10.1002/ana.23892 [PubMed]
- 16. Yu D, Liu B. Developmental anesthetic neurotoxicity: from animals to humans? J Anesth. 2013; 27:750–56. https://doi.org/10.1007/s00540-013-1609-5 [PubMed]
- 17. Wang X, Dong Y, Zhang Y, Li T, Xie Z. Sevoflurane induces cognitive impairment in young mice via autophagy. PLoS One. 2019; 14:e0216372. https://doi.org/10.1371/journal.pone.0216372 [PubMed]
- 18. Gibert S, Sabourdin N, Louvet N, Moutard ML, Piat V, Guye ML, Rigouzzo A, Constant I. Epileptogenic effect of sevoflurane: determination of the minimal alveolar concentration of sevoflurane associated with major epileptoid signs in children. Anesthesiology. 2012; 117:1253–61. https://doi.org/10.1097/ALN.0b013e318273e272 [PubMed]
- 19. Ji MH, Wang ZY, Sun XR, Tang H, Zhang H, Jia M, Qiu LL, Zhang GF, Peng YG, Yang JJ. Repeated Neonatal Sevoflurane Exposure-Induced Developmental Delays of Parvalbumin Interneurons and Cognitive Impairments Are Reversed by Environmental Enrichment. Mol Neurobiol. 2017; 54:3759–70. https://doi.org/10.1007/s12035-016-9943-x [PubMed]
- 20. Xu G, Lu H, Dong Y, Shapoval D, Soriano SG, Liu X, Zhang Y, Xie Z. Coenzyme Q10 reduces sevoflurane-induced cognitive deficiency in young mice. Br J Anaesth. 2017; 119:481–91. https://doi.org/10.1093/bja/aex071 [PubMed]
- 21. Liu G, Zhu T, Zhang A, Li F, Qian W, Qian B. Heightened stress response and cognitive impairment after repeated neonatal sevoflurane exposures might be linked to excessive GABAAR-mediated depolarization. J Anesth. 2016; 30:834–41. https://doi.org/10.1007/s00540-016-2215-0 [PubMed]
- 22. Neves G, Cooke SF, Bliss TV. Synaptic plasticity, memory and the hippocampus: a neural network approach to causality. Nat Rev Neurosci. 2008; 9:65–75. https://doi.org/10.1038/nrn2303 [PubMed]
- 23. Epstein RA, Patai EZ, Julian JB, Spiers HJ. The cognitive map in humans: spatial navigation and beyond. Nat Neurosci. 2017; 20:1504–13. https://doi.org/10.1038/nn.4656 [PubMed]
- 24. Pastalkova E, Serrano P, Pinkhasova D, Wallace E, Fenton AA, Sacktor TC. Storage of spatial information by the maintenance mechanism of LTP. Science. 2006; 313:1141–44. https://doi.org/10.1126/science.1128657 [PubMed]
- 25. Tsien JZ, Huerta PT, Tonegawa S. The essential role of hippocampal CA1 NMDA receptor-dependent synaptic plasticity in spatial memory. Cell. 1996; 87:1327–38. https://doi.org/10.1016/S0092-8674(00)81827-9 [PubMed]
- 26. Morrison JH, Baxter MG. The ageing cortical synapse: hallmarks and implications for cognitive decline. Nat Rev Neurosci. 2012; 13:240–50. https://doi.org/10.1038/nrn3200 [PubMed]
- 27. Kolosova NG, Vitovtov AO, Muraleva NA, Akulov AE, Stefanova NA, Blagosklonny MV. Rapamycin suppresses brain aging in senescence-accelerated OXYS rats. Aging (Albany NY). 2013; 5:474–84. https://doi.org/10.18632/aging.100573 [PubMed]
- 28. Ing C, DiMaggio C, Whitehouse A, Hegarty MK, Brady J, von Ungern-Sternberg BS, Davidson A, Wood AJ, Li G, Sun LS. Long-term differences in language and cognitive function after childhood exposure to anesthesia. Pediatrics. 2012; 130:e476–85. https://doi.org/10.1542/peds.2011-3822 [PubMed]
- 29. Li Y, Liu C, Zhao Y, Hu K, Zhang J, Zeng M, Luo T, Jiang W, Wang H. Sevoflurane induces short-term changes in proteins in the cerebral cortices of developing rats. Acta Anaesthesiol Scand. 2013; 57:380–90. https://doi.org/10.1111/aas.12018 [PubMed]
- 30. Zhou X, Song FH, He W, Yang XY, Zhou ZB, Feng X, Zhou LH. Neonatal exposure to sevoflurane causes apoptosis and reduces nNOS protein expression in rat hippocampus. Mol Med Rep. 2012; 6:543–46. https://doi.org/10.3892/mmr.2012.976 [PubMed]
- 31. Satomoto M, Satoh Y, Terui K, Miyao H, Takishima K, Ito M, Imaki J. Neonatal exposure to sevoflurane induces abnormal social behaviors and deficits in fear conditioning in mice. Anesthesiology. 2009; 110:628–37. https://doi.org/10.1097/ALN.0b013e3181974fa2 [PubMed]
- 32. Lu Y, Wu X, Dong Y, Xu Z, Zhang Y, Xie Z. Anesthetic sevoflurane causes neurotoxicity differently in neonatal naïve and Alzheimer disease transgenic mice. Anesthesiology. 2010; 112:1404–16. https://doi.org/10.1097/ALN.0b013e3181d94de1 [PubMed]
- 33. D’Hooge R, De Deyn PP. Applications of the Morris water maze in the study of learning and memory. Brain Res Brain Res Rev. 2001; 36:60–90. https://doi.org/10.1016/S0165-0173(01)00067-4 [PubMed]
- 34. Yu Y, Zhang P, Yan J, Sun Y, Wu X, Xi S, Zhang L, Sun Y, Hu R, Jiang H. Sevoflurane induces cognitive impairments via the MiR-27b/LIMK1-signaling pathway in developing rats. Inhal Toxicol. 2016; 28:731–38. https://doi.org/10.1080/08958378.2016.1266532 [PubMed]
- 35. Satomoto M, Sun Z, Adachi YU, Makita K. Neonatal Sevoflurane Exposure Induces Adulthood Fear-induced Learning Disability and Decreases Glutamatergic Neurons in the Basolateral Amygdala. J Neurosurg Anesthesiol. 2018; 30:59–64. https://doi.org/10.1097/ana.0000000000000387 [PubMed]
- 36. Chung W, Park S, Hong J, Park S, Lee S, Heo J, Kim D, Ko Y. Sevoflurane exposure during the neonatal period induces long-term memory impairment but not autism-like behaviors. Paediatr Anaesth. 2015; 25:1033–45. https://doi.org/10.1111/pan.12694 [PubMed]
- 37. Zhao X, Jin Y, Li H, Jia Y, Wang Y. Sevoflurane impairs learning and memory of the developing brain through post-transcriptional inhibition of CCNA2 via microRNA-19-3p. Aging (Albany NY). 2018; 10:3794–805. https://doi.org/10.18632/aging.101673 [PubMed]
- 38. Ando N, Sugasawa Y, Inoue R, Aosaki T, Miura M, Nishimura K. Effects of the volatile anesthetic sevoflurane on tonic GABA currents in the mouse striatum during postnatal development. Eur J Neurosci. 2014; 40:3147–57. https://doi.org/10.1111/ejn.12691 [PubMed]
- 39. Li T, Huang Z, Wang X, Zou J, Tan S. Role of the GABAA receptors in the long-term cognitive impairments caused by neonatal sevoflurane exposure. Rev Neurosci. 2019. [Epub ahead of print]. https://doi.org/10.1515/revneuro-2019-0003 [PubMed]
- 40. Wang WY, Jia LJ, Luo Y, Zhang HH, Cai F, Mao H, Xu WC, Fang JB, Peng ZY, Ma ZW, Chen YH, Zhang J, Wei Z, et al. Location- and Subunit-Specific NMDA Receptors Determine the Developmental Sevoflurane Neurotoxicity Through ERK1/2 Signaling. Mol Neurobiol. 2016; 53:216–30. https://doi.org/10.1007/s12035-014-9005-1 [PubMed]
- 41. Zhang X, Shen F, Xu D, Zhao X. A lasting effect of postnatal sevoflurane anesthesia on the composition of NMDA receptor subunits in rat prefrontal cortex. Int J Dev Neurosci. 2016; 54:62–69. https://doi.org/10.1016/j.ijdevneu.2016.01.008 [PubMed]
- 42. Xia Y, Xu H, Jia C, Hu X, Kang Y, Yang X, Xue Q, Tao G, Yu B. Tanshinone IIA Attenuates Sevoflurane Neurotoxicity in Neonatal Mice. Anesth Analg. 2017; 124:1244–52. https://doi.org/10.1213/ANE.0000000000001942 [PubMed]
- 43. Perez-Zoghbi JF, Zhu W, Grafe MR, Brambrink AM. Dexmedetomidine-mediated neuroprotection against sevoflurane-induced neurotoxicity extends to several brain regions in neonatal rats. Br J Anaesth. 2017; 119:506–16. https://doi.org/10.1093/bja/aex222 [PubMed]
- 44. Bi C, Cai Q, Shan Y, Yang F, Sun S, Wu X, Liu H. Sevoflurane induces neurotoxicity in the developing rat hippocampus by upregulating connexin 43 via the JNK/c-Jun/AP-1 pathway. Biomed Pharmacother. 2018; 108:1469–1476. https://doi.org/10.1016/j.biopha.2018.09.111 [PubMed]
- 45. Stock L, Hosoume J, Cirqueira L, Treptow W. Binding of the general anesthetic sevoflurane to ion channels. PLOS Comput Biol. 2018; 14:e1006605. https://doi.org/10.1371/journal.pcbi.1006605 [PubMed]
- 46. Woll KA, Peng W, Liang Q, Zhi L, Jacobs JA, Maciunas L, Bhanu N, Garcia BA, Covarrubias M, Loll PJ, Dailey WP, Eckenhoff RG. Photoaffinity Ligand for the Inhalational Anesthetic Sevoflurane Allows Mechanistic Insight into Potassium Channel Modulation. ACS Chem Biol. 2017; 12:1353–62. https://doi.org/10.1021/acschembio.7b00222 [PubMed]
- 47. Liu Y, Yang H, Tang X, Bai W, Wang G, Tian X. Repetitive transcranial magnetic stimulation regulates L-type Ca(2+) channel activity inhibited by early sevoflurane exposure. Brain Res. 2016; 1646:207–18. https://doi.org/10.1016/j.brainres.2016.05.045 [PubMed]
- 48. Barber AF, Carnevale V, Klein ML, Eckenhoff RG, Covarrubias M. Modulation of a voltage-gated Na+ channel by sevoflurane involves multiple sites and distinct mechanisms. Proc Natl Acad Sci USA. 2014; 111:6726–31. https://doi.org/10.1073/pnas.1405768111 [PubMed]
- 49. Liu B, Gu Y, Xiao H, Lei X, Liang W, Zhang J. Altered metabolomic profiles may be associated with sevoflurane-induced neurotoxicity in neonatal rats. Neurochem Res. 2015; 40:788–99. https://doi.org/10.1007/s11064-015-1529-x [PubMed]
- 50. Zheng SQ, An LX, Cheng X, Wang YJ. Sevoflurane causes neuronal apoptosis and adaptability changes of neonatal rats. Acta Anaesthesiol Scand. 2013; 57:1167–74. https://doi.org/10.1111/aas.12163 [PubMed]
- 51. Siu MT, Weksberg R. Epigenetics of Autism Spectrum Disorder. Adv Exp Med Biol. 2017; 978:63–90. https://doi.org/10.1007/978-3-319-53889-1_4 [PubMed]
- 52. Zhou ZB, Yang XY, Yuan BL, Niu LJ, Zhou X, Huang WQ, Feng X, Zhou LH. Sevoflurane-induced down-regulation of hippocampal oxytocin and arginine vasopressin impairs juvenile social behavioral abilities. J Mol Neurosci. 2015; 56:70–77. https://doi.org/10.1007/s12031-014-0468-3 [PubMed]
- 53. Lin D, Liu J, Kramberg L, Ruggiero A, Cottrell J, Kass IS. Early-life single-episode sevoflurane exposure impairs social behavior and cognition later in life. Brain Behav. 2016; 6:e00514. https://doi.org/10.1002/brb3.514 [PubMed]
- 54. Lee S, Chung W, Park H, Park H, Yoon S, Park S, Park J, Heo JY, Ju X, Yoon SH, Kim YH, Ko Y. Single and multiple sevoflurane exposures during pregnancy and offspring behavior in mice. Paediatr Anaesth. 2017; 27:742–51. https://doi.org/10.1111/pan.13139 [PubMed]
- 55. Zhang L, Xue Z, Liu Q, Liu Y, Xi S, Cheng Y, Li J, Yan J, Shen Y, Xiao C, Xie Z, Qiu Z, Jiang H. Disrupted folate metabolism with anesthesia leads to myelination deficits mediated by epigenetic regulation of ERMN. EBioMedicine. 2019; 43:473–86. https://doi.org/10.1016/j.ebiom.2019.04.048 [PubMed]
- 56. Raam T, McAvoy KM, Besnard A, Veenema AH, Sahay A. Hippocampal oxytocin receptors are necessary for discrimination of social stimuli. Nat Commun. 2017; 8:2001. https://doi.org/10.1038/s41467-017-02173-0 [PubMed]
- 57. Li X, Wu Z, Zhang Y, Xu Y, Han G, Zhao P. Activation of Autophagy Contributes to Sevoflurane-Induced Neurotoxicity in Fetal Rats. Front Mol Neurosci. 2017; 10:432. https://doi.org/10.3389/fnmol.2017.00432 [PubMed]
- 58. Cole PD, Finkelstein Y, Stevenson KE, Blonquist TM, Vijayanathan V, Silverman LB, Neuberg DS, Sallan SE, Robaey P, Waber DP. Polymorphisms in Genes Related to Oxidative Stress Are Associated With Inferior Cognitive Function After Therapy for Childhood Acute Lymphoblastic Leukemia. J Clin Oncol. 2015; 33:2205–11. https://doi.org/10.1200/JCO.2014.59.0273 [PubMed]
- 59. Su F, Shu H, Ye Q, Wang Z, Xie C, Yuan B, Zhang Z, Bai F. Brain insulin resistance deteriorates cognition by altering the topological features of brain networks. Neuroimage Clin. 2016; 13:280–87. https://doi.org/10.1016/j.nicl.2016.12.009 [PubMed]
- 60. Zhong JY, Magnusson KR, Swarts ME, Clendinen CA, Reynolds NC, Moffat SD. The application of a rodent-based Morris water maze (MWM) protocol to an investigation of age-related differences in human spatial learning. Behav Neurosci. 2017; 131:470–82. https://doi.org/10.1037/bne0000219 [PubMed]
- 61. Moy SS, Nadler JJ, Perez A, Barbaro RP, Johns JM, Magnuson TR, Piven J, Crawley JN. Sociability and preference for social novelty in five inbred strains: an approach to assess autistic-like behavior in mice. Genes Brain Behav. 2004; 3:287–302. https://doi.org/10.1111/j.1601-1848.2004.00076.x [PubMed]
- 62. Justel N, Psyrdellis M, Pautassi RM. Open-field exposure facilitates consummatory extinction. Neuroreport. 2016; 27:1281–86. https://doi.org/10.1097/WNR.0000000000000693 [PubMed]
- 63. Selakovic D, Joksimovic J, Obradovic D, Milovanovic D, Djuric M, Rosic G. The adverse effects of exercise and supraphysiological dose of testosterone-enanthate (TE) on exploratory activity in elevated plus maze (EPM) test - indications for using total exploratory activity (TEA) as a new parameter for ex. Neuro Endocrinol Lett. 2016; 37:383–88. [PubMed]
- 64. Acevedo MB, Nizhnikov ME, Molina JC, Pautassi RM. Relationship between ethanol-induced activity and anxiolysis in the open field, elevated plus maze, light-dark box, and ethanol intake in adolescent rats. Behav Brain Res. 2014; 265:203–15. https://doi.org/10.1016/j.bbr.2014.02.032 [PubMed]
- 65. Kalueff AV, Stewart AM, Song C, Berridge KC, Graybiel AM, Fentress JC. Neurobiology of rodent self-grooming and its value for translational neuroscience. Nat Rev Neurosci. 2016; 17:45–59. https://doi.org/10.1038/nrn.2015.8 [PubMed]
- 66. van den Boom BJ, Pavlidi P, Wolf CJ, Mooij AH, Willuhn I. Automated classification of self-grooming in mice using open-source software. J Neurosci Methods. 2017; 289:48–56. https://doi.org/10.1016/j.jneumeth.2017.05.026 [PubMed]
- 67. Martin M. Cutadapt removes adapter sequences from high-throughput sequencing reads. EMBnet.journal. 2011; 17:10–12. https://doi.org/10.14806/ej.17.1.200
- 68. Dobin A, Davis CA, Schlesinger F, Drenkow J, Zaleski C, Jha S, Batut P, Chaisson M, Gingeras TR. STAR: ultrafast universal RNA-seq aligner. Bioinformatics. 2013; 29:15–21. https://doi.org/10.1093/bioinformatics/bts635 [PubMed]
- 69. Love MI, Huber W, Anders S. Moderated estimation of fold change and dispersion for RNA-seq data with DESeq2. Genome Biol. 2014; 15:550. https://doi.org/10.1186/s13059-014-0550-8 [PubMed]
- 70. Reiner A, Yekutieli D, Benjamini Y. Identifying differentially expressed genes using false discovery rate controlling procedures. Bioinformatics. 2003; 19:368–75. https://doi.org/10.1093/bioinformatics/btf877 [PubMed]
- 71. Kolbe AR, Studer AJ, Cornejo OE, Cousins AB. Insights from transcriptome profiling on the non-photosynthetic and stomatal signaling response of maize carbonic anhydrase mutants to low CO2. BMC Genomics. 2019; 20:138. https://doi.org/10.1186/s12864-019-5522-7 [PubMed]
- 72. McDonough JE, Kaminski N, Thienpont B, Hogg JC, Vanaudenaerde BM, Wuyts WA. Gene correlation network analysis to identify regulatory factors in idiopathic pulmonary fibrosis. Thorax. 2019; 74:132–40. https://doi.org/10.1136/thoraxjnl-2018-211929 [PubMed]
- 73. Sekii K, Yorimoto S, Okamoto H, Nagao N, Maezawa T, Matsui Y, Yamaguchi K, Furukawa R, Shigenobu S, Kobayashi K. Transcriptomic analysis reveals differences in the regulation of amino acid metabolism in asexual and sexual planarians. Sci Rep. 2019; 9:6132. https://doi.org/10.1038/s41598-019-42025-z [PubMed]
- 74. Wade AA, Lim K, Catta-Preta R, Nord AS. Common CHD8 Genomic Targets Contrast With Model-Specific Transcriptional Impacts of CHD8 Haploinsufficiency. Front Mol Neurosci. 2019; 11:481. https://doi.org/10.3389/fnmol.2018.00481 [PubMed]
- 75. Ashburner M, Ball CA, Blake JA, Botstein D, Butler H, Cherry JM, Davis AP, Dolinski K, Dwight SS, Eppig JT, Harris MA, Hill DP, Issel-Tarver L, et al, and The Gene Ontology Consortium. Gene ontology: tool for the unification of biology. Nat Genet. 2000; 25:25–29. https://doi.org/10.1038/75556 [PubMed]
- 76. Zhang B, Schmoyer D, Kirov S, Snoddy J. GOTree Machine (GOTM): a web-based platform for interpreting sets of interesting genes using Gene Ontology hierarchies. BMC Bioinformatics. 2004; 5:16. https://doi.org/10.1186/1471-2105-5-16 [PubMed]
- 77. Draghici S, Khatri P, Tarca AL, Amin K, Done A, Voichita C, Georgescu C, Romero R. A systems biology approach for pathway level analysis. Genome Res. 2007; 17:1537–45. https://doi.org/10.1101/gr.6202607 [PubMed]
- 78. Sriroopreddy R, Sajeed R, P R, C S. Differentially expressed gene (DEG) based protein-protein interaction (PPI) network identifies a spectrum of gene interactome, transcriptome and correlated miRNA in nondisjunction Down syndrome. Int J Biol Macromol. 2019; 122:1080–89. https://doi.org/10.1016/j.ijbiomac.2018.09.056 [PubMed]