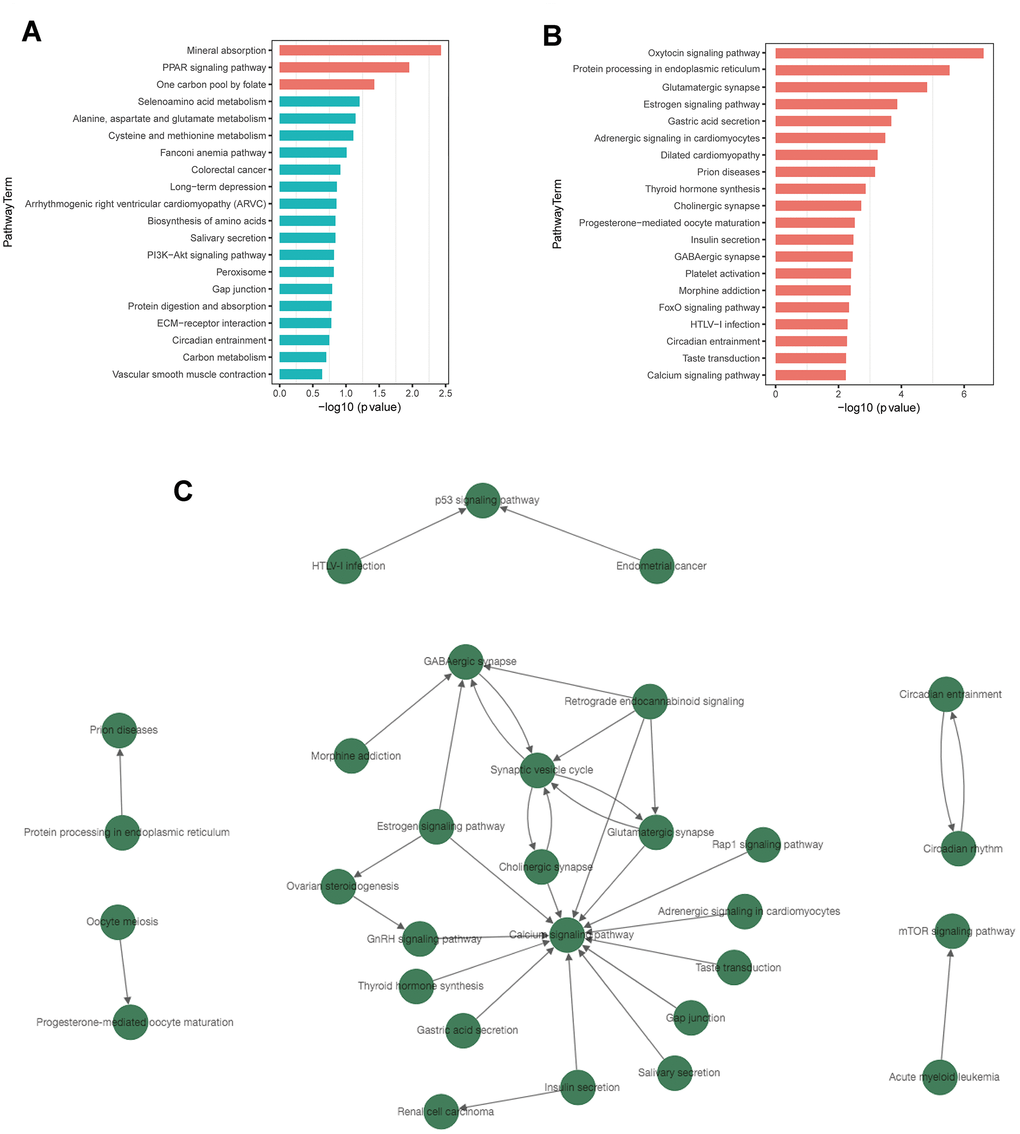
Figure 5.KEGG pathway enrichment and pathway-tree analysis. (A) Top 20 enriched pathways of up-regulated DEGs. (B) Top 20 enriched pathways of down-regulated DEGs. (C) Pathway-tree analysis showing relationship between pathway terms. Arrow source, an upstream signal pathway; arrow target, a downstream signaling pathway. Blue columns indicate pathways without significant difference.