


Introduction
The klotho family protein klotho beta (KLB) is a single transmembrane protein that serves as a co-receptor with fibroblast growth factor receptor (FGFR) [1]. By mediating FGF21 binding to FGFR, KLB plays key roles in the regulation of metabolism [2]. Under fasting and some stress conditions, expression of FGF21 rises in the liver, adipose tissue, pancreas and brain [3, 4], where signaling via the FGF21-KLB-FGFR1 complex exerts effects impacting multiple metabolic systems [5].
Obesity and non-alcoholic fatty liver disease (NAFLD) are two crucial health problems worldwide. NAFLD is now thought to be a hepatic manifestation of metabolic syndrome caused by an underlying disorder of energy utilization and storage [6]. Normally, FGF21 mediates energy expenditure that causes weight loss and a reduction in hepatic lipidosis [7]. But in obesity patients, the serum FGF21 levels are elevated. It has therefore been hypothesized that obesity leads to a FGF21-resistant state. In mice, moreover, decreased KLB expression appears to result in FGF21 resistance [8]. This suggests FGF21-KLB-FGFR signaling may be involved in the pathogenesis of NAFLD.
The development of hepatic steatosis involves the interaction of genetic and environmental factors [6]. Several studies suggest that genetic variants of FGF21 associate with nutrient intake and metabolism [9, 10]. Studies in obese mice verified that KLB expression is associated with lipid homeostasis and FGF21 resistance [8, 11, 12]. In that regard, little has been reported about the correlation between FGF21 gene polymorphisms and NAFLD, and there have been no reports on the relationship between KLB gene polymorphism and NAFLD. We hypothesized that single nucleotide polymorphisms (SNPs) in FGF21, KLB and FGFR are involved in hepatic lipid accumulation and the pathogenesis of NAFLD.
Results
Study population
Among the 1688 participants, the frequencies of NAFLD and obesity were 32.29% and 37.44%, respectively. Comparison of the clinical and biochemical characteristics of the subjects revealed no significant difference between the NAFLD and non-NAFLD groups (Table 2). By contrast, the baseline characteristics of the obese and non-obese groups differed significantly (Table 3). Compared to the non-obese group, subjects in obese group were older and had a higher male-to-female ratio; higher fasting glucose and serum lipid levels; and higher alanine aminotransferase (ALT), aspartate aminotransferase (AST), and gamma-glutamyltransferase (γ-GT) levels. All samples were successfully genotyped for SNPs.
Quality control of candidate SNPs
The positions of all the SNPs analyzed are listed in Table 1. Of those, two, rs838133 (FGF21) and rs2071616 (FGFR2), which had minor allele frequencies (MAFs) < 10% were eliminated. The loss frequency for the genotyping was less than 0.1%. Deviation of the SNPs from Hardy-Weinberg equilibrium (HWE) was tested in each population using Fisher’s exact test. The SNP rs7012413 (FGFR2) was the only one that deviated from HWE (P < 0.05); the allele frequencies of all other SNPs reached HWE. The genotypes and allele frequencies of the SNPs are listed in Table 4.
Table 1. Information on the SNPs and primers.
| Gene | Chr. | Position | SNP | EXT1-SEQ | EXT2-SEQ | ||||||||||||||||||||||||||||||||||||||||||||||||||||||||||||||||||||||||||||||||||||||||||||||
| KLB | 4 | 39441340 | rs7670903 | aaacAAAGACATTTTTGGAGCAC | aaacAAAGACATTTTTGGAGCAT | ||||||||||||||||||||||||||||||||||||||||||||||||||||||||||||||||||||||||||||||||||||||||||||||
| KLB | 4 | 39417789 | rs7674434 | GGTACCTGTAATATATTATCTCATG | GGTACCTGTAATATATTATCTCATT | ||||||||||||||||||||||||||||||||||||||||||||||||||||||||||||||||||||||||||||||||||||||||||||||
| KLB | 4 | 39420199 | rs12152703 | gGGATCTTTTAGTATTTGGGGG | gGGATCTTTTAGTATTTGGGGT | ||||||||||||||||||||||||||||||||||||||||||||||||||||||||||||||||||||||||||||||||||||||||||||||
| KLB | 4 | 39429811 | rs2608819 | TTGCCAAGTAACAAGGTAAAAAA | TTGCCAAGTAACAAGGTAAAAAG | ||||||||||||||||||||||||||||||||||||||||||||||||||||||||||||||||||||||||||||||||||||||||||||||
| FGF21 | 19 | 48763133 | rs499765 | TTGCAAAGGATTTGGGATC | TTGCAAAGGATTTGGGATG | ||||||||||||||||||||||||||||||||||||||||||||||||||||||||||||||||||||||||||||||||||||||||||||||
| FUT1 | 19 | 48753131 | rs838136 | cccaCTGGCAAACAGGTTCTCCA | cccaCTGGCAAACAGGTTCTCCG | ||||||||||||||||||||||||||||||||||||||||||||||||||||||||||||||||||||||||||||||||||||||||||||||
| FGFR1 | 8 | 38461831 | rs4733946 | CAAATGTAAAGAATTATGCATTTGG | CAAATGTAAAGAATTATGCATTTGT | ||||||||||||||||||||||||||||||||||||||||||||||||||||||||||||||||||||||||||||||||||||||||||||||
| FGFR2 | 10 | 121516577 | rs3135761 | TCTGCCTCTTTGTCATTTC | TCTGCCTCTTTGTCATTTT | ||||||||||||||||||||||||||||||||||||||||||||||||||||||||||||||||||||||||||||||||||||||||||||||
| SNP: single nucleotide polymorphism, Chr: chromosome, EXT1-SEQ: extention primer sequence of allele 1, EXT2-SEQ: extension primer sequence of allele 2. | |||||||||||||||||||||||||||||||||||||||||||||||||||||||||||||||||||||||||||||||||||||||||||||||||||
Table 2. General clinical characteristics of the NAFLD and non-NAFLD cohorts.
| Characteristic | NAFLD subjects (n=545) | Non-NAFLD controls (n=1143) | P | NAFLD subjects | Non-NAFLD controls | ||||||||||||||||||||||||||||||||||||||||||||||||||||||||||||||||||||||||||||||||||||||||||||||
| Obesity (n=202) | Non-obesity (n=343) | p | Obesity (n=382) | Non-obesity (n=761) | p | ||||||||||||||||||||||||||||||||||||||||||||||||||||||||||||||||||||||||||||||||||||||||||||||
| Age, years | 42.39±12.60 | 42.22±12.52 | 0.862 | 44.76±31.13 | 40.35±11.87 | <0.001 | 44.83±12.96 | 40.83±12.19 | <0.001 | ||||||||||||||||||||||||||||||||||||||||||||||||||||||||||||||||||||||||||||||||||||||||||
| Male/female | 218/327 | 487/656 | 0.297 | 106/96 | 127/216 | <0.001 | 223/159 | 256/505 | <0.001 | ||||||||||||||||||||||||||||||||||||||||||||||||||||||||||||||||||||||||||||||||||||||||||
| BMI, kg/m2 | 24.11±3.51 | 23.99±3.33 | 0.548 | 27.56±2.49 | 21.97±2.01 | <0.001 | 27.56±2.35 | 22.12±1.97 | <0.001 | ||||||||||||||||||||||||||||||||||||||||||||||||||||||||||||||||||||||||||||||||||||||||||
| ALT, U/L | 23.78±17.59 | 23.67±25.52 | 0.261 | 31.34±22.65 | 19.23±11.82 | <0.001 | 31.01±36.84 | 19.97±16.26 | <0.001 | ||||||||||||||||||||||||||||||||||||||||||||||||||||||||||||||||||||||||||||||||||||||||||
| AST, U/L | 25.18±14.51 | 21.25±9.72 | 0.437 | 35.39±11.68 | 20.54±5.99 | <0.001 | 25.06±15.81 | 21.56±10.97 | <0.001 | ||||||||||||||||||||||||||||||||||||||||||||||||||||||||||||||||||||||||||||||||||||||||||
| γ-GT, U/L | 24.95±20.91 | 25.46±27.33 | 0.502 | 31.79±23.68 | 20.54±17.49 | <0.001 | 35.46±36.72 | 20.48±19.48 | <0.001 | ||||||||||||||||||||||||||||||||||||||||||||||||||||||||||||||||||||||||||||||||||||||||||
| Serum triglyceride, mmol/L | 1.39±1.11 | 1.31±1.03 | 0.639 | 1.74±1.29 | 1.68±0.91 | <0.001 | 1.68±1.43 | 1.13±0.68 | <0.001 | ||||||||||||||||||||||||||||||||||||||||||||||||||||||||||||||||||||||||||||||||||||||||||
| Serum total cholesterol, mmol/L | 4.90±1.01 | 4.87±1.00 | 0.951 | 5.05±1.06 | 4.81±0.98 | <0.001 | 6.52±1.48 | 4.80±0.93 | <0.001 | ||||||||||||||||||||||||||||||||||||||||||||||||||||||||||||||||||||||||||||||||||||||||||
| Serum LDL-C, mmol/L | 2.85±0.67 | 2.84±0.69 | 0.895 | 3.01±0.70 | 2.75±0.62 | <0.001 | 2.99±0.68 | 2.77<±0.66 | <0.001 | ||||||||||||||||||||||||||||||||||||||||||||||||||||||||||||||||||||||||||||||||||||||||||
| Fasting plasma glucose, mmol/L | 5.32±1.06 | 5.34±1.03 | 0.532 | 5.58±1.16 | 5.17±1.00 | <0.001 | 5.70±1.41 | 5.15±0.71 | <0.001 | ||||||||||||||||||||||||||||||||||||||||||||||||||||||||||||||||||||||||||||||||||||||||||
| Serum FGF21, pg/ml | 293.07±258.03 | 303.42±291.79 | 0.921 | 361.35±306.29 | 244.70±205.25 | <0.001 | 366.63±311.56 | 267.57±269.94 | 0.003 | ||||||||||||||||||||||||||||||||||||||||||||||||||||||||||||||||||||||||||||||||||||||||||
| Data are means±SD or counts. P: level of statistical significance with the Kruscal-Wallis non-parametric test. | |||||||||||||||||||||||||||||||||||||||||||||||||||||||||||||||||||||||||||||||||||||||||||||||||||
Table 3. General clinical characteristics of the obese and non-obese cohorts.
| Characteristic | Obese subjects (n=584) | Non-obese subjects (n=1104) | P | Obese subjects | Non-obese subjects | ||||||||||||||||||||||||||||||||||||||||||||||||||||||||||||||||||||||||||||||||||||||||||||||
| NAFLD (n=202) | Non-NAFLD (n=382) | P | NAFLD (n=343) | Non-NAFLD (n=761) | P | ||||||||||||||||||||||||||||||||||||||||||||||||||||||||||||||||||||||||||||||||||||||||||||||
| Age, years | 42.39±12.60 | 42.22±12.52 | <0.001 | 44.76±31.13 | 44.83±12.96 | 0.559 | 40.35±11.87 | 40.83±12.19 | 0.516 | ||||||||||||||||||||||||||||||||||||||||||||||||||||||||||||||||||||||||||||||||||||||||||
| Male/female | 218/327 | 487/656 | <0.001 | 106/96 | 223/159 | 0.142 | 127/216 | 256/505 | 0.554 | ||||||||||||||||||||||||||||||||||||||||||||||||||||||||||||||||||||||||||||||||||||||||||
| BMI, kg/m2 | 24.11±3.51 | 23.99±3.33 | <0.001 | 27.56±2.49 | 27.56±2.35 | 0.736 | 21.97±2.01 | 22.12±1.97 | 0.224 | ||||||||||||||||||||||||||||||||||||||||||||||||||||||||||||||||||||||||||||||||||||||||||
| ALT, U/L | 23.78±17.59 | 23.67±25.52 | <0.001 | 31.34±22.65 | 31.01±36.84 | 0.200 | 19.23±11.82 | 19.97±16.26 | 0.625 | ||||||||||||||||||||||||||||||||||||||||||||||||||||||||||||||||||||||||||||||||||||||||||
| AST, U/L | 25.18±14.51 | 21.25±9.72 | <0.001 | 35.39±11.68 | 25.06±15.81 | 0.052 | 20.54±5.99 | 21.56±10.97 | 0.296 | ||||||||||||||||||||||||||||||||||||||||||||||||||||||||||||||||||||||||||||||||||||||||||
| γ-GT, U/L | 24.95±20.91 | 25.46±27.33 | <0.001 | 31.79±23.68 | 35.46±36.72 | 0.635 | 20.54±17.49 | 20.48±19.48 | 0.933 | ||||||||||||||||||||||||||||||||||||||||||||||||||||||||||||||||||||||||||||||||||||||||||
| Serum triglyceride, mmol/L | 1.39±1.11 | 1.31±1.03 | <0.001 | 1.74±1.29 | 1.68±1.43 | 0.587 | 1.68±0.91 | 1.13±0.68 | 0.479 | ||||||||||||||||||||||||||||||||||||||||||||||||||||||||||||||||||||||||||||||||||||||||||
| Serum total cholesterol, mmol/L | 4.90±1.01 | 4.87±1.00 | <0.001 | 5.05±1.06 | 6.52±1.48 | 0.838 | 4.81±0.98 | 4.80±0.93 | 0.790 | ||||||||||||||||||||||||||||||||||||||||||||||||||||||||||||||||||||||||||||||||||||||||||
| Serum LDL-C, mmol/L | 2.85±0.67 | 2.84±0.69 | <0.001 | 3.01±0.70 | 2.99±0.68 | 0.895 | 2.75±0.62 | 2.77±0.66 | 0.608 | ||||||||||||||||||||||||||||||||||||||||||||||||||||||||||||||||||||||||||||||||||||||||||
| Fasting plasma glucose, mmol/L | 5.32±1.06 | 5.34±1.03 | <0.001 | 5.58±1.16 | 5.70±1.41 | 0.510 | 5.17±1.00 | 5.15±0.71 | 0.278 | ||||||||||||||||||||||||||||||||||||||||||||||||||||||||||||||||||||||||||||||||||||||||||
| Serum FGF21, pg/ml | 293.07±258.03 | 303.42±291.79 | <0.001 | 361.35±306.29 | 366.63±311.56 | 0.924 | 244.70±205.25 | 267.57±269.94 | 0.605 | ||||||||||||||||||||||||||||||||||||||||||||||||||||||||||||||||||||||||||||||||||||||||||
| Data are means±SD or counts. P: level of statistical significance with the Kruscal-Wallis non-parametric test. | |||||||||||||||||||||||||||||||||||||||||||||||||||||||||||||||||||||||||||||||||||||||||||||||||||
Table 4. Genotype and allele frequencies of the SNPs.
| Gene | SNP | Call rate (%) | Minor allele | Major allele | MAF cases | MAF controls | HWE controls | ||||||||||||||||||||||||||||||||||||||||||||||||||||||||||||||||||||||||||||||||||||||||||||
| KLB | rs7670903 | 99.4 | A | G | 0.52 | 0.49 | 0.35 | ||||||||||||||||||||||||||||||||||||||||||||||||||||||||||||||||||||||||||||||||||||||||||||
| KLB | rs7674434 | 99.6 | G | T | 0.13 | 0.12 | 0.56 | ||||||||||||||||||||||||||||||||||||||||||||||||||||||||||||||||||||||||||||||||||||||||||||
| KLB | rs12152703 | 99.4 | T | G | 0.13 | 0.12 | 0.43 | ||||||||||||||||||||||||||||||||||||||||||||||||||||||||||||||||||||||||||||||||||||||||||||
| KLB | rs2608819 | 99.2 | T | C | 0.18 | 0.16 | 0.11 | ||||||||||||||||||||||||||||||||||||||||||||||||||||||||||||||||||||||||||||||||||||||||||||
| FGF21 | rs499765 | 99.0 | G | C | 0.45 | 0.45 | 0.15 | ||||||||||||||||||||||||||||||||||||||||||||||||||||||||||||||||||||||||||||||||||||||||||||
| FUT1 | rs838136 | 99.8 | C | T | 0.37 | 0.36 | 0.27 | ||||||||||||||||||||||||||||||||||||||||||||||||||||||||||||||||||||||||||||||||||||||||||||
| FGFR1 | rs4733946 | 99.1 | T | G | 0.12 | 0.12 | 0.58 | ||||||||||||||||||||||||||||||||||||||||||||||||||||||||||||||||||||||||||||||||||||||||||||
| FGFR2 | rs3135761 | 99.2 | A | G | 0.48 | 0.48 | 0.33 | ||||||||||||||||||||||||||||||||||||||||||||||||||||||||||||||||||||||||||||||||||||||||||||
| Abbreviations: MAF: minor allele frequency, HWE: Hardy-Weinberg equilibrium test. | |||||||||||||||||||||||||||||||||||||||||||||||||||||||||||||||||||||||||||||||||||||||||||||||||||
Association between genotypes and obesity
The results of quantitative-traits association analyses adjusted for gender and age (Figure 1) indicated that SNP rs7670903 in KLB had a significant association with BMI (P = 0.0005) (Table 5). The minor A-allele of rs7670903 correlated with a higher BMI. When we compared the allele frequencies between the obese and non-obese groups using the dominant and additive model covariate adjusted association analyses (Table 6), the rs7670903 A-allele frequency was significantly higher in obese group than the non-obese group in both models (P = 0.003 and P = 0.011, respectively).
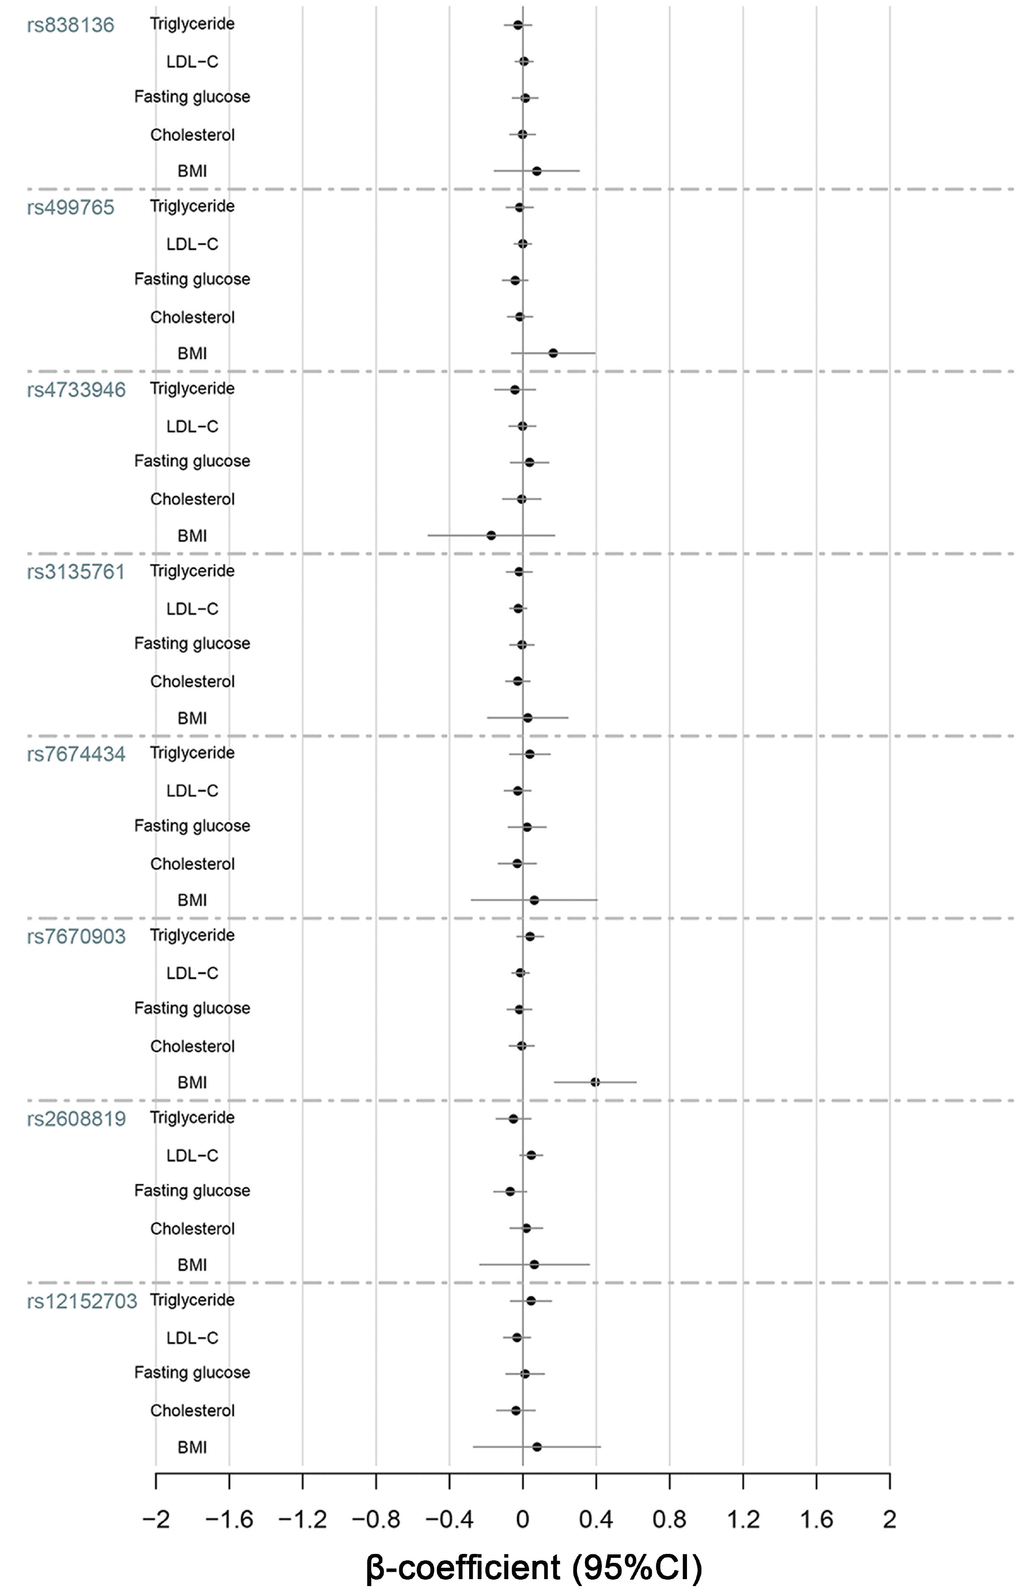
Figure 1. Quantitative-trait associations between triglycerides, LDL-C, fasting glucose, cholesterol and BMI and the alleles of KLB, FGFR1 and FGF21 were analyzed for all 1688 subjects using multiple linear regression adjusted for sex and age.
Table 5. Significant associations between SNPs and NAFLD phenotypes in a covariate adjusted linear regression analysis.
| Trait | Gene | SNP | Risk allele | β-coefficient | STAT | P | |||||||||||||||||||||||||||||||||||||||||||||||||||||||||||||||||||||||||||||||||||||||||||||
| BMI | KLB | rs7670903 | A | 0.40 | 3.49 | <0.001 | |||||||||||||||||||||||||||||||||||||||||||||||||||||||||||||||||||||||||||||||||||||||||||||
| ALT | KLB | rs7674434 | G | 2.59 | 2.17 | 0.030 | |||||||||||||||||||||||||||||||||||||||||||||||||||||||||||||||||||||||||||||||||||||||||||||
| rs12152703 | T | 2.47 | 2.04 | 0.041 | |||||||||||||||||||||||||||||||||||||||||||||||||||||||||||||||||||||||||||||||||||||||||||||||
| γ-GT | KLB | rs7674434 | G | 2.77 | 2.15 | 0.032 | |||||||||||||||||||||||||||||||||||||||||||||||||||||||||||||||||||||||||||||||||||||||||||||
| rs12152703 | T | 2.94 | 2.26 | 0.024 | |||||||||||||||||||||||||||||||||||||||||||||||||||||||||||||||||||||||||||||||||||||||||||||||
| rs7670903 | A | 1.78 | 2.12 | 0.034 | |||||||||||||||||||||||||||||||||||||||||||||||||||||||||||||||||||||||||||||||||||||||||||||||
| AST/ALT | KLB | rs7674434 | G | 0.06 | 2.26 | 0.024 | |||||||||||||||||||||||||||||||||||||||||||||||||||||||||||||||||||||||||||||||||||||||||||||
| rs12152703 | T | 0.05 | 2.47 | 0.013 | |||||||||||||||||||||||||||||||||||||||||||||||||||||||||||||||||||||||||||||||||||||||||||||||
| FGF21 | FGF21 | rs499765 | G | 19.35 | 1.97 | 0.049 | |||||||||||||||||||||||||||||||||||||||||||||||||||||||||||||||||||||||||||||||||||||||||||||
| β-coefficient: estimated quantitative effect of each SNP minor allele copy on a phenotype of NAFLD, STAT: T statistic, P: level of statistical significance of the covariate adjusted linear regression analysis. | |||||||||||||||||||||||||||||||||||||||||||||||||||||||||||||||||||||||||||||||||||||||||||||||||||
Table 6. Associations between SNPs and obesity.
| Gene | SNP | Minor allele | Dominate model | Additive model | |||||||||||||||||||||||||||||||||||||||||||||||||||||||||||||||||||||||||||||||||||||||||||||||
| OR (95%CI) | SE | P | OR (95%CI) | SE | P | ||||||||||||||||||||||||||||||||||||||||||||||||||||||||||||||||||||||||||||||||||||||||||||||
| KLB | rs7670903 | A | 1.43 (1.13,1.81) | 0.12 | 0.003 | 1.20 (1.04,1.40) | 0.07 | 0.011 | |||||||||||||||||||||||||||||||||||||||||||||||||||||||||||||||||||||||||||||||||||||||||||
| KLB | rs7674434 | G | 1.04 (0.82,1.34) | 0.13 | 0.723 | 1.03 (0.82,1.29) | 0.11 | 0.784 | |||||||||||||||||||||||||||||||||||||||||||||||||||||||||||||||||||||||||||||||||||||||||||
| KLB | rs12152703 | T | 1.06 (0.83,1.36) | 0.13 | 0.640 | 1.05 (0.84,1.32) | 0.12 | 0.665 | |||||||||||||||||||||||||||||||||||||||||||||||||||||||||||||||||||||||||||||||||||||||||||
| KLB | rs2608819 | T | 1.03 (0.82,1.28) | 0.11 | 0.828 | 1.02 (0.84,1.24) | 0.10 | 0.835 | |||||||||||||||||||||||||||||||||||||||||||||||||||||||||||||||||||||||||||||||||||||||||||
| FGF21 | rs499765 | G | 1.00 (0.80,1.25) | 0.11 | 0.997 | 1.08 (0.93,1.25) | 0.08 | 0.324 | |||||||||||||||||||||||||||||||||||||||||||||||||||||||||||||||||||||||||||||||||||||||||||
| FUT1 | rs838136 | C | 1.14 (0.93,1.41) | 0.11 | 0.214 | 1.08 (0.93,1.07) | 0.08 | 0.298 | |||||||||||||||||||||||||||||||||||||||||||||||||||||||||||||||||||||||||||||||||||||||||||
| FGFR1 | rs4733946 | T | 0.99 (0.78,1.25) | 0.16 | 0.956 | 1.01 (0.81,1.26) | 0.11 | 0.939 | |||||||||||||||||||||||||||||||||||||||||||||||||||||||||||||||||||||||||||||||||||||||||||
| FGFR2 | rs3135761 | A | 1.02 (0.81,1.28) | 0.11 | 0.862 | 1.05 (0.91,1.21) | 0.07 | 0.531 | |||||||||||||||||||||||||||||||||||||||||||||||||||||||||||||||||||||||||||||||||||||||||||
| Abbreviations: OR: odds ratio, 95%CI: 95% confidence interval, SE: standard error, P: level of statistical significance of the difference between obesity cases and controls. | |||||||||||||||||||||||||||||||||||||||||||||||||||||||||||||||||||||||||||||||||||||||||||||||||||
| Dominate model: Dominate model covariate adjusted association analysis, adjusted for age (years) and sex. | |||||||||||||||||||||||||||||||||||||||||||||||||||||||||||||||||||||||||||||||||||||||||||||||||||
| Additive model: Additive model covariate adjusted association analysis, adjusted for age (years) and sex. | |||||||||||||||||||||||||||||||||||||||||||||||||||||||||||||||||||||||||||||||||||||||||||||||||||
Association between genotypes and NAFLD
Comparison of the genotype distribution between the NAFLD and non-NAFLD groups revealed that the rs7670903 A-allele frequency tended to be lower in the NAFLD group (Table 7), but covariate adjusted association analysis showed no significant difference (p = 0.064). More importantly, comparison of genotype distributions among all four groups (Table 8) revealed that the G-allele frequency of rs7674434 and T-allele frequency of rs12152703 in KLB were significantly higher in the obese with NAFLD group than in the obese without NAFLD group in both the dominant model (p = 0.004 and p = 0.006, respectively) and additive model (p = 0.005 and p = 0.007, respectively) covariate adjusted association analysis. By contrast, there were no difference in the genotype distributions between with non-obese with NAFLD and without NAFLD groups.
Table 7. Associations between SNPs and NAFLD.
| Gene | SNP | Minor allele | Dominate model | ||||||||||||||||||||||||||||||||||||||||||||||||||||||||||||||||||||||||||||||||||||||||||||||||
| OR (95%CI) | SE | P | |||||||||||||||||||||||||||||||||||||||||||||||||||||||||||||||||||||||||||||||||||||||||||||||||
| KLB | rs7670903 | A | 0.75 (0.55,1.02) | 0.16 | 0.064 | ||||||||||||||||||||||||||||||||||||||||||||||||||||||||||||||||||||||||||||||||||||||||||||||
| KLB | rs7674434 | G | 1.07 (0.78,1.46) | 0.16 | 0.680 | ||||||||||||||||||||||||||||||||||||||||||||||||||||||||||||||||||||||||||||||||||||||||||||||
| KLB | rs12152703 | T | 1.05 (0.77,1.44) | 0.16 | 0.757 | ||||||||||||||||||||||||||||||||||||||||||||||||||||||||||||||||||||||||||||||||||||||||||||||
| KLB | rs2608819 | T | 1.09 (0.82,1.45) | 0.15 | 0.567 | ||||||||||||||||||||||||||||||||||||||||||||||||||||||||||||||||||||||||||||||||||||||||||||||
| FGF21 | rs499765 | G | 0.95 (0.71,1.26) | 0.15 | 0.718 | ||||||||||||||||||||||||||||||||||||||||||||||||||||||||||||||||||||||||||||||||||||||||||||||
| FUT1 | rs838136 | C | 0.81 (0.62,1.06) | 0.14 | 0.124 | ||||||||||||||||||||||||||||||||||||||||||||||||||||||||||||||||||||||||||||||||||||||||||||||
| FGFR1 | rs4733946 | T | 0.91 (0.66,1.24) | 0.16 | 0.535 | ||||||||||||||||||||||||||||||||||||||||||||||||||||||||||||||||||||||||||||||||||||||||||||||
| FGFR2 | rs3135761 | A | 0.889 (0.66,1.17) | 0.15 | 0.379 | ||||||||||||||||||||||||||||||||||||||||||||||||||||||||||||||||||||||||||||||||||||||||||||||
| Abbreviations: OR: odds ratio, 95%CI: 95% confidence interval, SE: standard error, P: level of statistical significance of the difference between NAFLD cases and controls. | |||||||||||||||||||||||||||||||||||||||||||||||||||||||||||||||||||||||||||||||||||||||||||||||||||
| Dominate model: Additive model covariate adjusted association analysis, adjusted for age (years), sex and BMI (kg/m2). | |||||||||||||||||||||||||||||||||||||||||||||||||||||||||||||||||||||||||||||||||||||||||||||||||||
Table 8. Associations between SNPs and NAFLD in the obese group.
| Gene | SNP | Minor allele | Dominate model | Additive model | |||||||||||||||||||||||||||||||||||||||||||||||||||||||||||||||||||||||||||||||||||||||||||||||
| OR (95%CI) | SE | P | OR (95%CI) | SE | P | ||||||||||||||||||||||||||||||||||||||||||||||||||||||||||||||||||||||||||||||||||||||||||||||
| KLB | rs7670903 | A | 1.03 (0.69,1.53) | 0.20 | 0.881 | 0.98 (0.75,1.27) | 0.13 | 0.862 | |||||||||||||||||||||||||||||||||||||||||||||||||||||||||||||||||||||||||||||||||||||||||||
| KLB | rs7674434 | G | 1.89 (1.22,2.93) | 0.22 | 0.004 | 1.78 (1.19,2.67) | 0.21 | 0.005 | |||||||||||||||||||||||||||||||||||||||||||||||||||||||||||||||||||||||||||||||||||||||||||
| KLB | rs12152703 | T | 1.86 (1.20,2.88) | 0.22 | 0.006 | 1.75 (1.16,2.63) | 0.21 | 0.007 | |||||||||||||||||||||||||||||||||||||||||||||||||||||||||||||||||||||||||||||||||||||||||||
| KLB | rs2608819 | T | 1.30 (0.88,1.22) | 0.20 | 0.191 | 1.28 (0.91,1.82) | 0.18 | 0.160 | |||||||||||||||||||||||||||||||||||||||||||||||||||||||||||||||||||||||||||||||||||||||||||
| FGF21 | rs499765 | G | 1.12 (0.76,1.63) | 0.19 | 0.572 | 1.14 (0.89,1.46) | 0.13 | 0.302 | |||||||||||||||||||||||||||||||||||||||||||||||||||||||||||||||||||||||||||||||||||||||||||
| FUT1 | rs838136 | C | 0.69 (0.47,0.99) | 0.19 | 0.045 | 0.82 (0.64,1.06) | 0.13 | 0.135 | |||||||||||||||||||||||||||||||||||||||||||||||||||||||||||||||||||||||||||||||||||||||||||
| FGFR1 | rs4733946 | T | 1.10 (0.72,1.69) | 0.22 | 0.647 | 1.10 (0.75,1.61) | 0.19 | 0.624 | |||||||||||||||||||||||||||||||||||||||||||||||||||||||||||||||||||||||||||||||||||||||||||
| FGFR2 | rs3135761 | A | 1.03 (0.70,1.52) | 0.20 | 0.87 | 1.06 (0.83,1.35) | 0.12 | 0.631 | |||||||||||||||||||||||||||||||||||||||||||||||||||||||||||||||||||||||||||||||||||||||||||
| Abbreviations: OR: odds ratio, 95%CI: 95% confidence interval, SE: standard error, P: level of statistical significance of the difference between the obesity cases and controls. | |||||||||||||||||||||||||||||||||||||||||||||||||||||||||||||||||||||||||||||||||||||||||||||||||||
| Dominate model: Dominate model covariate adjusted association analysis, adjusted for age (years) and sex. | |||||||||||||||||||||||||||||||||||||||||||||||||||||||||||||||||||||||||||||||||||||||||||||||||||
| Additive model: Additive model covariate adjusted association analysis, adjusted for age (years) and sex. | |||||||||||||||||||||||||||||||||||||||||||||||||||||||||||||||||||||||||||||||||||||||||||||||||||
Association between genotypes and quantitative-traits related to NAFLD
We selected quantitative-traits related to NAFLD to analyze, including FGF21, ALT, AST, γ-GT, triglycerides, LDL-C, total cholesterol and fasting glucose (Figures 1–3). The results showed that KLB SNPs rs7674434 and rs12152703 had significant associations with ALT (P = 0.030 and P = 0.041, respectively) and γ-GT (P = 0.032 and P = 0.024, respectively) levels, while SNP rs7670903 correlated with γ-GT levels (P = 0.034) (Table 5). The KLB SNPs had no significant associations with AST, but SNPs rs7674434 and rs12152703 had significant associations with the AST/ALT ratio (P = 0.024 and P = 0.013, respectively) (Table 5). Comparison of the FGF21 levels revealed a significant association with FGF21 SNP rs499765 (P = 0.049) (Figure 2). The minor G-allele of rs7674434 and T-allele of rs12152703 correlated positively with ALT and γ-GT levels, the A-allele of rs7670903 correlated positively with γ-GT levels, and G-allele of rs499765 correlated positively with FGF21 levels. On the other hand, there were no significant associations among triglycerides, cholesterol or LDL-C levels and the SNPs.
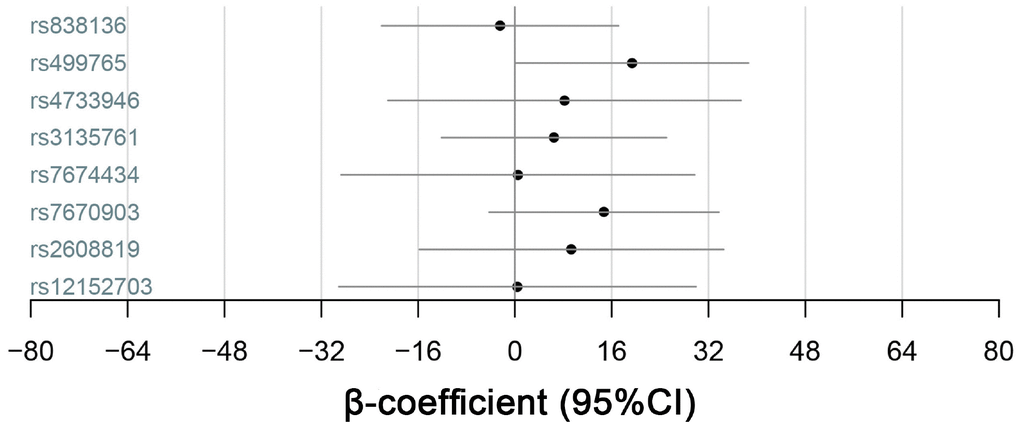
Figure 2. Quantitative-trait associations between serum FGF21 levels and the alleles of KLB, FGFR1 and FGF21 were analyzed for all 1688 subjects using multiple linear regression adjusted for sex and age.
To confirm the relation between the SNPs and hepatic inflammation in NAFLD patients, we analyzed the associations between the SNPs and ALT and γ-GT levels in the NAFLD group. The results (Figure 3) indicated that the G-allele of rs7674434 and T-allele of rs12152703 had stronger positive correlations with ALT levels in the NAFLD group (P = 0.005 and P = 0.008, respectively) than in the other groups. By contrast, there were no significant associations with γ-GT, AST or the AST/ALT ratio in the NAFLD group.
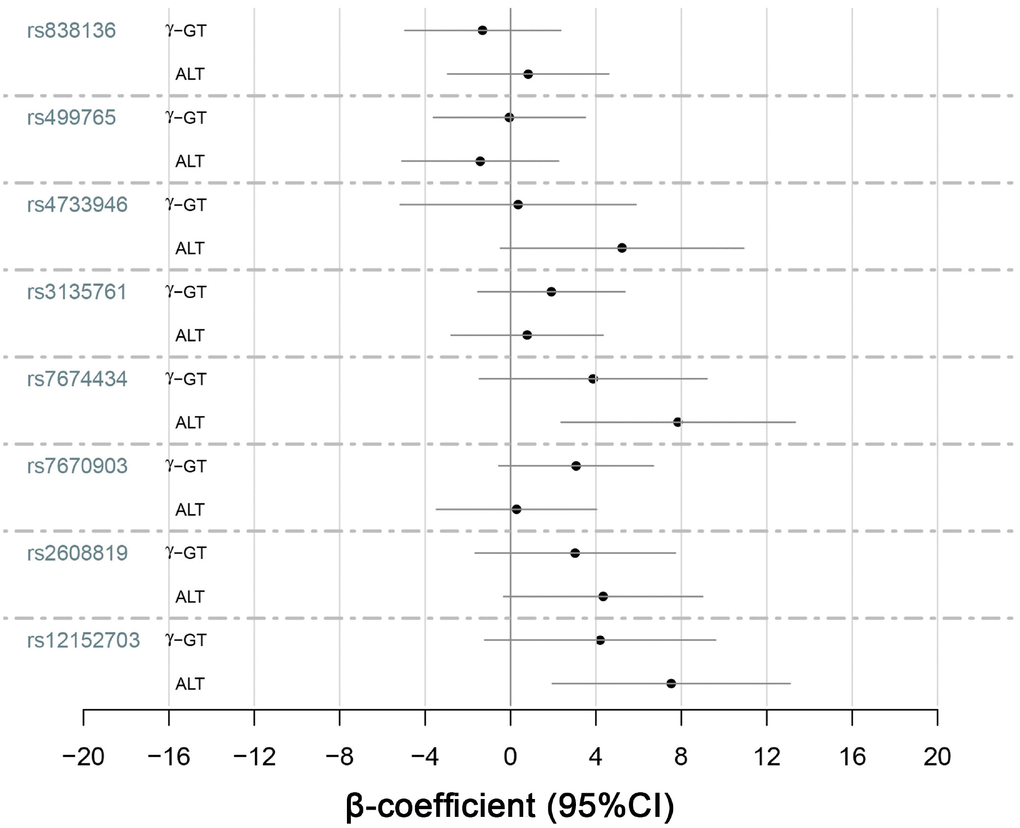
Figure 3. Quantitative-trait associations between γ-GT and ALT levels and the alleles of KLB, FGFR1 and FGF21 were analyzed for the 545 NAFLD patients using multiple linear regression adjusted for sex and age.
Discussion
An important finding of our study is the strong association between KLB SNP rs7670903 and obesity in a Han population of East China. The association was verified through both quantitative-traits analysis and cohort analysis. Another important result is that in the obese population, the minor G-allele of rs7674434 and T-allele of rs12152703 in KLB are risk alleles for NAFLD, but in the non-obese population there is no association between KLB and NAFLD. In addition, these two SNPs have significant associations with serum ALT levels. Notably, the association with ALT levels in NAFLD subjects is obviously stronger than in all subjects, which verifies the association between KLB variants and the degree of liver inflammation in the NAFLD population. As far as we know, there have been no previous reports of a correlation between NAFLD and KLB gene polymorphism.
KLB is a protein coding gene located in chromosome 4p14. The gene belongs to the glycoside hydrolase family 1 gene group and is mainly expressed in fat and liver. The dominant structure of KLB protein contains two connected glycoside hydrolase-like regions that bind FGF21 and FGF19. Functioning as a co-receptor, KLB is thought to be the primary high-affinity receptor for FGF21 and FGF19 binding to FGFRs (FGFR1 and FGFR4) to activate intracellular signaling [13]. FGFR1 and FGFR4 are widely expressed in most tissues, but the distribution of KLB is more specific. Furthermore, KLB combined with endocrine FGFs forms an activated FGFs-FGFR-KLB complex that is involved in regulating metabolic processes [14, 15]. In that regard, FGF21 is known to play a key role in controlling energy homeostasis [5]. In humans, serum FGF21 levels rise under conditions of starvation or inflammation [1]. In diabetic mouse models, blood glucose and triglyceride levels decline and insulin sensitivity is enhanced after mice are injected with recombinant FGF21 [16]. However, serum FGF21 levels are also elevated in the obese population, which likely also has a higher incidence of NAFLD [17]. Moreover, it appears that obesity can lead to an FGF21-resistant state [18] and that KLB expression is reduced in obese mice [19, 8]. This suggests reduced KLB expression maybe be an underlying cause of FGF21 resistance and the development of NAFLD.
KLB polymorphism is also reportedly related to coronary artery disease [20] and alcohol consumption [21]. In addition, studies in animals [11, 12] have shown that the AST/ALT ratio is elevated and triglyceride accumulation in the liver is increased in mice lacking KLB. Conversely, in obese mice overexpressing KLB, circulating cholesterol levels are reduced and the sensitivity to FGF21 is enhanced. Up to now, there have been no studies on the relation between KLB polymorphism and NAFLD in humans.
The locus rs7670903 is located within intron 3 of KLB, near the end of exon 3 in the protein coding domain. Two other loci, rs7674434 and rs12152703, are both situated within intron 1 of KLB, and between exons 1 and 2 in the protein coding domain. The distance between these two loci is 2410 bp, though the two variants show complete (r2 = 1.0) linkage disequilibrium in the Chinese population (grch37.emsebl.org), so these two alleles are completely associated. The functions of these three SNPs are unknown, and there are no previous reports of an association between these SNPs and NAFLD. In our analysis, however, rs7674434 was significantly associated with the development of NAFLD in an obese population and with the degree of liver inflammation in a NAFLD population. Moreover, rs12152703, which, as mentioned, is in complete linkage disequilibrium with rs7674434, exhibits a similar association. This further supports the correlation between KLB gene polymorphism and NAFLD. This suggests SNPs rs7674434 and rs12152703 may be useful therapeutic targets in NAFLD patients. In particular, KLB becomes a risk gene for NAFLD in obese individuals but not non-obese individuals. This hints that KLB may be an important risk gene for NAFLD under the environmental pressure of obesity.
NAFLD is a disease with high morbidity and without effective treatments. Recombinant FGF21 is thought to be a promising treatment option for hepatocellular carcinoma (HCC) [14] and NAFLD [22]. However, conditions such as obesity may lead to FGF21 resistance, and the level of KLB expression may modulate the response to FGF21 [8]. The KLB gene polymorphism is associated with expression of KLB protein suggests KLB polymorphism is involved in energy metabolism and the pathogenesis of NAFLD. This makes KLB SNPs a potential target for treatment of NAFLD.
There are several limitations to our study. First, we studied patients from a single center, so the results may not represent the entire Chinese population. Second, a significant association between KLB and AST levels was not been found in the study. Similarly, we did not find a significant association between KLB and the AST/ALT ratio in the NAFLD group. This may be because the number of NAFLD patients, particularly those with severe NAFLD, was too small. Future studies should include additional clinical centers to enlarge the sample size to further test the results of this study. Finally, although associations between three KLB SNPs and NAFLD were detected, not all KLB SNPs were analyzed. In future studies, we will analyze the other KLB SNPs and assess expression of KLB protein in order to identify potential gene targets related to diagnosis and treatment of NAFLD.
Conclusions
In the Han Chinese, KLB is strongly associated with obesity, the development of NAFLD in the obese population, and hepatic inflammation in NAFLD patients. This means that KLB is not only involved in normal energy metabolism but also influences hepatic injury in NAFLD. And because FGF21 depends on KLB as co-receptor to exert its biological effects, KLB gene polymorphism may mediate FGF21 resistance to NAFLD treatment.
Materials and Methods
Study population
From January 2018 to October 2018, a total of 1688 subjects were recruited from the Department of Physical Examination Center, the Affiliated Hospital of Xuzhou Medical University, China (see Supplementary Table 1 for details about the recruitment). Included populations were unrelated and ethnically Han Chinese aged 18-80 years. Exclusion criteria were: 1) history of significant alcohol consumption (>210 g of pure alcohol per week in men or >140 g of pure alcohol per week in women for >1 year); 2) history of long-term medication (>1 week); and 3) infection with hepatitis B or hepatitis C virus. The subjects were first divided into NAFLD (n = 545) and non-NAFLD (n = 1143) groups based on the results of liver ultrasonography. The ultrasonographic manifestation of NAFLD was more enhanced echotexture in liver than kidneys, obscure vascular structures, shallow echo intensification, and deep attenuation of the liver. The subjects were then further divided into obese and non-obese groups. The WHO criteria of obesity in Asian populations is a BMI ≥ 25. There were 584 obese individuals among the subjects. Ultimately, then, the subjects were divided into four groups: non-obese without NAFLD, obese without NAFLD, non-obese with NAFLD and obese with NAFLD. All participants gave their informed consent, and the study protocol was approved by the ethics committee of the Affiliated Hospital of Xuzhou Medical University (XYFY2019-KL012).
Laboratory measurements
The experimental indexes were measured under fasting conditions in the central laboratory of the Affiliated Hospital of Xuzhou Medical University. Measured were ALT, AST, γ-GT, triglycerides, cholesterol, LDL-C and fasting glucose. In addition, venous blood was collected and centrifuged at 5,000 × g for 10 min, after which the serum was stored at −80°C. Serum FGF21 levels were measured using a Human FGF-21 Simple Step ELISA Kit (ab222506, Abcam, Cambridge, United Kingdom).
SNP selection
SNPs in FGF21, KLB and FGFR possibly associated with nutrient intake and metabolism were selected for detection. SNPs in IZUMO1, FUT1 and FGF21 on chromosome 19q13 were reported to influence components of caloric intake in a genome-wide meta-analysis of European population-based cohorts [10] and potentially influenced expression of FGF21 protein [9]. The impacts of SNPs in FGFR1 and FGFR2 on obesity and on serum LDL-C levels have been reported in multiple European cohorts [23, 24]. Several studies suggest that SNPs in KLB localized on human chromosome 4p14 are probably related to alcohol drinking and HCC progression [21, 25], but the association of KLB SNPs with nutrient metabolism were not verified. We selected SNPs with a high frequency (>10%) of the minor allele.
Genomic DNA was isolated from the whole blood using a Tianamp DNA kit (Tiangene, Biotech, Beijing, China) following the manufacturer’s instructions. It was then quantified using a UV spectrophotometer. The locus-specific PCR primers were designed by ASSAY DESIGH SUITE V2.0 (Table 1). The specific amplification was performed using the Sequenom MassARRAY iPLEX platform (Sequenom CapitalBio Corporation, Beijing, China). Masses were detected using a MALDI-TOF mass spectrometer, and the obtained data were analyzed using MassARRAY Typer 4.0 software.
Statistical analysis
The baseline characteristics of the samples were compared between the groups using the nonparametric Kruskal-Wallis test. We used Plink 1.9 [26] software to control the quality of the genotyping results and carry out association analyses. The quality control included the loss frequency of genotyping, MAF and HWE tests. The genotype-phenotype association analyses were performed using three covariate-adjusted models (dominant, recessive and additive) with age and sex as random effects. Quantitative-traits association analyses were used to assess the interaction between factors for NAFLD and the genotypes of each SNP through multiple linear regression analyses in all subjects. In addition, we analyzed the quantitative-traits association between the biochemistry indexes and the allelic variants in the NAFLD group. Values of P < 0.05 considered significant, with smaller P-values indicating stronger degrees of association.
Supplementary Materials
Acknowledgment and Funding
We thank all participants for their contributions. This study supported by grants from the National Natural Science Foundation of China (Grant No.81371867), Jiangsu Provincial Special Program of Medical Science (BL2014033), and Major National Science and Technology Projects of China (2018ZX10302206-003-010). Funding to pay the Open Access publication charges for this article are from the National Natural Science Foundation of China.
Conflicts of Interest
Authors do not have any conflicts of interest.
References
- 1. Kuro-O M. The Klotho proteins in health and disease. Nat Rev Nephrol. 2019; 15:27–44. https://doi.org/10.1038/s41581-018-0078-3 [PubMed]
- 2. Owen BM, Mangelsdorf DJ, Kliewer SA. Tissue-specific actions of the metabolic hormones FGF15/19 and FGF21. Trends Endocrinol Metab. 2015; 26:22–29. https://doi.org/10.1016/j.tem.2014.10.002 [PubMed]
- 3. Fon Tacer K, Bookout AL, Ding X, Kurosu H, John GB, Wang L, Goetz R, Mohammadi M, Kuro-o M, Mangelsdorf DJ, Kliewer SA. Research resource: comprehensive expression atlas of the fibroblast growth factor system in adult mouse. Mol Endocrinol. 2010; 24:2050–64. https://doi.org/10.1210/me.2010-0142 [PubMed]
- 4. Bookout AL, de Groot MH, Owen BM, Lee S, Gautron L, Lawrence HL, Ding X, Elmquist JK, Takahashi JS, Mangelsdorf DJ, Kliewer SA. FGF21 regulates metabolism and circadian behavior by acting on the nervous system. Nat Med. 2013; 19:1147–52. https://doi.org/10.1038/nm.3249 [PubMed]
- 5. Fisher FM, Maratos-Flier E. Understanding the Physiology of FGF21. Annu Rev Physiol. 2016; 78:223–41. https://doi.org/10.1146/annurev-physiol-021115-105339 [PubMed]
- 6. Diehl AM, Day C. Cause, Pathogenesis, and Treatment of Nonalcoholic Steatohepatitis. N Engl J Med. 2017; 377:2063–72. https://doi.org/10.1056/NEJMra1503519 [PubMed]
- 7. Coskun T, Bina HA, Schneider MA, Dunbar JD, Hu CC, Chen Y, Moller DE, Kharitonenkov A. Fibroblast growth factor 21 corrects obesity in mice. Endocrinology. 2008; 149:6018–27. https://doi.org/10.1210/en.2008-0816 [PubMed]
- 8. Fisher FM, Chui PC, Antonellis PJ, Bina HA, Kharitonenkov A, Flier JS, Maratos-Flier E. Obesity is a fibroblast growth factor 21 (FGF21)-resistant state. Diabetes. 2010; 59:2781–89. https://doi.org/10.2337/db10-0193 [PubMed]
- 9. Tanaka T, Ngwa JS, van Rooij FJ, Zillikens MC, Wojczynski MK, Frazier-Wood AC, Houston DK, Kanoni S, Lemaitre RN, Luan J, Mikkilä V, Renstrom F, Sonestedt E, et al. Genome-wide meta-analysis of observational studies shows common genetic variants associated with macronutrient intake. Am J Clin Nutr. 2013; 97:1395–402. https://doi.org/10.3945/ajcn.112.052183 [PubMed]
- 10. Chu AY, Workalemahu T, Paynter NP, Rose LM, Giulianini F, Tanaka T, Ngwa JS, Qi Q, Curhan GC, Rimm EB, Hunter DJ, Pasquale LR, Ridker PM, et al, and CHARGE Nutrition Working Group, and DietGen Consortium. Novel locus including FGF21 is associated with dietary macronutrient intake. Hum Mol Genet. 2013; 22:1895–902. https://doi.org/10.1093/hmg/ddt032 [PubMed]
- 11. Kobayashi K, Tanaka T, Okada S, Morimoto Y, Matsumura S, Manio MC, Inoue K, Kimura K, Yagi T, Saito Y, Fushiki T, Inoue H, Matsumoto M, Nabeshima Y. Hepatocyte β-Klotho regulates lipid homeostasis but not body weight in mice. FASEB J. 2016; 30:849–62. https://doi.org/10.1096/fj.15-274449 [PubMed]
- 12. Samms RJ, Cheng CC, Kharitonenkov A, Gimeno RE, Adams AC. Overexpression of β-Klotho in Adipose Tissue Sensitizes Male Mice to Endogenous FGF21 and Provides Protection From Diet-Induced Obesity. Endocrinology. 2016; 157:1467–80. https://doi.org/10.1210/en.2015-1722 [PubMed]
- 13. Lee S, Choi J, Mohanty J, Sousa LP, Tome F, Pardon E, Steyaert J, Lemmon MA, Lax I, Schlessinger J. Structures of β-klotho reveal a ‘zip code’-like mechanism for endocrine FGF signalling. Nature. 2018; 553:501–05. https://doi.org/10.1038/nature25010 [PubMed]
- 14. Hecht R, Li YS, Sun J, Belouski E, Hall M, Hager T, Yie J, Wang W, Winters D, Smith S, Spahr C, Tam LT, Shen Z, et al. Rationale-Based Engineering of a Potent Long-Acting FGF21 Analog for the Treatment of Type 2 Diabetes. PLoS One. 2012; 7:e49345. https://doi.org/10.1371/journal.pone.0049345 [PubMed]
- 15. Kolumam G, Chen MZ, Tong R, Zavala-Solorio J, Kates L, van Bruggen N, Ross J, Wyatt SK, Gandham VD, Carano RA, Dunshee DR, Wu AL, Haley B, et al. Sustained Brown Fat Stimulation and Insulin Sensitization by a Humanized Bispecific Antibody Agonist for Fibroblast Growth Factor Receptor 1/βKlotho Complex. EBioMedicine. 2015; 2:730–43. https://doi.org/10.1016/j.ebiom.2015.05.028 [PubMed]
- 16. Kharitonenkov A, Shiyanova TL, Koester A, Ford AM, Micanovic R, Galbreath EJ, Sandusky GE, Hammond LJ, Moyers JS, Owens RA, Gromada J, Brozinick JT, Hawkins ED, et al. FGF-21 as a novel metabolic regulator. J Clin Invest. 2005; 115:1627–35. https://doi.org/10.1172/JCI23606 [PubMed]
- 17. Dushay J, Chui PC, Gopalakrishnan GS, Varela-Rey M, Crawley M, Fisher FM, Badman MK, Martinez-Chantar ML, Maratos-Flier E. Increased fibroblast growth factor 21 in obesity and nonalcoholic fatty liver disease. Gastroenterology. 2010; 139:456–63. https://doi.org/10.1053/j.gastro.2010.04.054 [PubMed]
- 18. Muise ES, Azzolina B, Kuo DW, El-Sherbeini M, Tan Y, Yuan X, Mu J, Thompson JR, Berger JP, Wong KK. Adipose fibroblast growth factor 21 is up-regulated by peroxisome proliferator-activated receptor gamma and altered metabolic states. Mol Pharmacol. 2008; 74:403–12. https://doi.org/10.1124/mol.108.044826 [PubMed]
- 19. Ge X, Chen C, Hui X, Wang Y, Lam KS, Xu A. Fibroblast growth factor 21 induces glucose transporter-1 expression through activation of the serum response factor/Ets-like protein-1 in adipocytes. J Biol Chem. 2011; 286:34533–41. https://doi.org/10.1074/jbc.M111.248591 [PubMed]
- 20. Akbari H, Asadikaram G, Aria H, Fooladi S, Vakili S, Masoumi M. Association of Klotho gene polymorphism with hypertension and coronary artery disease in an Iranian population. BMC Cardiovasc Disord. 2018; 18:237. https://doi.org/10.1186/s12872-018-0971-5 [PubMed]
- 21. Schumann G, Liu C, O’Reilly P, Gao H, Song P, Xu B, Ruggeri B, Amin N, Jia T, Preis S, Segura Lepe M, Akira S, Barbieri C, et al. KLB is associated with alcohol drinking, and its gene product β-Klotho is necessary for FGF21 regulation of alcohol preference. Proc Natl Acad Sci USA. 2016; 113:14372–77. https://doi.org/10.1073/pnas.1611243113 [PubMed]
- 22. Gimeno RE, Moller DE. FGF21-based pharmacotherapy—potential utility for metabolic disorders. Trends Endocrinol Metab. 2014; 25:303–11. https://doi.org/10.1016/j.tem.2014.03.001 [PubMed]
- 23. Jiao H, Arner P, Dickson SL, Vidal H, Mejhert N, Henegar C, Taube M, Hansson C, Hinney A, Galan P, Simon C, Silveira A, Benrick A, et al. Genetic association and gene expression analysis identify FGFR1 as a new susceptibility gene for human obesity. J Clin Endocrinol Metab. 2011; 96:E962–66. https://doi.org/10.1210/jc.2010-2639 [PubMed]
- 24. Kaess BM, Barnes TA, Stark K, Charchar FJ, Waterworth D, Song K, Wang WY, Vollenweider P, Waeber G, Mooser V, Zukowska-Szczechowska E, Samani NJ, Hengstenberg C, Tomaszewski M. FGF21 signalling pathway and metabolic traits - genetic association analysis. Eur J Hum Genet. 2010; 18:1344–48. https://doi.org/10.1038/ejhg.2010.130 [PubMed]
- 25. Repana D, Ross P. Targeting FGF19/FGFR4 Pathway: A Novel Therapeutic Strategy for Hepatocellular Carcinoma. Diseases. 2015; 3:294–305. https://doi.org/10.3390/diseases3040294 [PubMed]
- 26. Chang CC, Chow CC, Tellier LC, Vattikuti S, Purcell SM, Lee JJ. Second-generation PLINK: rising to the challenge of larger and richer datasets. Gigascience. 2015; 4:7. https://doi.org/10.1186/s13742-015-0047-8 [PubMed]