


Introduction
Glucuronic acid is a key metabolite of glucose involved in the detoxification of xenobiotic compounds [1–6]. Many of these exogenous compounds, which include pollutants and drug metabolites, undergo hepatic glucuronidation, in which they are conjugated to glucuronic acid via the enzymatic action of UDP-glucuronosyltransferases [7, 8]. This chemical modification increases solubility in bile, facilitates urinary excretion, and is a key step in the phase II metabolism of these compounds required for their effective clearance from the body [9]. However, enzymes known as β-glucuronidases cleave these conjugates, thereby counteracting this detoxification process [10], as well as steroid hormone conjugates, thereby altering steroid metabolism [11]. Around a quarter of resident bacterial species in the human gut produce β-glucuronidase [12–14], which has been directly linked to increased xenobiotic-induced toxicity rescuable by inhibition of the enzyme [15–17]. Another vital role of glucuronic acid is as a constituent of proteoglycans, a diverse class of glycosylated proteins known primarily as components of the mammalian extracellular matrix [18, 19], where glucuronic acid may confer increased rigidity [20]. These proteoglycans are degraded as a part of tissue remodeling by endogenous lysosomal β-glucuronidase, which, like its bacterial analogue, cleaves glucuronic acid moieties through hydrolysis [21].
The factors influencing circulating levels of glucuronic acid are poorly characterized. However, orally ingested glucuronic acid has been shown to raise serum glucuronic acid levels within an hour, suggesting that it is readily absorbed into the bloodstream [22]. The ingestion of glucuronide conjugates also increases glucuronic acid levels, likely through the absorption of glucuronic acid liberated in the gastrointestinal tract by β-glucuronidases [23]. Elevated serum levels of glucuronic acid have been reported in human studies of diabetes, hepatocellular carcinoma, hepatitis, cirrhosis, and obstructive jaundice [24–28]. These findings are not unambiguous, as subsequent work reported contradictory associations with hyperglycemia and hepatitis [25, 29, 30]. Finally, a recent metabolomic study of patients with cirrhosis identified glucuronic acid as a biomarker of disease severity and future mortality [31].
In the present study, we performed untargeted profiling of circulating metabolites in a large, population-based prospective human cohort study, followed by validation in two further prospective cohorts and one longitudinal mouse study. We report the novel discovery that circulating glucuronic acid is a robust, cross-cohort and cross-species predictor of all-cause mortality in healthy individuals, as well as a predictor in humans of chronological age and healthspan-related outcomes.
Results
Circulating glucuronic acid levels predict all-cause mortality in humans
We performed untargeted metabolomics on the Estonian Biobank cohort and found 69 of 569 identified metabolites to be predictive at FDR < 0.05 of all-cause mortality by Cox regression corrected for clinical covariates. Glucuronic acid ranked 9th by p-value and was highly significant after correcting for multiple hypothesis testing (HR=1.44, p=2.9×10⁻⁶, FDR=5.0×10⁻⁴), with higher levels leading to shorter lives on average. A Kaplan-Meier survival curve comparing the top and bottom quartiles of glucuronic acid levels in the Estonian Biobank cohort is shown in Figure 1A and demonstrated a significant difference in survival between the curves (p=1.7×10⁻⁶).
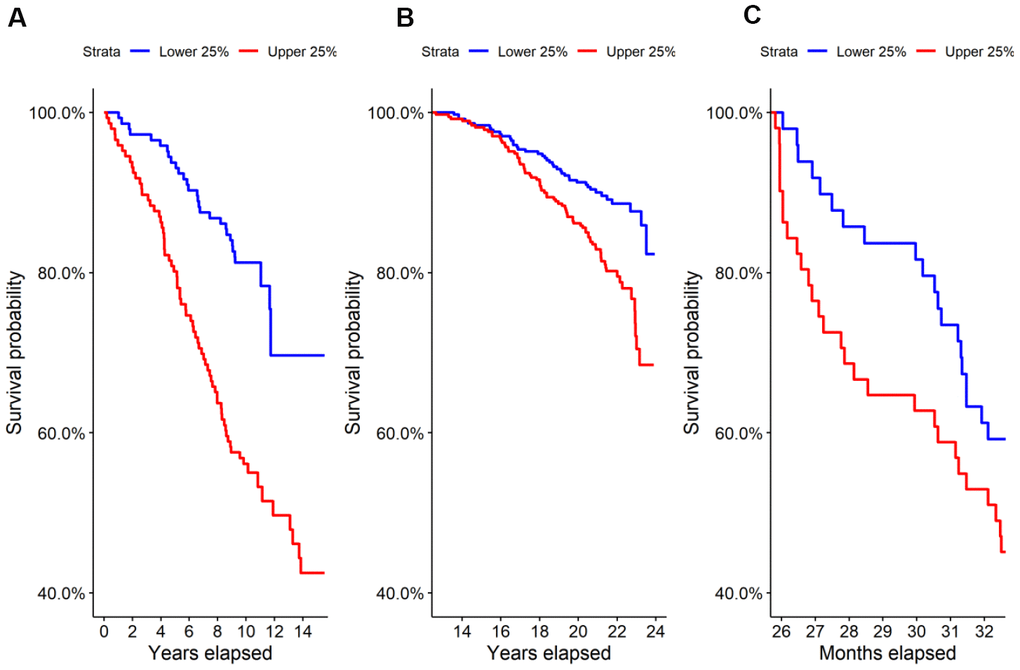
Figure 1. Survival in the highest and lowest quartiles of glucuronic acid level. Kaplan-Meier survival curves for the top vs. bottom quartiles of glucuronic acid level are plotted for (A) the Estonian Biobank discovery cohort, (B) the Framingham Offspring cohort, and (C) the longitudinal murine cohort.
We evaluated this association in two replication cohorts, the Framingham Offspring cohort and TwinsUK study cohort, by Cox regression corrected for clinical covariates. Demographic characteristics of these cohorts are shown in Table 1A. As in the Estonian cohort, we found that glucuronic acid levels predicted all-cause mortality in both the Framingham Offspring (N=1,479; HR=1.13, p=0.032; Kaplan-Meier curve in Figure 1B) and in the TwinsUK (N=1,761; HR=1.25, p=0.017) cohorts.
Table 1. Demographic and clinical characteristics by cohort.
| Characteristic | Estonian Biobank (discovery) | Framingham Offspring | TwinsUK | Estonian Biobank (secondary) | |||||||||||||||||||||||||||||||||||||||||||||||||||||||||||||||||||||||||||||||||||||||||||||||
| Sample size | 579 | 1,479 | 1,761 | 100 | |||||||||||||||||||||||||||||||||||||||||||||||||||||||||||||||||||||||||||||||||||||||||||||||
| Deaths | 189 | 306 | 47 | 0 | |||||||||||||||||||||||||||||||||||||||||||||||||||||||||||||||||||||||||||||||||||||||||||||||
| Median time to death (years) | 5.9 ± 3.8 | 18.3 ± 2.7 | 2.64 ± 2.1 | n/a | |||||||||||||||||||||||||||||||||||||||||||||||||||||||||||||||||||||||||||||||||||||||||||||||
| Median follow-up time (years) | 7.1 ± 2.7 | 21.5 ± 2.0 | 3.41 ± 2.39 | n/a | |||||||||||||||||||||||||||||||||||||||||||||||||||||||||||||||||||||||||||||||||||||||||||||||
| Women (%) | 69.8 | 53.0 | 100.0 | 50% | |||||||||||||||||||||||||||||||||||||||||||||||||||||||||||||||||||||||||||||||||||||||||||||||
| Age (years) | 73.3 ± 2.7 | 53.7 ± 9.2 | 64.9 ± 8.4 | 41.7 ± 12.2 | |||||||||||||||||||||||||||||||||||||||||||||||||||||||||||||||||||||||||||||||||||||||||||||||
| Body mass index | 27.3 ± 4.3 | 22.5 ± 4.9 | 26.4 ± 4.9 | 26.2 ± 3.7 | |||||||||||||||||||||||||||||||||||||||||||||||||||||||||||||||||||||||||||||||||||||||||||||||
| Systolic blood pressure (mm Hg) | 140.1 ± 17.2 | 125.4 ± 18.7 | 131.3 ± 23.3 | 123.4 ± 13.1 | |||||||||||||||||||||||||||||||||||||||||||||||||||||||||||||||||||||||||||||||||||||||||||||||
| Diastolic blood pressure (mm Hg) | 81.0 ± 9.0 | 75.0 ± 10.4 | 77.0 ± 19.9 | 78.6 ± 11.0 | |||||||||||||||||||||||||||||||||||||||||||||||||||||||||||||||||||||||||||||||||||||||||||||||
| Current smokers (%) | 6.3 | 18.2 | 2.1 | 25.0 | |||||||||||||||||||||||||||||||||||||||||||||||||||||||||||||||||||||||||||||||||||||||||||||||
| Preexisting diabetes (%) | 0.0 | 4.5 | 10.2 | 0.0 | |||||||||||||||||||||||||||||||||||||||||||||||||||||||||||||||||||||||||||||||||||||||||||||||
| Preexisting heart disease (%) | 0.0 | 5.9 | 0.8 | 2.0 | |||||||||||||||||||||||||||||||||||||||||||||||||||||||||||||||||||||||||||||||||||||||||||||||
| Preexisting cancer (%) | 0.0 | 7.1 | 13.7 | 2.0 | |||||||||||||||||||||||||||||||||||||||||||||||||||||||||||||||||||||||||||||||||||||||||||||||
| Demographic and clinical characteristics of the cohorts used in the present study are presented. Values are numbers of patients, percentages (%), mean ± standard deviation, or median ± median absolute deviation, as appropriate. | |||||||||||||||||||||||||||||||||||||||||||||||||||||||||||||||||||||||||||||||||||||||||||||||||||
We investigated whether the predictive ability of glucuronic acid for mortality would be attenuated by including other known mortality biomarkers in the regression model. The Framingham Offspring cohort allowed us to correct for seven of the most commonly studied biomarkers of mortality, including fasting glucose, HDL cholesterol, LDL cholesterol, triglycerides, creatinine, HbA1c, and albumin. In a multivariate Cox regression model adding these to our baseline clinical covariates, glucuronic acid levels remained a significant predictor of mortality (HR=1.12, p=0.044).
Circulating glucuronic acid levels predict mortality across species
To further validate the observed relationship between glucuronic acid levels and mortality, we performed metabolomic profiling on the sera of 196 27-month-old female mice from a genetically heterogenous background followed from birth through 33 months of age. In this murine cohort, glucuronic acid levels were also a significant predictor of all-cause mortality (HR=1.29, p=0.018), and a weakly significant difference in survival was observed between the top and bottom quartiles of glucuronic acid levels in this cohort (p=0.1, Figure 1C).
Circulating glucuronic acid levels increase with age
We found a significant positive correlation between glucuronic acid levels and age in the secondary Estonian Biobank cohort (N=100; r=0.41, p=2.7×10⁻⁵, Figure 2A), which was selected to span a wide range of ages. This relationship also validated in the main Estonian Biobank cohort (Pearson r=0.12, p=3.7×10⁻³, Figure 2B) and the Framingham Offspring cohort (r=0.16, p=1.3×10⁻⁹, Figure 2C). Multivariate models adjusted for standard clinical covariates also identified age as a significant correlate of glucuronic acid levels in all three cohorts (p=4.3×10⁻³, 2.0×10⁻⁸, and 2.2×10⁻⁵, respectively).
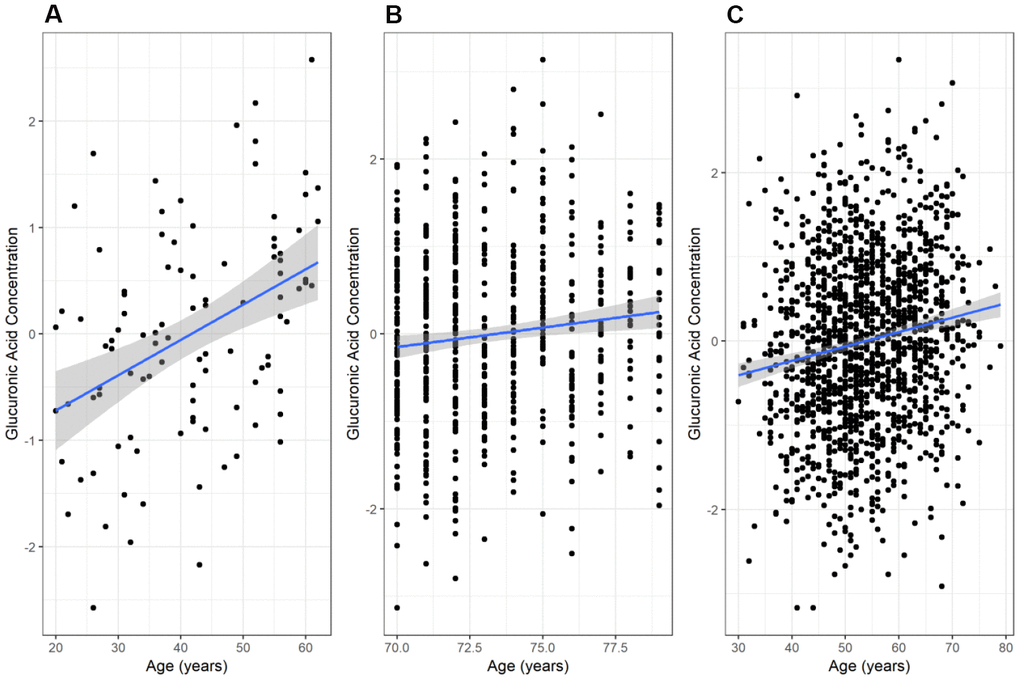
Figure 2. Variation of glucuronic acid levels with age. The relationship between chronological age and glucuronic acid levels in (A) the Estonian Biobank secondary cohort, (B) the Estonian Biobank primary (discovery) cohort, and (C) the Framingham Offspring cohort. In each case, the best-fit regression line through the data is shown, with the 95% confidence interval for this line shaded in grey. Glucuronic acid concentrations are represented as standard deviations of normalized concentrations within each dataset.
Discussion
We have demonstrated that glucuronic acid levels are robust predictors of all-cause mortality and correlate with future healthspan-related outcomes. The effect size of the relationship with mortality (hazard ratios between 1.1 and 1.4 in our cohorts) is comparable to that of existing, clinically-important biomarkers of mortality such as cholesterol (HR=1.12 per mmol/L increase) and systolic blood pressure (HR=1.13 per 10 mm Hg increase) [32, 33]. Importantly, the predictive utility of glucuronic acid persists after adjustment for standard clinical covariates and other accepted predictors of mortality, including factors such as demographics, BMI, smoking status, blood lipids, HbA1c, creatinine, and albumin, indicating that the predictive ability of glucuronic acid for mortality is independent of these existing markers and their related biological mechanisms [34]. Moreover, we have demonstrated novel associations between glucuronic acid levels and future healthspan-related outcomes, including physical abilities, functional capabilities, and self-rated health, suggesting that the risk of mortality associated with elevated glucuronic acid levels is accompanied by a general decline in healthspan. Finally, we found glucuronic acid to be strongly positively correlated with age in three human cohorts with mean age ranging from 40 to 70 years (Table 1), an association that remained statistically significant following adjustment for clinical covariates. Notably, the simultaneous association of glucuronic acid levels with age, lifespan (as determined by all-cause mortality), and healthspan-related outcomes strongly argues that glucuronic acid is a biomarker of biological aging. Depending on the specific biology that underlies this relationship, glucuronic acid may also relate to the pathogenesis of these outcomes, and hence also of biological aging.
There are multiple mechanisms that might link levels of circulating glucuronic acid to age, mortality, and healthspan. One of the most compelling and best-understood possibilities relates to the cleavage of glucuronic acid from glucuronidated xenobiotics and steroid hormones by intestinal bacteria, a process that releases glucuronic acid as well as the toxin or steroid, making both available for reabsorption into the bloodstream in a process called enterohepatic recirculation [10]. Since activity of the responsible enzyme, β-glucuronidase, varies greatly among microbial species [12, 35], the composition of a person’s intestinal microbiome has a direct influence on this process. A microbiome that rapidly cleaves glucuronide conjugates may thus produce elevated glucuronic acid and also interfere with xenobiotic elimination and steroid metabolism. The substrates of glucuronide conjugation include xenobiotics such as environmental toxins and drug metabolites with pro-inflammatory and immunosuppressive effects [36–38] as well as endogenous steroids with tumorigenic effects at high concentrations [39, 40], and impairment of glucuronidation by intestinal β-glucuronidase can cause organ toxicity, inflammatory disorders, and carcinogenesis [16, 41–44]. Consequently, changes in microbiome composition could easily underlie the observed correlation between higher glucuronic acid levels, age, healthspan-related outcomes, and mortality [45].
This hypothesis is supported by other evidence from the literature. Among older people, bacterial β-glucuronidase activity levels are increased relative to young people (Mroczyńska and Libudzisz, 2010), and microbiome differences can distinguish healthy, independent older people from those who tend to be frail, sick, and require long-term residential care [46, 47]. Microbiome composition has also been linked to the onset of numerous age-related diseases, including atherosclerosis [48], type 2 diabetes [49], Alzheimer’s disease [50], chronic kidney disease [51], and nonalcoholic steatohepatitis [52], all of which contribute to reduced healthspan and increased mortality. Furthermore, bacterial β-glucuronidase activity changes in the appropriate direction with dietary modifications. For example, red meat consumption alters the gut microbiome [53, 54], elevates fecal β-glucuronidase activity [55], and correlates with increased future diabetes, cardiovascular disease, and mortality [56]. In contrast, dietary fiber consumption increases microbial diversity [57], reduces fecal β-glucuronidase activity [58–60], and correlates with lower all-cause and cause-specific mortality [61–63].
While this hypothesis is compelling, many other possibilities exist. For example, bacterial β-glucuronidase activity may be affected by gastrointestinal pH [64, 65] and hepatic glucuronidation may be impaired by chronic renal failure [66], both of which are independent of microbiome composition. Another potential mechanism linking glucuronic acid levels to disease states involves endogenous human β-glucuronidase, which localizes primarily to the lysosome and degrades glycosaminoglycans during normal and pathologic remodeling of the extracellular matrix (ECM) via hydrolytic liberation of glucuronic acid [21]. ECM remodeling is increased in aging and age-related diseases [67–69], with ECM degradation fragments in serum even being employed as disease biomarkers in some cases [70–72]. Moreover, lysosomal membrane permeabilization, an observation to inflammation and cell death [73–79] can cause the release of endogenous β-glucuronidase into the bloodstream [80], where it cleaves glucuronidated conjugates and may contribute to circulating glucuronic acid levels [81, 82]. In these scenarios, elevated glucuronic acid levels could be a result of ECM remodeling, inflammation, or cell death caused by concurrent disease. This seems less likely in our discovery cohort, where participants were free of major diseases at sample collection, but could still be consistent with subclinical disease. Finally, in addition to the above mechanisms related to glucuronidation, glucuronic acid may directly elicit an inflammatory response through an interaction with toll-like receptor 4 (TLR4) [83], which has been implicated in the pathophysiology of age-related diseases [84–86]. Of course, substantial further research is warranted to distinguish the relative contributions of these various hypotheses to the link between circulating glucuronic acid levels and aging, healthspan, and mortality.
The present study has a number of limitations. First, it is observational and retrospective in nature; however, it derives strength from the persistence of association across three high-quality, prospective human cohort studies in different countries, as well as in a lifespan study of genetically heterogenous mice. Second, despite the geographic diversity of our cohorts (Estonia, USA, and the United Kingdom), study participants were still predominantly of European descent, and the generalizability of these results to other demographic groups is uncertain, although the positive cross-species replication is encouraging. Third, the human cohorts were under-powered to evaluate relationships of glucuronic acid with the incidence of most individual diseases.
In summary, circulating glucuronic acid levels predict mortality in humans and mice, and in humans also associate with chronological age and predict healthspan-related outcomes. These simultaneous associations with age and with factors defining both lifespan and healthspan provide strong evidence that glucuronic acid is a biomarker of longevity and healthspan, as well as underlying biological age.
Materials and Methods
Sample cohorts
Estonian Biobank cohorts
Our discovery cohort was drawn from the Estonian Biobank at the University of Tartu [87]. Participants were selected to be elderly (between the ages of 70 and 79) and healthy at the time of sample collection, i.e. to have no preexisting history of hypertensive heart disease, diabetes, coronary artery disease, cancer, chronic obstructive pulmonary disease, stroke, or Alzheimer’s disease. The resulting 579 participants have 8 to 14 years of clinical follow-up for mortality (187 deaths observed). A secondary cohort of 100 members was independently selected from the Estonian Biobank to span a wide range of ages (20-60 years) at the time of sample collection.
Framingham cohort
The Framingham Offspring cohort includes children of the original Framingham Heart Study participants, recruited in 1971 [88]. Of the entire cohort, 1,479 participants in the fifth examination cycle (between 1991 and 1995) consented to both metabolomic profiling and broad research use of their samples. These form the Framingham Offspring metabolomic cohort used in this study [89], with an age range of 30 to 79 years at blood draw and 30-40 years of clinical follow-up (232 deaths observed).
TwinsUK cohort
The TwinsUK cohort used in this study comprises the 1,761 individuals for whom glucuronic acid level measurements and matching covariate measurements were available [90], with a mean age of 64.9 ± 8.4 years at blood draw and approximately 5 years of clinical follow-up (47 deaths observed).
BIOAGE mouse study
300 female mice were bred by Vium (San Mateo, CA, USA) as a four-way cross among DBA/2J, C3H/HeJ, BALB/cJ, and C57BL/6J mice purchased from Jackson Laboratories (Sacramento, CA, USA). The mice were housed with Vium from birth onwards and allowed to age naturally without interventions other than regular weighing, blood collection, and humane euthanasia. For metabolite profiling, approximately 150 uL of whole blood was collected via submental (primary) or submandibular (secondary) technique from each of the 196 mice still surviving at 27 months of age. Collected blood was allowed to clot without additive and centrifuged, and serum was subsequently extracted. Mice continued to be monitored through 33 months of age, with 106 recorded deaths occurring after the blood draw.
Metabolite profiling
For the Estonian Biobank cohorts, non-fasting plasma samples were collected from each participant at enrollment and stored in liquid nitrogen, then shipped to the Broad Institute (Cambridge, MA, USA) for metabolomic profiling via liquid chromatography-mass spectrometry (LC-MS) as previously described [91]. Briefly, metabolites were extracted from plasma samples with four methods: (1) amines and polar metabolites were extracted with a mixture of acetonitrile and methanol and separated with a HILIC column under acidic mobile phase conditions; (2) central metabolites and negatively ionizing polar metabolites were extracted using 80% methanol and separated with a HILIC column under basic conditions; (3) free fatty acids, bile acids, and metabolites of intermediate polarity were extracted using 100% methanol and separated with reverse phase chromatography on a T3 ULPC column; lastly, (4) lipids were extracted using 100% isopropanol and separated with reverse phase chromatography on a C4 column. For the Framingham Offspring metabolomics cohort, fasting plasma samples were collected from participants during the fifth examination cycle and stored at -80°C until metabolite profiling as previously described (Wang et al., 2011; dbGap ID phs000007.v30.p11), comprising of the targeted identification and quantification of 217 metabolites with liquid chromatography-tandem mass spectrometry. For the TwinsUK metabolomics cohort, fasting serum samples were collected from participants and stored at -80°C until analysis using ultra-high performance liquid chromatography-tandem mass spectrometry by Metabolon, Inc. (Research Triangle Park, NC, USA) as previously described [92]. For the murine cohort, whole blood samples were drawn at day 800 of the study; serum was prepared as described above and sent to the West Coast Metabolomics Center (Davis, CA, USA) for untargeted metabolomics profiling via GC-TOF MS/MS.
Statistical analyses
Raw metabolite intensity values were corrected for instrumental drift and underwent rank inverse normal transformation [93]. Missing covariate data were imputed as the dataset mean, and final study results underwent sensitivity analysis to demonstrate that the imputation did not cause substantive changes. Hazard ratios and p-values for all-cause mortality were determined by fitting a Cox proportional hazards model with each metabolite (e.g. glucuronic acid) as the main predictor and including as clinical covariates age, sex, smoking status, body mass index, systolic blood pressure, and diastolic blood pressure [94]. Kaplan-Meier survival curves for the upper and lower quartiles of glucuronic acid level were plotted and the log-rank test was used to test for differences between the curves. In the TwinsUK cohort, analysis also took into account family relatedness. Validation analyses for mortality in the Framingham Offspring and TwinsUK cohorts were performed using one-sided statistical tests; all other comparisons used two-sided tests.
Correlations between glucuronic acid levels and age were calculated using Pearson’s r. Multivariate linear regression was used to calculate the association, corrected for clinical covariates, of glucuronic acid levels with age, grip strength, walking speed, and forced expiratory volume in 1 second (FEV1), respectively. Multivariate logistic regression was used to calculate the association of glucuronic acid levels with housework capability, corrected for clinical covariates. Multivariate ordinal regression via a cumulative link model was used to calculate the association of glucuronic acid levels with subjective overall health, corrected for clinical covariates [95]. In all cases, clinical covariates were selected as in the mortality analyses. The healthspan-related phenotypes above were measured in the eighth examination cycle for the Framingham Offspring cohort. All statistical analyses and generation of graphics were performed with R version 3.3.3 [96].
Author Contributions
AH and JS performed statistical analyses for the Estonian Biobank and Framingham Offspring data. AH, JS, EM, and K Fortney wrote the paper. TE and K Fischer provided the Estonian Biobank cohort data. CM, JZ, and MMH performed statistical analyses for the TwinsUK data. K Fortney and EM conceived the study, and with TE and K Fischer designed the Estonian Biobank cohort subset.
Acknowledgments
We thank the Broad Institute for the metabolomic profiling of the Estonian Biobank cohorts and the West Coast Metabolomics Center for the metabolomic profiling of the longitudinal murine cohort.
Conflicts of Interest
AH, JS, EM, and K Fortney were employed by BIOAGE during the course of this study.
Funding
BIOAGE provided financial support for this research. TE and K Fischer were supported by the Estonian Research Council (PUT1660 to TE, PUT1665P to K Fischer). The Estonian Genome Center was supported by the European Union Horizon 2020 (692145), the European Union through the European Regional Development Fund (2014-2020.4.01.15-0012 GENTRANSMED), and the Estonian Center of Genomics/Roadmap II (project No. 2014-2020.4.01.16-0125). TwinsUK receives funding from the Wellcome Trust European Community’s Seventh Framework Programme (FP7/2007-2013 to TwinsUK); the National Institute for Health Research (NIHR) Clinical Research Facility at Guy’s and St Thomas’ NHS Foundation Trust and NIHR Biomedical Research Centre based at Guy's and St Thomas’ NHS Foundation Trust and King’s College London. HLI collaborated with King’s College London to produce the metabolomics data from Metabolon Inc. CM is funded by the MRC AIM HY (MR/M016560/1) stratified medicines grant.
References
- 1. Fujiwara R, Yoda E, Tukey RH. Species differences in drug glucuronidation: humanized UDP-glucuronosyltransferase 1 mice and their application for predicting drug glucuronidation and drug-induced toxicity in humans. Drug Metab Pharmacokinet. 2018; 33:9–16. https://doi.org/10.1016/j.dmpk.2017.10.002 [PubMed]
- 2. Miettinen TA, Leskinen E. Glucuronic Acid Pathway. In: Fishman WH, editor. Metabolic Conjugation and Metabolic Hydrolysis. Academic Press; 1970. pp. 157–237. https://doi.org/10.1016/B978-0-12-257601-0.50011-6
- 3. Miles KK, Stern ST, Smith PC, Kessler FK, Ali S, Ritter JK. An investigation of human and rat liver microsomal mycophenolic acid glucuronidation: evidence for a principal role of UGT1A enzymes and species differences in UGT1A specificity. Drug Metab Dispos. 2005; 33:1513–20. https://doi.org/10.1124/dmd.105.004663 [PubMed]
- 4. Miners JO, Mackenzie PI. Drug glucuronidation in humans. Pharmacol Ther. 1991; 51:347–69. https://doi.org/10.1016/0163-7258(91)90065-T [PubMed]
- 5. Silva MJ, Barr DB, Reidy JA, Kato K, Malek NA, Hodge CC, Hurtz D
3rd , Calafat AM, Needham LL, Brock JW. Glucuronidation patterns of common urinary and serum monoester phthalate metabolites. Arch Toxicol. 2003; 77:561–67. https://doi.org/10.1007/s00204-003-0486-3 [PubMed] - 6. Simola PE. Glucuronic acid metabolism in guinea pigs. Acta Physiol Scand. 1954; 31:263–67. https://doi.org/10.1111/j.1748-1716.1954.tb01137.x [PubMed]
- 7. Meech R, Miners JO, Lewis BC, Mackenzie PI. The glycosidation of xenobiotics and endogenous compounds: versatility and redundancy in the UDP glycosyltransferase superfamily. Pharmacol Ther. 2012; 134:200–18. https://doi.org/10.1016/j.pharmthera.2012.01.009 [PubMed]
- 8. Rowland A, Miners JO, Mackenzie PI. The UDP-glucuronosyltransferases: their role in drug metabolism and detoxification. Int J Biochem Cell Biol. 2013; 45:1121–32. https://doi.org/10.1016/j.biocel.2013.02.019 [PubMed]
- 9. Carmody RN, Turnbaugh PJ. Host-microbial interactions in the metabolism of therapeutic and diet-derived xenobiotics. J Clin Invest. 2014; 124:4173–81. https://doi.org/10.1172/JCI72335 [PubMed]
- 10. Roberts MS, Magnusson BM, Burczynski FJ, Weiss M. Enterohepatic circulation: physiological, pharmacokinetic and clinical implications. Clin Pharmacokinet. 2002; 41:751–90. https://doi.org/10.2165/00003088-200241100-00005 [PubMed]
- 11. Fishman WH. Beta-glucuronidase and the action of steroid hormones. Ann N Y Acad Sci. 1951; 54:548–57. [PubMed]
- 12. Dabek M, McCrae SI, Stevens VJ, Duncan SH, Louis P. Distribution of β-glucosidase and β-glucuronidase activity and of β-glucuronidase gene gus in human colonic bacteria. FEMS Microbiol Ecol. 2008; 66:487–95. https://doi.org/10.1111/j.1574-6941.2008.00520.x [PubMed]
- 13. Gloux K, Berteau O, El Oumami H, Béguet F, Leclerc M, Doré J. A metagenomic β-glucuronidase uncovers a core adaptive function of the human intestinal microbiome. Proc Natl Acad Sci USA. 2011 (Suppl 1); 108:4539–46. https://doi.org/10.1073/pnas.1000066107 [PubMed]
- 14. Hawksworth G, Drasar BS, Hill MJ. Intestinal bacteria and the hydrolysis of glycosidic bonds. J Med Microbiol. 1971; 4:451–59. https://doi.org/10.1099/00222615-4-4-451 [PubMed]
- 15. Banerjee S, Wang Y, Solt LA, Griffett K, Kazantzis M, Amador A, El-Gendy BM, Huitron-Resendiz S, Roberts AJ, Shin Y, Kamenecka TM, Burris TP. Pharmacological targeting of the mammalian clock regulates sleep architecture and emotional behaviour. Nat Commun. 2014; 5:5759. https://doi.org/10.1038/ncomms6759 [PubMed]
- 16. Humblot C, Murkovic M, Rigottier-Gois L, Bensaada M, Bouclet A, Andrieux C, Anba J, Rabot S. β-glucuronidase in human intestinal microbiota is necessary for the colonic genotoxicity of the food-borne carcinogen 2-amino-3-methylimidazo[4,5-f]quinoline in rats. Carcinogenesis. 2007; 28:2419–25. https://doi.org/10.1093/carcin/bgm170 [PubMed]
- 17. Knasmüller S, Steinkellner H, Hirschl AM, Rabot S, Nobis EC, Kassie F. Impact of bacteria in dairy products and of the intestinal microflora on the genotoxic and carcinogenic effects of heterocyclic aromatic amines. Mutat Res. 2001; 480-481:129–38. https://doi.org/10.1016/S0027-5107(01)00176-2 [PubMed]
- 18. Esko JD, Kimata K, Lindahl U. Proteoglycans and Sulfated Glycosaminoglycans. In: Varki A, Cummings RD, Esko JD, Freeze HH, Stanley P, Bertozzi CR, Hart GW, Etzler ME, editors. Essentials of Glycobiology. ed. Cold Spring Harbor (NY): Cold Spring Harbor Laboratory Press; 2009. https://doi.org/10.1134/s0006297909090156
- 19. Helting T, Lindahl U, Gramstad T, Songstad J, Pilotti Å. Biosynthesis of heparin. I. Transfer of N-acetylglucosamine and glucuronic acid to low-molecular weight heparin fragments. Acta Chem Scand. 1972; 26:3515–23. https://doi.org/10.3891/acta.chem.scand.26-3515 [PubMed]
- 20. Rees SG, Hughes W, Embery G. Interaction of glucuronic acid and iduronic acid-rich glycosaminoglycans and their modified forms with hydroxyapatite. Biomaterials. 2002; 23:481–89. https://doi.org/10.1016/S0142-9612(01)00130-2 [PubMed]
- 21. Naz H, Islam A, Waheed A, Sly WS, Ahmad F, Hassan I. Human β-glucuronidase: structure, function, and application in enzyme replacement therapy. Rejuvenation Res. 2013; 16:352–63. https://doi.org/10.1089/rej.2013.1407 [PubMed]
- 22. Fishman WH, Smith M, Thompson DB, Bonner CD, Kasdon SC, Homburger F. Investigation of glucuronic acid metabolism in human subjects. J Clin Invest. 1951; 30:685–96. https://doi.org/10.1172/JCI102481 [PubMed]
- 23. Freeman S, Kanabrocki EL, Inman CW. The influence of diet and of exogenous glucuronolactone or glucuronate upon the urinary and serum glucuronic acid of adult human subjects. J Lab Clin Med. 1956; 47:583–91. [PubMed]
- 24. Al-Gayyar MM, Ebrahim MA, Shams ME. Measuring serum levels of glycosaminoglycans for prediction and using viscum fraxini-2 for treatment of patients with hepatocellular carcinoma. J Pharm Res. 2013; 7:571–75. https://doi.org/10.1016/j.jopr.2013.07.016
- 25. Saltzman A, Caraway WT, Beck IA. Serum glucuronic acid levels in diabetes mellitus. Metabolism. 1954; 3:11–15. [PubMed]
- 26. Saltzman A, Caraway WT. Cinnamic acid as a test substance in the evaluation of liver function. J Clin Invest. 1953; 32:711–19. https://doi.org/10.1172/JCI102785 [PubMed]
- 27. Uji M, Yokoyama Y, Ohbuchi K, Tsuchiya K, Sadakane C, Shimobori C, Yamamoto M, Nagino M. Exploration of serum biomarkers for predicting the response to Inchinkoto (ICKT), a Japanese traditional herbal medicine. Metabolomics. 2017; 13:155. https://doi.org/10.1007/s11306-017-1292-x [PubMed]
- 28. Winegrad AI, Burden CL. Hyperactivity of the glucuronic acid pathway in diabetes mellitus. Trans Assoc Am Physicians. 1965; 78:158–73. [PubMed]
- 29. Green S, Anstiss C, Fishman WH. Determination of unconjugated glucuronic acid in deproteinized human blood. Biochim Biophys Acta. 1962; 62:574–75. https://doi.org/10.1016/0006-3002(62)90240-8 [PubMed]
- 30. Müting D, Kalk JF, Fischer R, Wuzel H, Reikowski J. Hepatic detoxification and hepatic function in chronic active hepatitis with and without cirrhosis. Dig Dis Sci. 1988; 33:41–46. https://doi.org/10.1007/BF01536629 [PubMed]
- 31. Mindikoglu AL, Opekun AR, Putluri N, Devaraj S, Sheikh-Hamad D, Vierling JM, Goss JA, Rana A, Sood GK, Jalal PK, Inker LA, Mohney RP, Tighiouart H, et al. Unique metabolomic signature associated with hepatorenal dysfunction and mortality in cirrhosis. Transl Res. 2018; 195:25–47. https://doi.org/10.1016/j.trsl.2017.12.002 [PubMed]
- 32. Baigent C, Keech A, Kearney PM, Blackwell L, Buck G, Pollicino C, Kirby A, Sourjina T, Peto R, Collins R, Simes R, and Cholesterol Treatment Trialists’ (CTT) Collaborators. Efficacy and safety of cholesterol-lowering treatment: prospective meta-analysis of data from 90,056 participants in 14 randomised trials of statins. Lancet. 2005; 366:1267–78. https://doi.org/10.1016/S0140-6736(05)67394-1 [PubMed]
- 33. Ettehad D, Emdin CA, Kiran A, Anderson SG, Callender T, Emberson J, Chalmers J, Rodgers A, Rahimi K. Blood pressure lowering for prevention of cardiovascular disease and death: a systematic review and meta-analysis. Lancet. 2016; 387:957–67. https://doi.org/10.1016/S0140-6736(15)01225-8 [PubMed]
- 34. Peto MV, De la Guardia C, Winslow K, Ho A, Fortney K, Morgen E. MortalityPredictors.org: a manually-curated database of published biomarkers of human all-cause mortality. Aging (Albany NY). 2017; 9:1916–25. https://doi.org/10.18632/aging.101280 [PubMed]
- 35. Wallace BD, Roberts AB, Pollet RM, Ingle JD, Biernat KA, Pellock SJ, Venkatesh MK, Guthrie L, O’Neal SK, Robinson SJ, Dollinger M, Figueroa E, McShane SR, et al. Structure and Inhibition of Microbiome β-Glucuronidases Essential to the Alleviation of Cancer Drug Toxicity. Chem Biol. 2015; 22:1238–49. https://doi.org/10.1016/j.chembiol.2015.08.005 [PubMed]
- 36. Gillette JR, Mitchell JR, Brodie BB. Biochemical Mechanisms of Drug Toxicity. Annual Review of Pharmacology. 1974; 14:271–288. https://doi.org/10.1146/annurev.pa.14.040174.001415
- 37. Latini G. Monitoring phthalate exposure in humans. Clin Chim Acta. 2005; 361:20–29. https://doi.org/10.1016/j.cccn.2005.05.003 [PubMed]
- 38. Zhou C, Tabb MM, Nelson EL, Grün F, Verma S, Sadatrafiei A, Lin M, Mallick S, Forman BM, Thummel KE, Blumberg B. Mutual repression between steroid and xenobiotic receptor and NF-kappaB signaling pathways links xenobiotic metabolism and inflammation. J Clin Invest. 2006; 116:2280–89. https://doi.org/10.1172/JCI26283 [PubMed]
- 39. Raftogianis R, Creveling C, Weinshilboum R, Weisz J. Estrogen Metabolism by Conjugation. J Natl Cancer Inst Monogr. 2000; 27:113–24. https://doi.org/10.1093/oxfordjournals.jncimonographs.a024234 [PubMed]
- 40. Yager JD, Davidson NE. Estrogen carcinogenesis in breast cancer. N Engl J Med. 2006; 354:270–82. https://doi.org/10.1056/NEJMra050776 [PubMed]
- 41. Crotty B. Ulcerative colitis and xenobiotic metabolism. Lancet. 1994; 343:35–38. https://doi.org/10.1016/S0140-6736(94)90882-6 [PubMed]
- 42. Goldin BR. In Situ Bacterial Metabolism and Colon Mutagens. Annu Rev Microbiol. 1986; 40:367–93. https://doi.org/10.1146/annurev.micro.40.1.367 [PubMed]
- 43. Langmann T, Schmitz G. Loss of detoxification in inflammatory bowel disease. Nat Clin Pract Gastroenterol Hepatol. 2006; 3:358–59. https://doi.org/10.1038/ncpgasthep0545 [PubMed]
- 44. Wells PG, Mackenzie PI, Chowdhury JR, Guillemette C, Gregory PA, Ishii Y, Hansen AJ, Kessler FK, Kim PM, Chowdhury NR, Ritter JK. Glucuronidation and the UDP-glucuronosyltransferases in health and disease. Drug Metab Dispos. 2004; 32:281–90. https://doi.org/10.1124/dmd.32.3.281 [PubMed]
- 45. Franceschi C, Campisi J. Chronic inflammation (inflammaging) and its potential contribution to age-associated diseases. J Gerontol A Biol Sci Med Sci. 2014 (Suppl 1); 69:S4–9. https://doi.org/10.1093/gerona/glu057 [PubMed]
- 46. Mroczyńska M, Libudzisz Z. Beta-glucuronidase and beta-glucosidase activity of Lactobacillus and Enterococcus isolated from human feces. Pol J Microbiol. 2010; 59:265–69. [PubMed]
- 47. Claesson MJ, Jeffery IB, Conde S, Power SE, O’Connor EM, Cusack S, Harris HM, Coakley M, Lakshminarayanan B, O’Sullivan O, Fitzgerald GF, Deane J, O’Connor M, et al. Gut microbiota composition correlates with diet and health in the elderly. Nature. 2012; 488:178–84. https://doi.org/10.1038/nature11319 [PubMed]
- 48. Jie Z, Xia H, Zhong SL, Feng Q, Li S, Liang S, Zhong H, Liu Z, Gao Y, Zhao H, Zhang D, Su Z, Fang Z, et al. The gut microbiome in atherosclerotic cardiovascular disease. Nat Commun. 2017; 8:845. https://doi.org/10.1038/s41467-017-00900-1 [PubMed]
- 49. Larsen N, Vogensen FK, van den Berg FW, Nielsen DS, Andreasen AS, Pedersen BK, Al-Soud WA, Sørensen SJ, Hansen LH, Jakobsen M. Gut microbiota in human adults with type 2 diabetes differs from non-diabetic adults. PLoS One. 2010; 5:e9085. https://doi.org/10.1371/journal.pone.0009085 [PubMed]
- 50. Hill JM, Clement C, Pogue AI, Bhattacharjee S, Zhao Y, Lukiw WJ. Pathogenic microbes, the microbiome, and Alzheimer’s disease (AD). Front Aging Neurosci. 2014; 6:127. https://doi.org/10.3389/fnagi.2014.00127 [PubMed]
- 51. Ramezani A, Raj DS. The gut microbiome, kidney disease, and targeted interventions. J Am Soc Nephrol. 2014; 25:657–70. https://doi.org/10.1681/ASN.2013080905 [PubMed]
- 52. Zhu L, Baker SS, Gill C, Liu W, Alkhouri R, Baker RD, Gill SR. Characterization of gut microbiomes in nonalcoholic steatohepatitis (NASH) patients: a connection between endogenous alcohol and NASH. Hepatology. 2013; 57:601–09. https://doi.org/10.1002/hep.26093 [PubMed]
- 53. Singh RK, Chang HW, Yan D, Lee KM, Ucmak D, Wong K, Abrouk M, Farahnik B, Nakamura M, Zhu TH, Bhutani T, Liao W. Influence of diet on the gut microbiome and implications for human health. J Transl Med. 2017; 15:73. https://doi.org/10.1186/s12967-017-1175-y [PubMed]
- 54. Zhu Y, Lin X, Li H, Li Y, Shi X, Zhao F, Xu X, Li C, Zhou G. Intake of Meat Proteins Substantially Increased the Relative Abundance of Genus Lactobacillus in Rat Feces. PLoS One. 2016; 11:e0152678. https://doi.org/10.1371/journal.pone.0152678 [PubMed]
- 55. Reddy BS, Weisburger JH, Wynder EL. Fecal bacterial beta-glucuronidase: control by diet. Science. 1974; 183:416–17. https://doi.org/10.1126/science.183.4123.416 [PubMed]
- 56. Wolk A. Potential health hazards of eating red meat. J Intern Med. 2017; 281:106–22. https://doi.org/10.1111/joim.12543 [PubMed]
- 57. Holscher HD. Dietary fiber and prebiotics and the gastrointestinal microbiota. Gut Microbes. 2017; 8:172–84. https://doi.org/10.1080/19490976.2017.1290756 [PubMed]
- 58. Manoj G, Thampi H, Leelamma S, Menon VP. Dietary fiber and activity of intestinal tissue ß-glucuronidase in rats. Nutr Res. 1993; 13:575–82. https://doi.org/10.1016/S0271-5317(05)80684-0
- 59. Manoj G, Thampi BS, Leelamma S, Menon PV. Effect of dietary fiber on the activity of intestinal and fecal beta-glucuronidase activity during 1,2-dimethylhydrazine induced colon carcinogenesis. Plant Foods Hum Nutr. 2001; 56:13–21. https://doi.org/10.1023/A:1008188009174 [PubMed]
- 60. Rao CV, Chou D, Simi B, Ku H, Reddy BS. Prevention of colonic aberrant crypt foci and modulation of large bowel microbial activity by dietary coffee fiber, inulin and pectin. Carcinogenesis. 1998; 19:1815–19. https://doi.org/10.1093/carcin/19.10.1815 [PubMed]
- 61. Khaw KT, Barrett-Connor E. Dietary fiber and reduced ischemic heart disease mortality rates in men and women: a 12-year prospective study. Am J Epidemiol. 1987; 126:1093–102. https://doi.org/10.1093/oxfordjournals.aje.a114748 [PubMed]
- 62. Park Y, Subar AF, Hollenbeck A, Schatzkin A. Dietary fiber intake and mortality in the NIH-AARP diet and health study. Arch Intern Med. 2011; 171:1061–68. https://doi.org/10.1001/archinternmed.2011.18 [PubMed]
- 63. Krishnamurthy VM, Wei G, Baird BC, Murtaugh M, Chonchol MB, Raphael KL, Greene T, Beddhu S. High dietary fiber intake is associated with decreased inflammation and all-cause mortality in patients with chronic kidney disease. Kidney Int. 2012; 81:300–06. https://doi.org/10.1038/ki.2011.355 [PubMed]
- 64. Kim DH, Kang HJ, Kim SW, Kobashi K. pH-inducible beta-glucosidase and beta-glucuronidase of intestinal bacteria. Chem Pharm Bull (Tokyo). 1992; 40:1667–69. https://doi.org/10.1248/cpb.40.1667 [PubMed]
- 65. Kim DH, Kang HJ, Park SH, Kobashi K. Characterization of beta-glucosidase and beta-glucuronidase of alkalotolerant intestinal bacteria. Biol Pharm Bull. 1994; 17:423–26. https://doi.org/10.1248/bpb.17.423 [PubMed]
- 66. Anders MW. Metabolism of drugs by the kidney. Kidney Int. 1980; 18:636–47. https://doi.org/10.1038/ki.1980.181 [PubMed]
- 67. Christensen G, Herum KM, Lunde IG. Sweet, yet underappreciated: proteoglycans and extracellular matrix remodeling in heart disease. Matrix Biol. 2019; 75-76:286–99. https://doi.org/10.1016/j.matbio.2018.01.001 [PubMed]
- 68. Jacob MP. Extracellular matrix remodeling and matrix metalloproteinases in the vascular wall during aging and in pathological conditions. Biomed Pharmacother. 2003; 57:195–202. https://doi.org/10.1016/S0753-3322(03)00065-9 [PubMed]
- 69. Kular JK, Basu S, Sharma RI. The extracellular matrix: Structure, composition, age-related differences, tools for analysis and applications for tissue engineering. J Tissue Eng. 2014; 5:2041731414557112. https://doi.org/10.1177/2041731414557112 [PubMed]
- 70. De Ceuninck F, Sabatini M, Pastoureau P. Recent progress toward biomarker identification in osteoarthritis. Drug Discov Today. 2011; 16:443–49. https://doi.org/10.1016/j.drudis.2011.01.004 [PubMed]
- 71. Moseley R, Stewart JE, Stephens P, Waddington RJ, Thomas DW. Extracellular matrix metabolites as potential biomarkers of disease activity in wound fluid: lessons learned from other inflammatory diseases? Br J Dermatol. 2004; 150:401–13. https://doi.org/10.1111/j.1365-2133.2004.05845.x [PubMed]
- 72. Willumsen N, Bager CL, Leeming DJ, Smith V, Christiansen C, Karsdal MA, Dornan D, Bay-Jensen AC. Serum biomarkers reflecting specific tumor tissue remodeling processes are valuable diagnostic tools for lung cancer. Cancer Med. 2014; 3:1136–45. https://doi.org/10.1002/cam4.303 [PubMed]
- 73. Aits S, Jäättelä M. Lysosomal cell death at a glance. J Cell Sci. 2013; 126:1905–12. https://doi.org/10.1242/jcs.091181 [PubMed]
- 74. Boya P, Kroemer G. Lysosomal membrane permeabilization in cell death. Oncogene. 2008; 27:6434–51. https://doi.org/10.1038/onc.2008.310 [PubMed]
- 75. Chayen J, Bitensky L, Ubhi GS. The experimental modification of lysosomal dysfunction by anti-inflammatory drugs acting in vitro. Beitr Pathol. 1972; 147:6–20. https://doi.org/10.1016/S0005-8165(72)80005-2 [PubMed]
- 76. Gornicka A, Fettig J, Eguchi A, Berk MP, Thapaliya S, Dixon LJ, Feldstein AE. Adipocyte hypertrophy is associated with lysosomal permeability both in vivo and in vitro: role in adipose tissue inflammation. Am J Physiol Endocrinol Metab. 2012; 303:E597–606. https://doi.org/10.1152/ajpendo.00022.2012 [PubMed]
- 77. Guicciardi ME, Leist M, Gores GJ. Lysosomes in cell death. Oncogene. 2004; 23:2881–90. https://doi.org/10.1038/sj.onc.1207512 [PubMed]
- 78. Karch J, Schips TG, Maliken BD, Brody MJ, Sargent MA, Kanisicak O, Molkentin JD. Autophagic cell death is dependent on lysosomal membrane permeability through Bax and Bak. eLife. 2017; 6:6. https://doi.org/10.7554/eLife.30543 [PubMed]
- 79. Kavčič N, Pegan K, Turk B. Lysosomes in programmed cell death pathways: from initiators to amplifiers. Biol Chem. 2017; 398:289–301. https://doi.org/10.1515/hsz-2016-0252 [PubMed]
- 80. George J. Elevated serum β-glucuronidase reflects hepatic lysosomal fragility following toxic liver injury in rats. Biochem Cell Biol. 2008; 86:235–43. https://doi.org/10.1139/O08-038 [PubMed]
- 81. Shimoi K, Nakayama T. Glucuronidase Deconjugation in Inflammation. Methods Enzymol. 2005; 400:263–72. https://doi.org/10.1016/s0076-6879(05)00015-7 [PubMed]
- 82. Weyel D, Sedlacek HH, Müller R, Brüsselbach S. Secreted human β-glucuronidase: a novel tool for gene-directed enzyme prodrug therapy. Gene Ther. 2000; 7:224–31. https://doi.org/10.1038/sj.gt.3301072 [PubMed]
- 83. Lewis SS, Hutchinson MR, Zhang Y, Hund DK, Maier SF, Rice KC, Watkins LR. Glucuronic acid and the ethanol metabolite ethyl-glucuronide cause toll-like receptor 4 activation and enhanced pain. Brain Behav Immun. 2013; 30:24–32. https://doi.org/10.1016/j.bbi.2013.01.005 [PubMed]
- 84. Balistreri CR, Colonna-Romano G, Lio D, Candore G, Caruso C. TLR4 polymorphisms and ageing: implications for the pathophysiology of age-related diseases. J Clin Immunol. 2009; 29:406–15. https://doi.org/10.1007/s10875-009-9297-5 [PubMed]
- 85. Ghosh S, Lertwattanarak R, Garduño JJ, Galeana JJ, Li J, Zamarripa F, Lancaster JL, Mohan S, Hussey S, Musi N. Elevated muscle TLR4 expression and metabolic endotoxemia in human aging. J Gerontol A Biol Sci Med Sci. 2015; 70:232–46. https://doi.org/10.1093/gerona/glu067 [PubMed]
- 86. Go M, Kou J, Lim JE, Yang J, Fukuchi KI. Microglial response to LPS increases in wild-type mice during aging but diminishes in an Alzheimer’s mouse model: implication of TLR4 signaling in disease progression. Biochem Biophys Res Commun. 2016; 479:331–37. https://doi.org/10.1016/j.bbrc.2016.09.073 [PubMed]
- 87. Leitsalu L, Haller T, Esko T, Tammesoo ML, Alavere H, Snieder H, Perola M, Ng PC, Mägi R, Milani L, Fischer K, Metspalu A. Cohort Profile: Estonian Biobank of the Estonian Genome Center, University of Tartu. Int J Epidemiol. 2015; 44:1137–47. https://doi.org/10.1093/ije/dyt268 [PubMed]
- 88. Kannel WB, Feinleib M, McNamara PM, Garrison RJ, Castelli WP. An investigation of coronary heart disease in families. The Framingham offspring study. Am J Epidemiol. 1979; 110:281–90. https://doi.org/10.1093/oxfordjournals.aje.a112813 [PubMed]
- 89. Rhee EP, Ho JE, Chen MH, Shen D, Cheng S, Larson MG, Ghorbani A, Shi X, Helenius IT, O’Donnell CJ, Souza AL, Deik A, Pierce KA, et al. A genome-wide association study of the human metabolome in a community-based cohort. Cell Metab. 2013; 18:130–43. https://doi.org/10.1016/j.cmet.2013.06.013 [PubMed]
- 90. Menni C, Kastenmüller G, Petersen AK, Bell JT, Psatha M, Tsai PC, Gieger C, Schulz H, Erte I, John S, Brosnan MJ, Wilson SG, Tsaprouni L, et al. Metabolomic markers reveal novel pathways of ageing and early development in human populations. Int J Epidemiol. 2013; 42:1111–19. https://doi.org/10.1093/ije/dyt094 [PubMed]
- 91. Esko T, Hirschhorn JN, Feldman HA, Hsu YH, Deik AA, Clish CB, Ebbeling CB, Ludwig DS. Metabolomic profiles as reliable biomarkers of dietary composition. Am J Clin Nutr. 2017; 105:547–54. https://doi.org/10.3945/ajcn.116.144428 [PubMed]
- 92. Long T, Hicks M, Yu HC, Biggs WH, Kirkness EF, Menni C, Zierer J, Small KS, Mangino M, Messier H, Brewerton S, Turpaz Y, Perkins BA, et al. Whole-genome sequencing identifies common-to-rare variants associated with human blood metabolites. Nat Genet. 2017; 49:568–78. https://doi.org/10.1038/ng.3809 [PubMed]
- 93. Blom G. Statistical estimates and transformed beta-variables. Wiley, New York, Almquist und Wiksell, Stockholm. 1958. https://doi.org/10.1002/bimj.19610030410
- 94. Cox DR. Regression Models and Life-Tables. J R Stat Soc Ser B. 1972; 34:187–220. https://doi.org/10.1111/j.2517-6161.1972.tb00899.x
- 95. Agresti A. Categorical data analysis. ed. New York: Wiley-Interscience; 2002. p. 710. https://doi.org/10.1002/0471249688
- 96. R Development Core Team. R: A Language and Environment for Statistical Computing Vienna. Austria: R Foundation for Statistical Computing; 2008.