


Introduction
Hepatocellular carcinoma (HCC) represents one of the highest morbidity and mortality occurring cancers worldwide [1, 2]. Despite continued improvement in both improving early detection and developing novel therapeutic strategies, the prognosis of HCC patients remained poor [3]. Therefore, it is vital to dissect the detailed molecular mechanisms regulating the aggressive behaviours of HCC to benefit novel therapeutics targeting HCC.
Aging is a universal phenomenon and can’t be reversed. It is defined as the gradual degeneration of the physical, psychological, and biological state over time, starting after reaching adulthood (reproductive maturity), and eventually leading to disease [4]. Aging is considered as a major risk factor in various diseases, such as neurological disorders, cardiovascular malfunctions, metabolic disruptions, immunological abnormalities and cancer [5]. Cellular senescence is defined as a state of irreversible growth arrest and leads to a senescent phenotype, which is characterized by upregulated senescence-associated β-galactosidase (SA-β-gal) activity, cell cycle arrest and cell proliferation inhibition [6, 7]. It is reported that cellular senescence is a key obstacle to the initiation and progression of HCC [8]. Therefore, anticancer treatments based on pro-senescent therapies should be a promising strategy.
Long noncoding RNAs (lncRNAs), >200nt, lack the potential for protein coding [9]. Increasing research has shown that numerous human cancer events associated with dysregulation of lncRNAs, and several lncRNAs have been recognized as prognostic biomarkers with positive therapeutic effects in cancers [10–12]. Emerging evidences have shown that many well-known and novel lncRNAs are associated with initiation and progression of senescence in mammals [13, 14]. Therefore, understanding the correlation between the progression of cellular senescence and tumor suppression and exploring the underlying mechanisms would provide a potential means to investigate novel therapeutic strategies for age-related diseases [15].
With this aim, using bioinformatics analysis, we analyzed differentially expressed lncRNAs during replicative senescence and HCC tumorigenesis and focused on the lncRNA myocardial infarction-associated transcript (miat). Existing evidences have shown that abnormal expression of LncRNA miat is linked to various cancers, such as breast cancer [16], gastric cancer [17], non-small cell lung cancer [18] and neuroendocrine prostate cancer [19]. Study also showed that miat silencing led to proliferation defects and senescence phenotype in human fibroblast WI-38 cells [20]. In addition, it is reported that miat has a negative regulatory effect on G1/S phase arrest of human cell cycle, suggesting that miat may play an important role in the regulation of cell proliferation. Here, we found that the expression level of miat decreased in cellular senescence, and that miat silencing significantly promoted cellular senescence. Furthermore, miat was frequently upregulated in human HCC and knockdown of miat inhibited HCC progression.
LncRNAs can also act as microRNA (miRNA or miR) ‘sponges’, reducing the abundance of their target miRNAs, indirectly regulating gene or mRNA function. MiRNAs are small non-coding RNAs which regulate the expression of target genes at post-transcriptional levels. Currently, studies have shown that miat can interact with different miRNAs in a variety of cancers, including miR-93 [21], miR-181b [22], miR-155-5p [23] and miR-124 [24]. According to the prediction of target prediction programs and experimental analysis, we found that miat was a potential target of miR-22-3p and negatively regulated the expression of miR-22-3p. In addition, miR-22-3p is essential for sustaining senescence-like phenotypes and inhibiting hepatic induction by the senescence-associated lncRNA miat (SAL- miat).
Sirtuins (Sir2) are NAD+-dependent histone deacetylases (HDAC) in Saccharomyces cerevisiae. A number of studies have shown that sirt1 can delay cellular senescence by inhibiting apoptosis, regulating metabolism (calorie consumption, fat storage, etc.), maintaining normal mitochondrial functions under oxidative stress and inhibiting inflammation [25]. Increasing research suggested that sirt1 could be a promising therapeutic target for cancer prevention and therapy [26]. In our study, sirt1 is identified as a direct target of miR-22-3p. LncRNA miat acted as a competitive endogenous RNA (ceRNA) for miR-22-3p to regulate sirt1 expression. The restoration of sirt1 expression reversed the cellular senescence and HCC progression induced by miR-22-3p and miat silencing.
Either or both of the p53/p21 and p16/pRb tumor suppressive pathways, respond to somewhat different stimuli that induce cellular senescence establish and/or maintain the senescence growth arrest [27–29]. There are multiple upstream regulators, downstream effectors and modified side branches in both pathways, and they also regulate several other features of senescent cells, such as SASP and cell proliferation. Our study found that miat silencing inhibited the cell proliferation of HCC cells and stimulated senescent HCC cells to secrete SASP by activating the p53/p21 and p16/pRb tumor suppressor pathways.
In summary, our study demonstrated a novel HCC specific SA-LncRNA miat, and found that miat functions as a ceRNA for miR-22-3p to upregulate sirt1 in HCC cellular senescence. Furthermore, miat downregulation promoted the progression of senescence and activated the tumor suppressor pathway p53/p21 and p16/pRb, which promoted the production of SASP and contributed to tumor cell proliferation inhibition, resulting in inhibition of HCC tumorigenesis.
Results
Miat was identified as an HCC specific senescence-associated lncRNA
To assess the important role of SALncRNAs in HCC, we used publicly available datasets to analyze DE-lncRNAs during replicative senescence and HCC tumorigenesis (Figure 1A), identifying 111 SALncRNAs (Figure 1B) and 1,997 HCC-DE-lncRNAs (Figure 1C). Then we focused on the HCC-specific SALncRNAs by intersecting the SALncRNAs and HCC-DE-lncRNAs. With the strict screening criteria, only two lncRNAs, namely, miat and cdkn2b-as1, were identified as HCC-specific SALncRNAs. Compared with cdkn2b-as1, miat was studied less in both cellular senescence and HCC tumorigenesis. Thus, we focused on the functional importance and detailed mechanisms of miat in cellular senescence and HCC tumorigenesis.
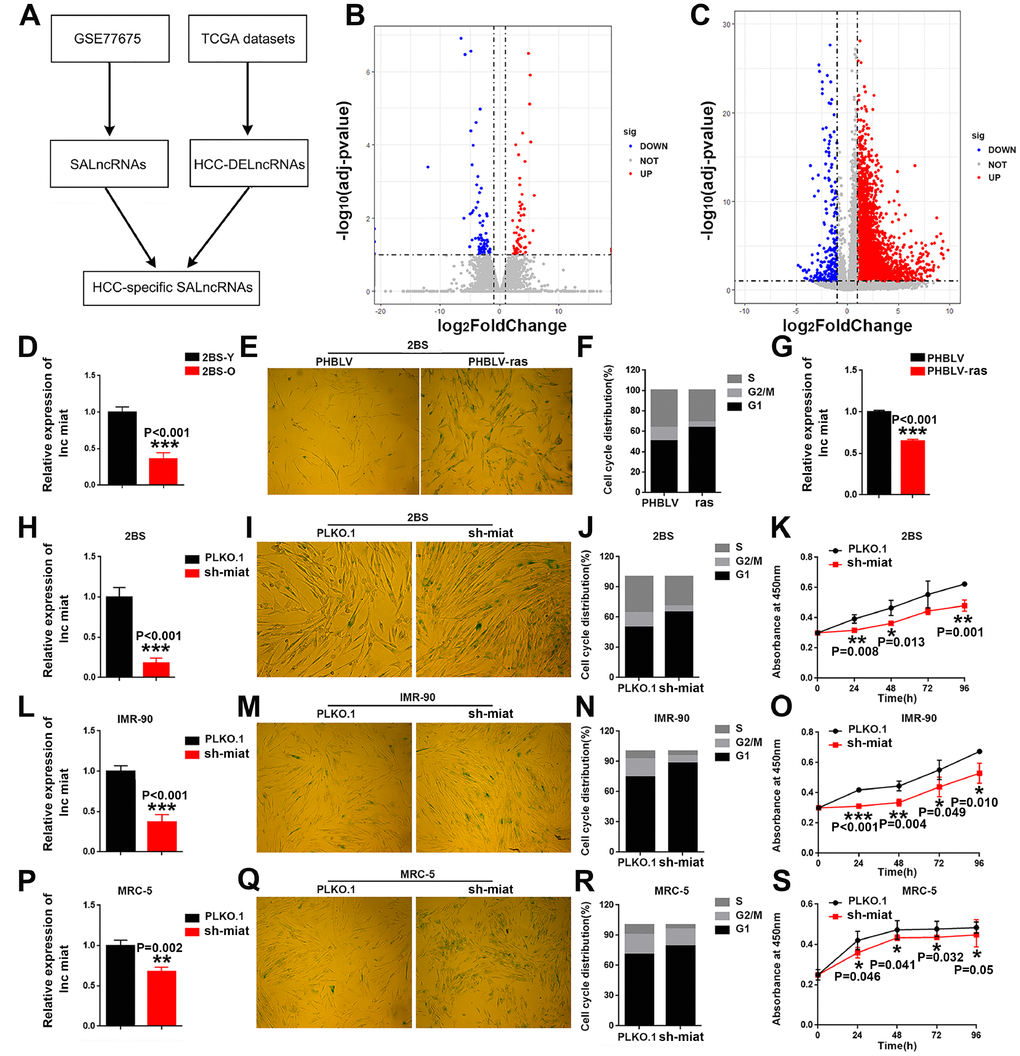
Figure 1. HCC specific SA-LncRNAs was downregulated during cellular senescence, and miat downregulation promoted cellular senescence. (A) Schematic overview of the study design. (B, C) Volcano plot of differentially expressed genes in proliferating vs. senescent WI-38 cells and HCC vs. normal tissues, respectively. The x-axis indicates log2 fold changes between the two groups and the y-axis indicates the -log10 adjusted p-value of gene expression variation. The upregulated genes are shown as red dots, the downregulated genes are shown as blue dots and the normal genes are shown as grey dots. (D) Real-time PCR analysis for miat expression in 2BS cells. The bars represent the mean and SD of three independent experiments, *P < 0.05, **P< 0.01, *** P< 0.001. (E) Cellular senescence assay by SA-β-gal staining in 2BS cells induced by the oncogene ras. (F) Cell cycle distribution analysis measured by propidium iodide staining and flow cytometry in 2BS cells induced by the oncogene ras. (G) Real-time PCR analysis for miat expression in 2BS cells induced by the oncogene ras. The bars represent the mean and SD of three independent experiments, *P < 0.05, **P< 0.01, *** P< 0.001. (H, L, P) Real-time PCR analysis for miat expression in 2BS cells, IMR-90 and MRC-5 cells transfected with the sh-miat plasmid. The bars represent the mean and SD of three independent experiments, *P < 0.05, **P< 0.01, *** P< 0.001. (I, M, Q) Cellular senescence assay by SA-β-gal staining in 2BS, IMR-90 and MRC-5 cells. (J, N, R) Cell cycle distribution analysis measured by propidium iodide staining and flow cytometry in 2BS, IMR-90 and MRC-5 cells (n=3). (K, O, S) Cell proliferation analysis determined by CCK assay (n=4, mean ± SD) in 2BS, IMR-90 and MRC-5 sh-miat cells (n =3, mean ± SD; absorption at 450 nm was detected at 0, 24, 48, 72 h and 96 h after transfection). *P < 0.05, **P< 0.01, *** P< 0.001.
Knockdown of miat significantly promoted cellular senescence
To test and verify the potential role of miat in cellular senescence, we first measured the expression of miat in normal human fibroblast 2BS cells (Figure 1D) and oncogene-induced 2BS senescence (OIS) cell models (Figure 1E–1G). The results showed that, miat was downregulated during 2BS cellular senescence. Given that miat showed a higher expression level in young 2BS cells, we stably block the expression of miat in young 2BS cells using sh RNA-encoding lentiviruses (Figure 1H). As can be seen from the results, compared to the corresponding controls, knockdown of miat in 2BS displayed increased perinuclear activity of SA-β-gal (Figure 1I), cell cycle arrest (Figure 1J) and cell proliferation inhibition (Figure 1K). Similar results were also acquired in human fibroblast cell lines IMR-90 (Figure 1L–1O) and MRC-5 (Figure 1P–1S). All of these results imply that downregulation of miat expression is significant for the induction of senescent phenotypes. Furthermore, to verify that miat is an HCC-specific SALncRNA, we generated HCC senescence models by oxidative stress (H2O2) and DNA damage (doxorubicin, DOX) and explored the role of miat in HCC cellular senescence. SA-β-gal staining was performed to confirm the establishment of the senescence model induced by different concentrations of H2O2 and DOX (The data was not shown). We observed a significant decrease of miat expression in both HepG2 (Supplementary Figure 1A, 1B) and SMMC-7721 (Supplementary Figure 1C, 1D) senescent models in a manner analogous to dose dependence. These results revealed that miat was frequently downregulated during cellular senescence, and miat silencing significantly promoted cellular senescence.
Miat was frequently upregulated in human HCC, and miat silencing inhibited HCC progression
We investigated the functional importance of miat in HCC. We first investigated the expression levels of miat in HCC and adjacent non-tumor tissues using transcriptome data downloaded from TCGA. Results show that miat expression was significantly higher in HCC tissues than in the matched noncancerous hepatic tissues (Figure 2A). We also analysed miat expression in a PUMCH cohort containing 20 pairs of HCC and para-tumor tissues. Consistently, the expression of miat in the HCC tissue samples was markedly higher than in para-tumor tissues (Figure 2B). In summary, we get the conclusions that miat was frequently upregulated in human HCC.
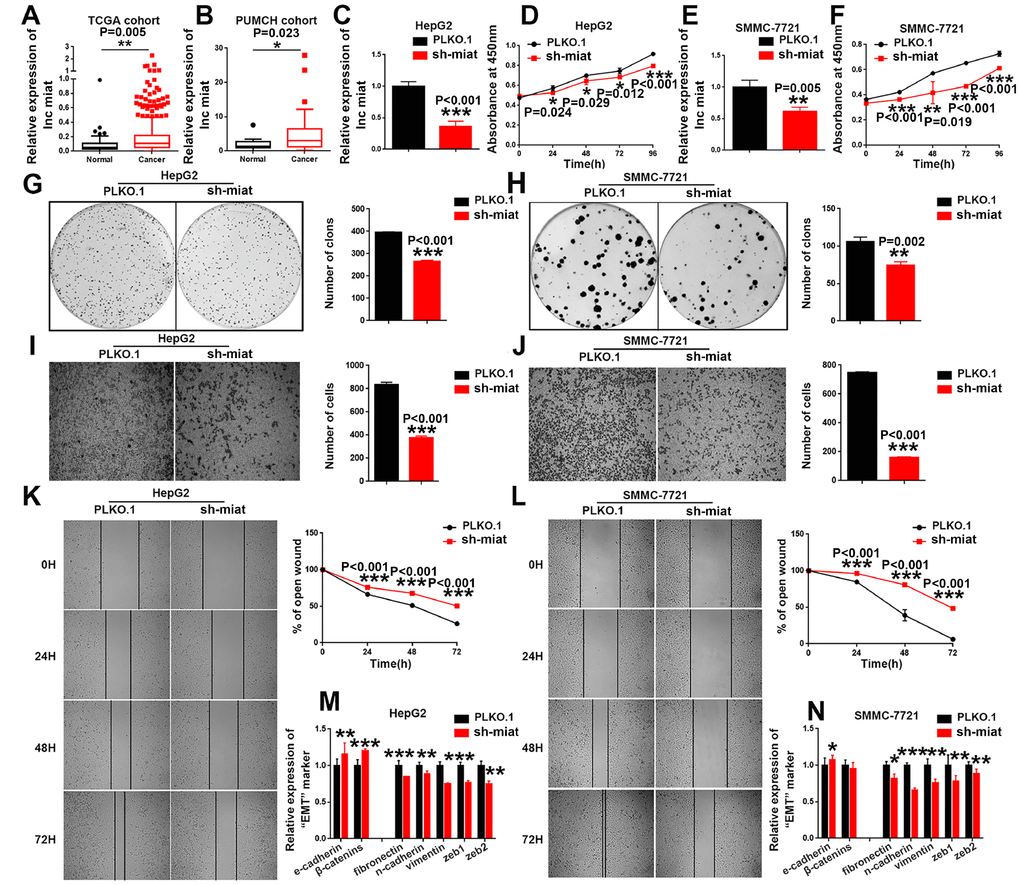
Figure 2. Knockdown of miat suppresses HCC cell hepato-carcinogenesis. (A) LncRNA miat expression analyses in HCC and nontumor tissues in TCGA datasets. *P < 0.05, **P< 0.01, *** P< 0.001. (B) LncRNA miat levels in 20 HCC and paired nontumor tissues. *P < 0.05, **P< 0.01, *** P< 0.001. (C, E) The mRNA levels of miat in miat-silenced HepG2 and SMMC-7721 cells. The bars represent the mean and SD of three independent experiments, *P < 0.05, **P< 0.01, *** P< 0.001. (D, F) Cell proliferation was measured using CCK-8 assays in HepG2 and SMMC-7721 cells with a stable knockdown of miat. The bars represent the mean and SD of three independent experiments, *P < 0.05, **P< 0.01, *** P< 0.001. (G, H) Cell colony formation assay was performed 14 days after stably knockdown miat in HepG2 and SMMC-7721 cells, and the colony number per field was calculated (right). The bars represent the mean and SD of three independent experiments, *P < 0.05, **P< 0.01, *** P< 0.001. (I, J) Transwell assay showing that knockdown of miat reduced the migration of HepG2 and SMMC-7721 cells. Representative images of the migratory cells were captured 28 h after the cells were inoculated; *P < 0.05, **P< 0.01, *** P< 0.001. (K, L) The wound-healing assay demonstrated that miat silencing reduced the migration of HepG2 and SMMC-7721 cells. Representative images were captured at 0 h, 24 h, 48 h and 72 h after scratching. The wound closure distance was measured with the software from the Leica Application Suite. The bars represent the mean and SD of three independent experiments, *P < 0.05, **P< 0.01, *** P< 0.001. (M, N) Real-time PCR analysis of the mRNA levels of key EMT markers was performed in HepG2 and SMMC-7721 cells with a stable knockdown of miat. The bars represent the mean and SD of three independent experiments, *P < 0.05, **P< 0.01, *** P< 0.001.
To investigate whether downregulated miat expression helps inhibit HCC progression, we stably silenced miat in HepG2, SMMC-7721 and Huh7 cells (Figure 2C, 2E and Supplementary Figure 1M). We detected the cell proliferation by CCK8 assays at different time points and found that knockdown of miat inhibited HCC cell proliferation (Figure 2D, 2F and Supplementary Figure 1N). These results were further supported by the colony formation assays, which indicated that miat knockdown significantly inhibited the HCC cells colony formation (Figure 2G, 2H and Supplementary Figure 1Q, 1R). It has been reported that miat was associated with metastasis of solid tumors [30]. Therefore, we conducted the migration ability of miat by Transwell and Wound-healing assays. We found that the migration ability of HCC cells was inhibited in sh-miat group (Figure 2I–2L and Supplementary Figure 1O, 1P). Studies also have shown that epithelial-mesenchymal transition (EMT) is involved in multiple biochemical changes of tumor progression [31, 32]. Thus, we detected the mRNA levels of key EMT markers by RT-PCR in miat silenced HCC cell lines. We found that typical molecular markers of epithelial cells, e-cadherin and β-catenin, were up-regulated, whereas the expression of mesenchymal markers, such as fibronectin, n-cadherin, vimentin, zeb1 and zeb2 were downregulated in HepG2, SMMC-7721 and Huh7 cells with miat knockdown (Figure 2M, 2N and Supplementary Figure 1S). In summary, these results demonstrated that miat plays a pro-tumorigenic role in HCC progression.
Based on the above data in vitro, we hypothesized and verified that the pro-tumorigenesis effect of miat on HCC in vivo. SMMC-7721 cells with stable sh-miat or control cells were collected and subcutaneously injected into nude mice. Tumor size was monitored weekly to observe tumor growth in vivo. Consistent with our assumptions, the mice injected with miat-silenced HCC cells showed strikingly inhibited tumorigenesis compared with the mice injected with control cells. Representative experimental data of each group are shown in Figure 3A–3C. In conclusion, these data suggested miat promoted tumorigenesis of HCC both in vivo and in vitro.
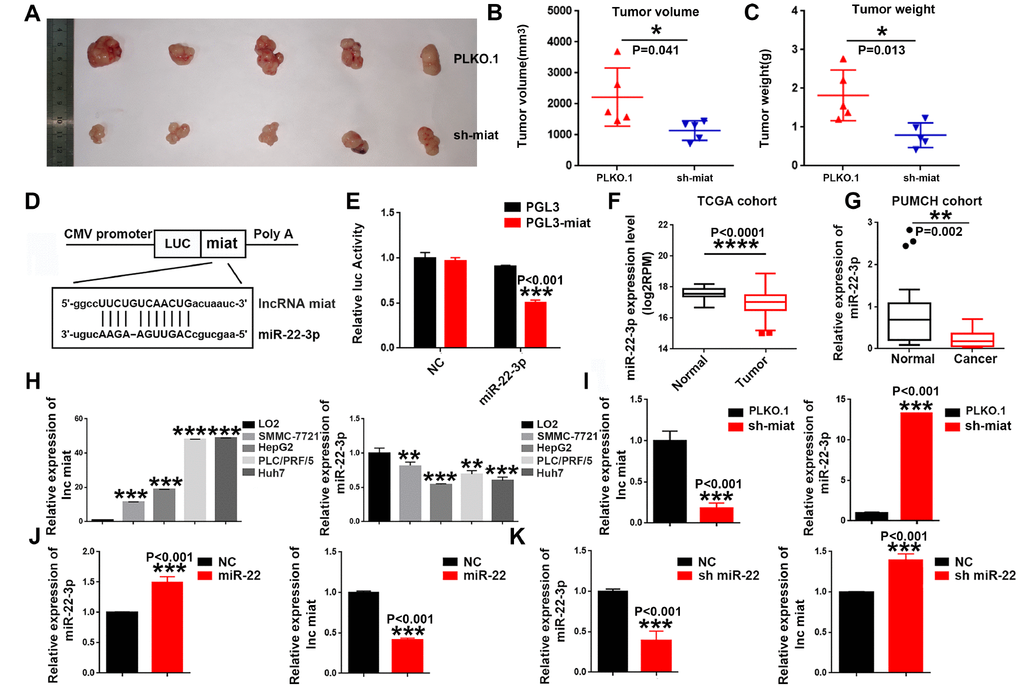
Figure 3. Knockdown of miat suppresses hepatocarcinogenesis in vivo, miR-22-3p bonded to and suppressed miat expression. (A–C) Subcutaneous injection of SMMC-7721 cells with or without miat knockdown into nude mice. Representative images of the resected subcutaneous tumors from each group are shown. Tumor volumes and tumor weights were measured (n = 6). *P < 0.05, **P< 0.01, *** P< 0.001. (D) Bioinformatics prediction using miRcode indicated that the miat sequence contained the putative binding site of miR-22-3p. (E) The cDNA of miat was cloned downstream of the luciferase gene (PGL3-miat) and transfected into HepG2 cells with miR-22-3p or control oligonucleotides. Luciferase activity was detected 48 h after transfection. The bars represent the mean and SD of three independent experiments, *P < 0.05, **P< 0.01, *** P< 0.001. (F) MiR-22-3p expression analyses in HCC and nontumor tissues in TCGA datasets. *P < 0.05, **P< 0.01, *** P< 0.001, **** P< 0.0001. (G) MiR-22-3p levels in 20 HCC and paired nontumor tissues in PUMCH cohort. *P < 0.05, **P< 0.01, *** P< 0.001, **** P< 0.0001. (H) QRT-PCR analysis of miat and miR-22-3p expression in human normal liver cell line (LO2) and HCC cell lines (SMMC-7721, HepG2, PLC/PRF/5 and Huh7). Data are expressed as the mean ± SD; n=3, *P < 0.05, **P< 0.01, *** P< 0.001, **** P< 0.0001 compared with the control group. (I) MiR-22-3p expression was increased in HepG2 cells transfected with sh-miat. The bars represent the mean and SD of three independent experiments, *P < 0.05, **P< 0.01, *** P< 0.001. (J) Miat expression was decreased in HepG2 cells transfected with the miR-22-3p(miR-22). The bars represent the mean and SD of three independent experiments, *P < 0.05, **P< 0.01, *** P< 0.001. (K) Miat expression was increased in HepG2 cells transfected with the miR-22-3p inhibitor(sh-miR-22); The bars represent the mean and SD of three independent experiments, *P < 0.05, **P< 0.01, *** P< 0.001.
MiR-22-3p bound to and suppressed miat expression
In order to further study the molecular mechanisms of miat in HCC, we exploited target prediction algorithms (LncBase Predicted V2.0 and miRWalk 3.0) to predict interaction of LncRNA miat and miRNAs. Consistent with existing research results [33], we found that miat contains a potential binding site for miR-22-3p (Figure 3D). To determine the expression correlation between the two ncRNAs in HCC biology, luciferase reporter assays were conducted. The results of the dual-luciferase reporter assay showed that overexpression of miR-22-3p could significantly decrease the luciferase activity of PGL3-miat in HepG2 cells (Figure 3E). To confirm the relationship between miat and miR-22-3p, we detected the miR-22-3p expression in HCC tissues and cell lines. Given that miat levels were higher in HCC tissues, we observed the down-regulated expression of miR-22-3p in HCC tissues from both TCGA database (Figure 3F) and PUMCH database (Figure 3G) when compared with their counterparts. We also measured the expression of miat and miR-22-3p in a panel of HCC cell lines as wells as normal liver cell line LO2. Similarly, low miat and high miR-22-3p expression were observed in the normal liver cell line (LO2), while miat upregulated and miR-22-3p downregulated in most HCC cell lines (Figure 3H). In addition, we found that the expression of miR-22-3p significantly increased in sh-miat HepG2 cells (Figure 3I). Furthermore, we found that miat expression was significantly decreased with miR-22-3p overexpression (Figure 3J), and increased after miR-22-3p inhibition in HepG2 cells (Figure 3K). These data confirmed the interaction between miat and miR-22-3p in HCC cell lines, and implied that miR-22-3p bound to and suppressed the expression of miat.
MiR-22-3p is essential for sustaining senescence-like and tumor-suppressing phenotypes induced by miat downregulation
Numerous studies have suggested that some miRNAs inhibit tumor proliferation and promote cellular senescence or ageing. Recently, miR-22-3p was considered to be a novel SA-miRNA [34], and a tumor-suppressing miRNA for many types of human cancers [35]. Therefore, we first explored the importance of miR-22-3p in cellular senescence and HCC tumorigenesis. The result showed that enforced miR-22-3p expression promoted cellular senescence in three human fibroblast cell lines, 2BS, IMR-90 and MRC-5, while down-regulation of miR-22-3p impeded the progression of senescence and ameliorated the senescence-like phenotypes (Supplementary Figure 2). We also performed a gain-or-loss of function analysis to explore the role of miR-22-3p in the HCC process. Overexpression of miR-22-3p significantly inhibited HepG2 cell proliferation, colony formation, migration and EMT in vitro, while miR-22-3p downregulation had the opposite effect (Supplementary Figure 3). The similar effect was also found in SMMC-7721(Supplementary Figure 4).
Subsequently, we performed rescue assays to verify the involvement of miR-22-3p in the miat-mediated effects on cellular senescence and HCC tumorigenesis. The results showed that miR-22-3p knockdown rescued and miR-22-3p overexpression enhanced the senescence-like phenotypes induced by sh- miat in 2BS cell lines (Figure 4A–4D). Similar effect was found in two another human fibroblast cell lines, IMR90 (Supplementary Figure 5A–5D) and MRC-5 (Supplementary Figure 5E–5H). Moreover, miR-22-3p overexpression enhanced sh- miat induced inhibition of cell proliferation (Figure 4F), cell cycle alteration (Figure 4G), colony formation (Figure 4H), migration (Figure 4I, 4J) and EMT transformation (Figure 4K) in HepG2 and SMMC-7721 cells (Supplementary Figure 5I–5O). However, miR-22-3p KD rescued the malignant phenotypes of HCC cells induced by sh-miat (Figure 4E–4K and Supplementary Figure 5I–5O). In summary, we found that miR-22-3p is essential for sustaining senescence-like phenotypes and tumor-inhibiting effect induced by miat downregulation.
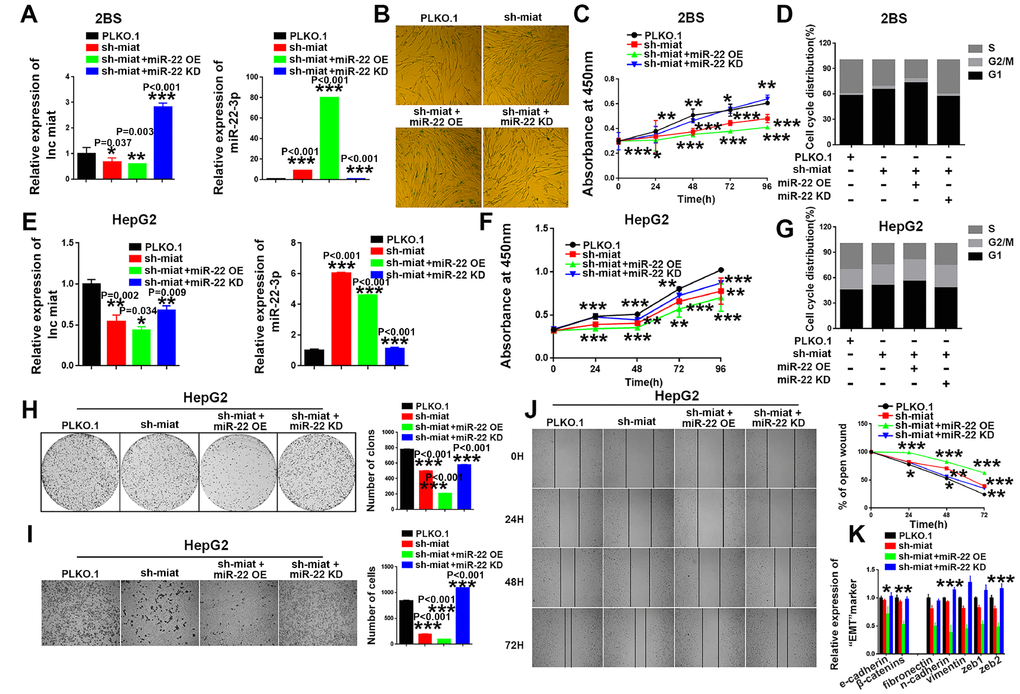
Figure 4. MiR-22-3p is essential for sustaining senescence-like phenotypes and inhibiting hepatic induction by sh-miat. (A) The mRNA levels of miat and miR-22-3p in 2BS cells infected with PLKO.1, sh-miat, or coinfected sh-miat with the miR-22-3p (miR-22 OE)/miR-22-3p inhibitor (miR-22 KD). The bars represent the mean and SD of three independent experiments, *P < 0.05, **P< 0.01, *** P< 0.001. (B) Cellular senescence assay by SA-β-gal staining in 2BS cells infected with PLKO.1, sh-miat, or coinfected sh-miat with the miR-22-3p (miR-22 OE)/miR-22-3p inhibitor (miR-22 KD). (C) Cell proliferation was measured using CCK-8 assays in 2BS cells infected with PLKO.1, sh-miat, or coinfected sh-miat with the miR-22-3p (miR-22 OE)/miR-22-3p inhibitor (miR-22 KD). The bars represent the mean and SD of three independent experiments, *P < 0.05, **P< 0.01, *** P< 0.001. (D) Cell cycle assay was performed in 2BS cells (n=3) infected with PLKO.1, sh-miat, or coinfected sh-miat with the miR-22-3p (miR-22 OE)/miR-22-3p inhibitor (miR-22 KD). (E) The expression of miat and miR-22-3p in HepG2 cells infected with PLKO.1, sh-miat, or coinfected sh-miat with the miR-22-3p (miR-22 OE)/miR-22-3p inhibitor (miR-22 KD). The bars represent the mean and SD of three independent experiments, *P < 0.05, **P< 0.01, *** P< 0.001. (F) Cell proliferation was measured using CCK-8 assays in HepG2 cells infected with PLKO.1, sh-miat, or coinfected sh-miat with the miR-22-3p (miR-22 OE)/miR-22-3p inhibitor (miR-22 KD). The bars represent the mean and SD of three independent experiments, *P < 0.05, **P< 0.01, *** P< 0.001. (G) Cell cycle assay was performed in HepG2 cells (n=3) infected with PLKO.1, sh-miat, or coinfected sh-miat with the miR-22-3p (miR-22 OE)/miR-22-3p inhibitor (miR-22 KD). (H) Cell colony formation assay shown at 14 days after infected with PLKO.1, sh-miat, or coinfected sh-miat with the miR-22-3p (miR-22 OE)/miR-22-3p inhibitor (miR-22 KD) in HepG2 cells. The colony number per field was calculated and is shown in the right panel; n=3, *P < 0.05, **P< 0.01, *** P< 0.001. (I) Representative images of the migratory cells by Transwell assay were captured 24 h after the cells were inoculated, and the results are summarized in the right panel; n=3, *P < 0.05, **P< 0.01, *** P< 0.001. (J) Representative images of the HepG2 cell wound-healing assay were captured at 0, 24, 48 and 72 h after scratching. The wound closure distance was measured with the software from the Leica Application Suite; n=3, *P < 0.05, **P < 0.01 and ***P < 0.001. (K) RT-PCR assay of EMT markers was performed in HepG2 cells infected with PLKO.1, sh-miat, or coinfected sh-miat with the miR-22-3p (miR-22 OE)/miR-22-3p inhibitor (miR-22 KD). The bars represent the mean and SD of three independent experiments, *P < 0.05, **P< 0.01, *** P< 0.001.
Sirt1 is a direct target of miR-22-3p
To further investigate the mechanism by which miat acts as a microRNA sponge, the potential target genes of miR-22-3p were analyzed by online prediction software (TargetScan v 7.2). Then, we focused on sirt1 (Figure 5A), which is associated with the HCC tumorigenesis and cellular senescence. Significant negative correlation was observed between SIRT1 expression and miR-22-3p expression in HCC tissues (R = 0.1722, P = 0.009) (Figure 5B). Then, we performed a reporter system to verify the above conclusions, and found that the relative luciferase activity was reduced with miR-22-3p overexpression (Figure 5C). In addition, we also detected the expression of miR-22-3p and sirt1 in HepG2 cells after transfection with a miR-22-3p mimic(miR-22) or miR-22-3p inhibitor (sh-miR-22). We found that sirt1 expression was significantly decreased after miR-22-3p OE (Figure 5D), and sirt1 expression increased compared with that in the control group when miR-22-3p inhibited in HepG2 cell (Figure 5E). In addition, the levels of miR-22-3p and sirt1 were evaluated in HCC cellular senescence models induced by oxidative stress (H2O2) and DNA damage (DOX). We found that the expression of miR-22-3p significantly increased in a dose-dependent manner in both senescent models, while sirt1 expression was significantly decreased in both senescent models (Supplementary Figure 1E, 1F and 1I, 1J). Similar effects were observed in SMMC-7721 (Supplementary Figure 1G, 1H and 1K, 1L).
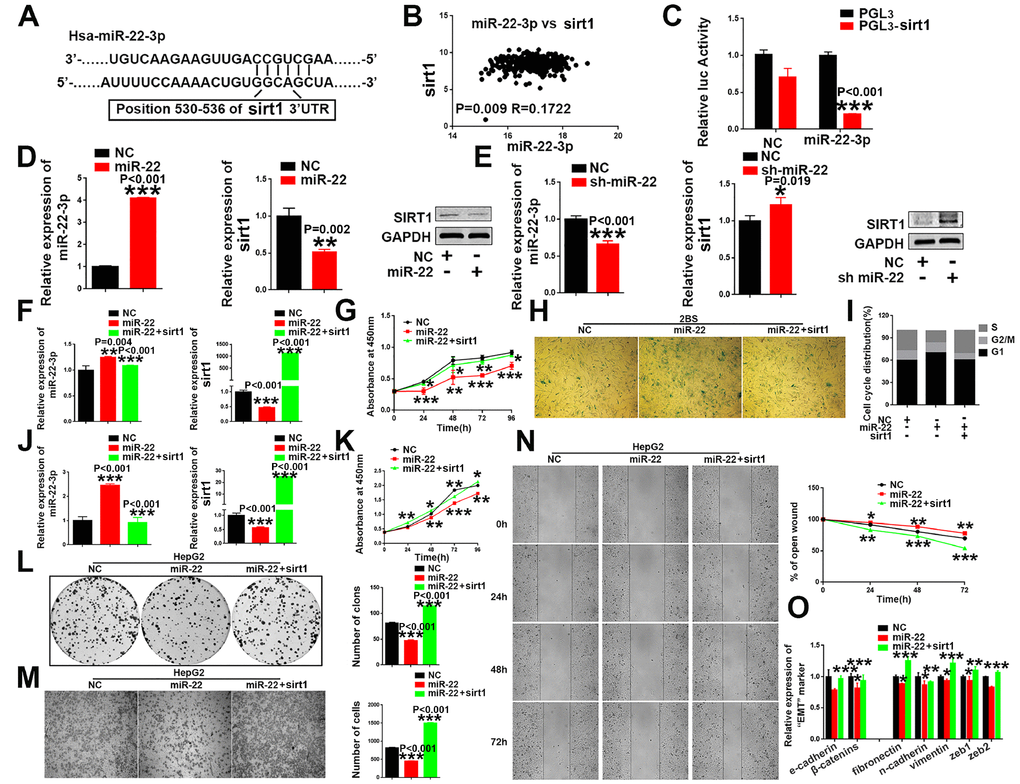
Figure 5. sirt1 is a downstream target of miR-22-3p. (A) Schematic representation of miR-22-3p predicted binding site in the 3′-UTR of sirt1 mRNAs. (B) Spearman's correlation coefficient analysis of miat and miR-22-3p expression in TCGA database. (C) Sirt1 cDNA was cloned downstream of the luciferase gene (PGL3-sirt1) and transfected into HepG2 cells with miR-22-3p or NC. Luciferase activity was detected 48 h after transfection. The bars represent the mean and SD of three independent experiments, *P < 0.05, **P< 0.01, *** P< 0.001. (D) The mRNA and protein levels of sirt1 were decreased when HepG2 cells were transfected with miR-22-3p (miR-22). The bars represent the mean and SD of three independent experiments, *P < 0.05, **P< 0.01, *** P< 0.001. (E) The mRNA and protein levels of sirt1 were increased when HepG2 cells were transfected with the miR-22-3p inhibitor (sh-miR-22). Data are expressed as the mean ± SD. n=3. *P < 0.05, **P < 0.01 and ***P < 0.001compared with the control group. (F) The mRNA levels of miR-22-3p and sirt1 in 2BS cells infected with the NC, miR-22-3p or co-infected with the miR-22-3p with sirt1. The bars represent the mean and SD of three independent experiments, *P < 0.05, **P< 0.01, *** P< 0.001. (G) Cell proliferation was measured using CCK-8 assays in 2BS cells infected with the NC, miR-22-3p or co-infected with the miR-22-3p with sirt1. Data are expressed as the mean ± SD. n=4. *P < 0.05, **P < 0.01 and ***P < 0.001compared with the control group. (H) Cellular senescence assay by SA-β-gal staining in 2BS cells infected with the NC, miR-22-3p or co-infected with the miR-22-3p with sirt1. (I) Cell cycle assays were performed in 2BS cells infected with the NC, miR-22-3p or co-infected with the miR-22-3p with sirt1. (J) The mRNA levels of miR-22-3p and sirt1 in HepG2 infected with the NC, miR-22-3p or co-infected with the miR-22-3p with sirt1. The bars represent the mean and SD of three independent experiments, *P < 0.05, **P< 0.01, *** P< 0.001. (K) Cell proliferation was measured using CCK-8 assays in HepG2 cells infected with the NC, miR-22-3p or co-infected with the miR-22-3p with sirt1. The bars represent the mean and SD of three independent experiments, *P < 0.05, **P< 0.01, *** P< 0.001. (L) Cell colony formation assay was performed 14 days after HepG2 cells were infected with the NC, miR-22-3p or co-infected with the miR-22-3p with sirt1. The bars represent the mean and SD of three independent experiments; *P < 0.05, **P< 0.01, *** P< 0.001. (M) Transwell assays were captured 24 h after the cells were inoculated, and the results are summarized in the right panel. The bars represent the mean and SD of three independent experiments; *P < 0.05, **P< 0.01, *** P< 0.001. (N) Representative images of the HepG2 cell wound-healing assay were captured at 0, 24, 48 and 72 h after scratching. The wound closure distance was measured with the software from the Leica Application Suite. The bars represent the mean and SD of three independent experiments; *P < 0.05, **P < 0.01 and ***P < 0.001. (O) RT-PCR assay of EMT markers was performed in HepG2 cells infected with the NC, miR-22-3p or co-infected with the miR-22-3p with sirt1; *P < 0.05, **P < 0.01 and ***P < 0.001.
Restoration of sirt1 expression reversed the pro-senescent and tumor-suppressing effect induced by miR-22-3p in HCC cells
Then, we validated the involvement of sirt1 in the miR-22-3p-mediated effects cellular senescence and HCC progression, and performed rescue assays. Our study showed that the restoration of sirt1 attenuates the senescence-like phenotypes induced by miR-22-3p in human fibroblast 2BS cells (Figure 5F–5I), MRC-5 (Supplementary Figure 6A–6C) and IMR-90 (Supplementary Figure 6D–6F). In addition, sirt1 overexpression rescued miR-22-3p (Figure 5J) induced inhibition of cell proliferation (Figure 5K), colony formation (Figure 5L), migration (Figure 5M, 5N) and EMT transition (Figure 5O) in HepG2 cells, while sirt1 knockdown restored the pro-tumorigenic effects of HCC inhibited by miR-22 inhibitor (sh-miR-22) (Supplementary Figure 6G–6P). Similar effects were observed in SMMC-7721, another HCC cell line (Supplementary Figure 7). In general, these results indicated that sirt1 plays a critical role in anti-senescence and pro-tumorigenic effects in HCC.
Miat upregulates the expression of sirt1 via sponging miR- 22-3p
Increasing evidence suggests that lncRNAs can act as ceRNAs and sequester specific miRNAs away from their target genes, consequently inhibiting miRNA stability and functions [36, 37]. Here, we found that knockdown of miat could inhibit the expression of sirt1 (Figure 6A and Supplementary Figure 8A), whereas these effects were significantly strengthened with miR-22-3p overexpression, but reversed after miR-22-3p KD in both two HCC cell lines (Figure 6B and Supplementary Figure 8B). To explore the functional connection between miat, miR-22-3p and sirt1, we transfected miR-22-3p normal control (NC), mimic or inhibitor, or co-infected with sirt1 or sh-sirt1 to sh-miat HCC cells as Figure 6F. We found that the effects of sh-miat on the regulation of sirt1 expression were partially attenuated by the miR-22-3p or inhibitor in HCC cell lines HepG2 (Figure 6C–6E) and SMMC-7721 (Supplementary Figure 8C–8E). These data indicated that miat upregulate the expression of sirt1 by competitively binding to miR-22-3p, and miat released sirt1 from miR-22-3p.
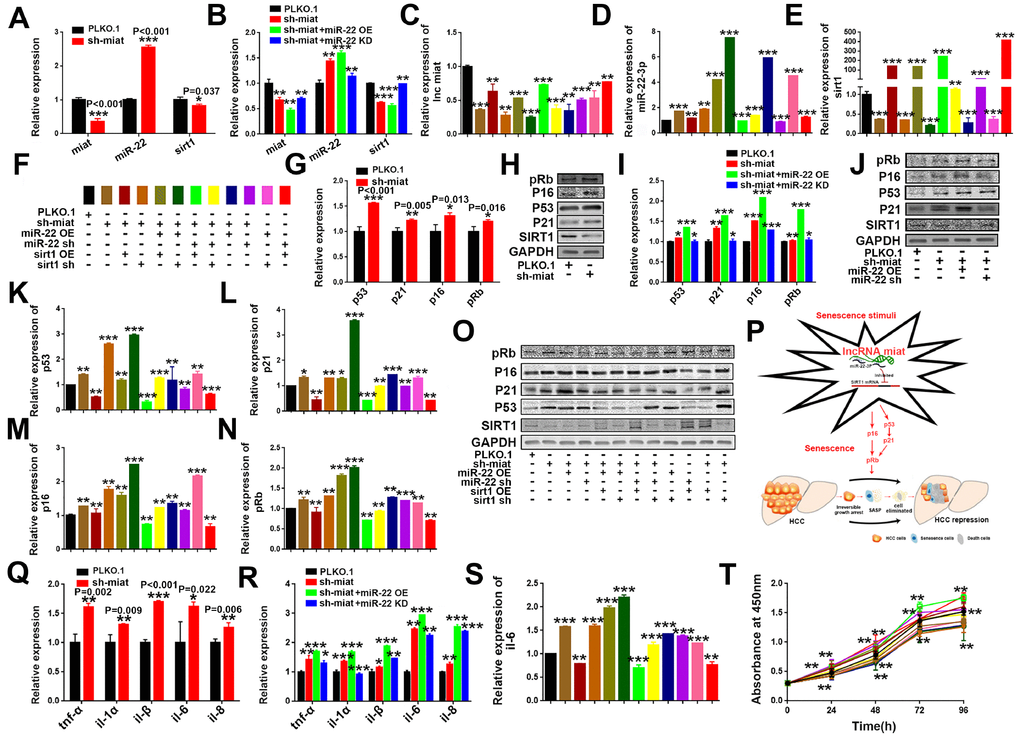
Figure 6. LncRNA miat silencing activates the p53/p21 and p16/pRb signaling pathways and promotes the production of SASP in HepG2 cells. (A) RT-PCR analysis for the expression levels of miat, miR-22-3p and sirt1 in sh-miat HepG2 cells. The bars represent the mean and SD of three independent experiments; *P < 0.05, **P < 0.01 and ***P < 0.001. (B) RT-PCR analysis for the expression levels of miat, miR-22-3p and sirt1 in HepG2 cells infected with PLKO.1, sh-miat, or co-infected with sh-miat with the miR-22-3p (miR-22 OE) /miR-22-3p inhibitor (miR-22 KD). The bars represent the mean and SD of three independent experiments; *P < 0.05, **P < 0.01 and ***P < 0.001. (C–E) RT-PCR analysis for the expression levels of miat, miR-22-3p and sirt1 in HepG2 cells with different treatments. The bars represent the mean and SD of three independent experiments; *P < 0.05, **P < 0.01 and ***P < 0.001. (F) The specific color corresponding to different experimental groups in Figure 6C–6E, 6K–6N, 6S, 6T. (G) RT-PCR analysis of the expression levels of the p53/p21 and p16/pRb signaling pathways in sh-miat HepG2 cells. The bars represent the mean and SD of three independent experiments; *P < 0.05, **P < 0.01 and ***P < 0.001. (H) The protein levels of sirt1, p53/p21 and p16/pRb were measured by western blotting. (I) RT-PCR analysis for the expression levels of the p53/p21 and p16/pRb signaling pathway in HepG2 cells infected with PLKO.1, sh-miat, or co-infected with sh-miat with the miR-22-3p (miR-22 OE) /miR-22-3p inhibitor (miR-22 KD). The bars represent the mean and SD of three independent experiments; *P < 0.05, **P < 0.01 and ***P < 0.001. (J) Protein levels of sirt1, p53/p21 and p16/pRb were measured by western blotting in HepG2 cells infected with PLKO.1, sh-miat, or co-infected with sh-miat with the miR-22-3p (miR-22 OE) /miR-22-3p inhibitor (miR-22 KD). (K–N) RT-PCR analysis for the expression levels of the p53/p21 and p16/pRb signaling pathway in HepG2 cells with different treatments as described in Figure 6F. The bars represent the mean and SD of three independent experiments; *P < 0.05, **P < 0.01 and ***P < 0.001. (O) Protein levels of sirt1, p53/p21 and p16/pRb were measured by western blotting in HepG2 cells with different treatments. (P) Schematic overview of the study design. (Q) RT-PCR analysis for the expression of selected SAS P components (tnf-α, il-1α, il-1β, il-6 and il-8) was analyzed by quantitative PCR in sh-miat HepG2 cells. The bars represent the mean and SD of three independent experiments; *P < 0.05, **P < 0.01 and ***P < 0.001. (R) RT-PCR analysis for the expression of selected SASP components (tnf-α, il-1α, il-1β, il-6 and il-8) was analyzed by quantitative PCR in HepG2 cells infected with PLKO.1, sh-miat, or co-infected with sh-miat with the miR-22-3p (miR-22 OE) /miR-22-3p inhibitor (miR-22 KD). The bars represent the mean and SD of three independent experiments; *P < 0.05, **P < 0.01 and ***P < 0.001. (S) RT-PCR analysis for the expression of selected SASP components. il-6 was analyzed by quantitative PCR in HepG2 cells with different treatments. The bars represent the mean and SD of three independent experiments; *P < 0.05, **P < 0.01 and ***P < 0.001. (T) Cell proliferation was measured using CCK-8 assays in HepG2 cells with different treatments; n=4, *P < 0.05, **P < 0.01 and ***P < 0.001.
Knockdown of miat promoted the progression of senescence and activated the tumor suppressor pathwayp53/p21 andp16/pRb
As we known, hallmarks of cellular senescence include telomere erosion, growth inhibition, cell cycle arrest, DNA damage, oxidative stress, tumor suppressor proteins activation (such as p53, p21, p16 and pRb) and senescence-associated secretory phenotype (SASP) [15, 38, 39]. We also explore the potential effect of miat on p53/p21 and p16/pRb signalling pathway in HCC cellular senescence induced by sh-miat. The results showed that miat knockdown significantly enhanced the mRNA and protein expression of p53, p21, p16 and pRb (Figure 6G, 6H and Supplementary Figure 8F, 8G), and these effects were significantly strengthened with miR-22-3p overexpression, but reversed after inhibition of miR-22-3p in HCC cell lines (Figure 6I, 6J and Supplementary Figure 8H, 8I). In addition, the effects of sh-miat on the regulation of p53/p21 and p16/pRb signalling pathway activity were partially attenuated by miR-22-3p KD or sirt1 overexpression in both HepG2 (Figure 6K–6O) and SMMC-7721cells (Supplementary Figure 8J–8N). Taken together, our data suggested that downregulation of miat broke the balance of miat/miR-22-3p/sirt1 axis, formed “Senescence stimulation” and induced HCC cellular senescence. which activated tumor suppressor pathway p53/p21, p16/pRb and SASP secretion, resulting in inhibition of HCC cell proliferation and tumorigenesis (Figure 6P).
Knockdown of miat promoted senescent HCC cells secrete SASP and restricted the proliferation of HCC cells
Studies have shown that senescent cells secrete multiple inflammatory proteins known as the SASP, and tumor cells can be eliminated through cellular senescence and SASP [40]. Thus, we next investigated the change of SASP HCC cellular senescence induced by miat. We detected the significant induction of major pro-inflammatory cytokines, such as tnf-α, il-1α, il-1β, il-6, and il-8 in miat silenced HepG2 cell lines and found that miat silencing promotes the secretion of SASP in HCC cell lines (Figure 6Q and Supplementary Figure 8O). These effects were significantly strengthened with miR-22-3p overexpression, but reversed after miR-22-3p knockdown in both HCC cell lines (Figure 6R and Supplementary Figure 8P). We also detected the expression of il-6 in HepG2 and SMMC-7721 cells with different treatments as described in Figure 6F or Supplementary Figure 8S, and obtained a similar result that sh- miat /miR-22-3p/sh-sirt1 promoted the secretion of SASP in HCC cell lines, and miR-22-3p inhibition or sirt1 overexpression reversed the SASP generation induced by miat silencing (Figure 6S and Supplementary Figure 8Q). Certain SASP components, such as il-6,il-8, also obviously act in an autocrine loop to reinforce several aspects of senescence including growth arrest. Finally, we detected the ability of cell proliferation in HCC cell lines and verified that sh-miat /miR-22-3p/sh-sirt1 silencing inhibited HCC cell proliferation, and these tumor suppressive effects were significantly reversed after miR-22-3p KD or sirt1 OE in both HCC cell lines (Figure 6T and Supplementary Figure 8R).
In summary, our study demonstrates that SAL-miat play an important role in HCC cellular senescence, which might offer a potential therapeutic strategy for HCC treatment.
Discussion
HCC is the fifth most frequently occurring cancer worldwide with poor prognosis. Although much efforts have been made to improve the treatment and surveillance status of HCC, the outcome of clinical is still limited. Therefore, a deeper understanding of molecular mechanisms involved in the carcinogenesis and cancer progression of HCC is urgently needed.
Many scientists believe that aging has an inhibitory effect on tumors, and therefore proposes to treat tumors by activating tumor cellular senescence [6, 41]. Studies have also pointed out that aging may promote tumors in a certain genetic background [42]. In our study, we investigated lncRNAs that were differentially expressed during liver cancer progression and cellular senescence by integrating existing data and focused our research on lncRNA miat. We found that, sh-miat could induce cellular senescence and delay HCC progression, which indicates that miat may play a role as a bridge in cell senescence and HCC progression. In addition, Huang etc. found that knockdown miat inhibited proliferation and invasion in both p53 WT HCC cells SK-HEP-1 and p53-MUT cells HLE, which suggested that lncRNA miat promotes HCC tumorigenesis in p53 non-dependent pathway. We also performed pro-tumorigenic effect of the miat in p53-Mut HCC cell line Huh7 and got consistent results. Based on the conclusion of the previous and the present study, we speculated that miat may play the same role in p53 WT and p53 deficient HCC cells in different ways, but more details have to be further studied.
Recent studies show that lncRNAs are associated with various diseases, such as Alzheimer's disease, coronary artery disease, prostate cancer, lung cancer and HCC [43–45]. It has become largely accepted that lncRNAs act as ceRNAs to sponge miRNAs and further release the targets of miRNAs from translational inhibition and/or degradation [46]. In our study, we found that lncRNA miat acted as a ceRNA to upregulate sirt1 by sponging miR-22-3p, influencing cellular senescence and HCC progression. Overall, these results verified that coding and noncoding RNAs may communicate with each other through the ceRNA language [46]. However, the ceRNA activity of SAL-miat may enable it to sponge many miRNAs, which can simultaneously target multiple genes, and more detailed interaction networks have yet to be further studied.
Various oncogenes and tumor suppressors have been shown to be involved in the regulation of senescence-inducing pathways, and senescence induction appears to be an important step in the tumor regression [47]. The p53/p21 and p16/pRb tumor suppressor pathways are the most important regulators of cellular senescence and tumor progression [48]. Study showed that the two tumor suppressor pathways were putative targets for various cancer therapies because of their significant effect on senescence [49, 50]. In our study, we found that miat silencing activates the p53/p21 and p16/pRb pathways, and promotes cell cycle arrest and cell proliferation inhibition, in both normal human fibroblast cell lines and HCC cell lines.
Furthermore, studies have shown that senescent cells secrete cytokines and other factors of SASP, and SASP influences tissue microenvironments and stimulates tumorigenesis [51–55]. However, there are also emerging views reporting that the specific immune can identify and clear senescent hepatocytes [56]. Thus, SASPs appear to be beneficial or deleterious, depending on the biological context. In our study, we found that miat silencing induced HCC cellular senescence, which promotes the production of SASP. Perhaps the anti-cancer function of SASP accelerates the clearance of HCC tumor cells to limit HCC progression, or SASP and cell senescence work together to inhibit the development of HCC.
Given the tumor suppressive potential of senescence, determining how HCC cells escape senescence and devising methods to restore senescence to these cells may be important for developing a new therapeutic option for this malignancy. Therefore, our research started with HCC specific senescence-associated lncRNAs, and focused on SAL-miat, which plays a critical role in promoting HCC cellular senescence and inhibiting HCC progression. Mechanistically, we reported that miat acted as a ceRNA by sponging miR-22-3p to upregulated the expression of sirt1. Finally, we identified the miat silencing could inhibit HCC tumorigenesis by inducing HCC cellular senescence and activating p53/p21 andp16/pRb signaling pathways, which promote the production of SASP, and that the anticancer function of SASP accelerates the clearance of HCC tumor cells to limit HCC progression.
Materials and Methods
Human HCC samples and cell lines
Twenty paired fresh-frozen HCC and para-tumor tissue samples were used in quantitative real-time PCR (qRT-PCR) analysis. HCC and para-tumor tissue samples were surgically resected from HCC patients who underwent hepatectomy at the Peking Union Medical College Hospital (PUMCH, Beijing, China) between 2010 and 2014. All diagnoses were confirmed by pathology. This study was approved by the Ethics Committee of PUMCH, and informed consent was obtained from each patient.
The 293T cell line and HCC cell lines HepG2, SMMC-7721, PLC/PRF/5, Huh7 and SK-hep-1 were obtained from Shanghai Cell Bank, Chinese Academy of Sciences, and cultured as recommended by the supplier. Human diploid fibroblast cells 2BS, IMR90 and MRC-5 were obtained from National Institute of Biological Products, Beijing, China, and cultured as recommended by the supplier. Cells were transiently transfected with plasmids using Lipofectamine 2000 Reagent (Invitrogen), and siRNAs were transfected using Lipofectamine RNAiMAX Reagent (Invitrogen, Carlsbad, USA) following the manufacturer’s protocol. Forty-eight hours after transfection, cells were harvested and lysed to evaluate the transfection efficiency.
RNA isolation and qRT-PCR) analysis
Total RNA was extracted from cultured cell lines or tumor tissues using TRIzol reagent (Invitrogen, Carlsbad, CA, USA) following the manufacturer’s instructions. RNA was quantified by absorbance at 260 nm. Complementary DNA (cDNA) was then synthesized using the TaKaRa Reverse Transcription System (TaKaRa, Dalian, China). qRT-PCR analysis was performed on the ABI-7500 Real-Time PCR System using iQTM SYBR Green Supermix (Bio-Rad, Hercules, USA) reagent. The relative expression of target genes was calculated using the 2−ΔΔCt method.
SA-β-Gal activity analysis
The activity of SA-β-gal, a marker of cellular senescence, was determined by using the Cellular Senescence Assay Kit (Chemicon International, Temecula, CA) according to the manufacturer’s instructions. After 72 h of transfection as indicated above, cells were washed twice with phosphate-buffered saline (PBS), fixed with 1× fixing solution and incubated in 10 cm2 flasks at a cell density of 2 × 10⁵ cells/flask at room temperature for 10 min. After removing the fixing solution, cells were washed twice with PBS and incubated overnight with freshly prepared 1× SA-β-gal detection solution at 37°C, without CO2 and protected from light. The percentages of blue-stained senescent cells (SA-β-gal-positive) were determined by counting 150-200 cells in six microscopic fields.
Western blot analysis
Cells were collected in RIPA buffer with protease inhibitor cocktails (AMRESCO) and lysed on ice for 30 min with a short vortex every 10 min. Lysates were centrifuged for 15 min at 13,000 × g and 4°C, supernatants were collected, and protein concentrations were determined by BCA Protein Assay Reagent (Pierce). Lysates were fractionated by SDS-PAGE and transferred onto nitrocellulose membranes. For western blotting analysis, the membranes were incubated with primary antibodies against sirt1, p53, p21, p16 and pRb (Abcam, Cambridge, MA, USA) or GAPDH (Santa Cruz Biotechnology, CA, USA) at 4°C overnight. After three washes with TBST, the membranes were incubated with a secondary antibody at room temperature for 2 h. Then, the signals were detected by enhanced chemiluminescence or fluorescence according to the manufacturer’s recommendations.
Cell proliferation and colony formation assay
Cell viability was measured with the Cell Counting Kit-8 (CCK-8) (Dojindo, Shanghai, China) according to the manufacturer’s instructions. Cells were plated at a density of 1×10³ cells per well in 96-well plates and incubated at 37°C. Proliferation rates were determined at 0, 24, 48, 72 and 96 h post transfection, and quantification was performed on a microliter plate reader (Spectra Rainbow, Tecan) using the Clone Select Imager System (Genetix) according to the manufacturer’s protocol. Values represent the mean ± standard deviation (SD) of four data points from a representative experiment, and experiments were repeated more than three times with similar results. Briefly, transfected cells were plated in six-well plates at a density of 1000 cells per well. The medium was changed every 3 days. After 2 weeks, colonies were fixed with methanol and stained with crystal violet for 20 min. Each experiment was repeated at least three times.
Cell cycle analysis
Cells with different treatments were washed three times with PBS, detached with 0.25% trypsin, and fixed with 75% ethanol at 4°C overnight. After treatment with 2.5 μl of 10 mg/ml RNase A (Fermentas) at 37°C for 30 min, the cells were resuspended in 300 μl of PBS and stained with propidium iodide in the dark for 30 min. The cells were filtered, and fluorescence was measured
Wound-healing migration assay
To perform migration assays, we seeded cells in confluent monolayers in six-well plates after transfection. A linear gap was generated by scratching the cell layer at the bottoms of the wells using a sterile 200 μl pipette tip. Phase contrast images were acquired at an identical location at 0, 24, 48, and 72 h after scratching, and the width (W) of the scratch wound was measured. The rate of closure of the open wounds was calculated. All measurements were performed in triplicate at least three times.
Transwell migration assay
Double-chamber migration assays were performed using Transwell chambers (24-well plate, 8 mm pores; BD Biosciences). In brief, the lower chambers were filled with 600 μl of DMEM containing 10% fetal bovine serum (FBS). HCC cells with different treatments were suspended in serum-free medium, seeded in the upper chambers and incubated at 37°C for 24 h. Then, the cells on the upper surface of the filters were removed using cotton wool swabs. The migrated cells on the lower side of the membrane were fixed in 95% methanol and stained with 0.1% crystal violet dye, and the number of cells migrating to the lower surface was counted in three randomly selected high-magnification fields (100×) for each sample.
Luciferase reporter assay
For reporter gene assays, the constructed luciferase reporter vectors and Renilla vectors as loading controls were cotransfected using Lipofectamine 2000 (Invitrogen) following the manufacturer’s instructions. Forty-eight hours later, cell lysates were collected, and luciferase activity was measured using the Dual-Luciferase Reporter Assay System (Promega) and normalized to Renilla luciferase activity.
Subcutaneous tumor model
All animal procedures were performed according to the National Animal Experimentation Guidelines upon approval of the experimental protocol by the Institutional Animal Experimentation Committee of PUMCH. For subcutaneous xenograft experiments, BALB/c mice (female, 6-8 weeks of age) were used to examine tumorigenicity. The SMMC-7721 cell line (3 × 10⁶ cells/mouse) with stable knockdown miat and the corresponding controls were subcutaneously injected into the nude mice. The size of the tumors was measured by calipers twice a week, and tumor volumes were calculated using the following formula: 1/2 × d2 × D. The mice were sacrificed after 4–6 weeks, and tumors were removed for assessment.
Target prediction
The interactions of lncRNA miat and miRNA hsa-miR-22-3p were predicted by the online bioinformatics algorithms : starBase v2.0 (http://starbase.sysu.edu.cn/index.php). The target genes of has-miR-22-3p were predicted by the online bioinformatics algorithms: TargetScan Release 3.1 (http://www.targetscanmamm31/).
Transcriptome sequencing and bioinformatics analysis
The gene expression of HCC patients from The Cancer Genome Atlas (TCGA) Liver Cancer (LIHC) dataset was obtained by using the UCSC Xena Browser (https://xenabrowser.net/). The gene expression of proliferating and senescent WI-38 human diploid fibroblasts from the GSE77675 dataset was downloaded from the Gene Expression Omnibus (GEO) database (https://www.ncbi.nlm.nih.gov/gds). SA-LncRNAs and differentially expressed (DE) HCC lncRNAs were determined by t-tests (FDR < 0.1; fold change ≥2 or ≤0.5) in GSE77675 and TCGA datasets. HCC-specific SALncRNAs were then identified by intersecting SALncRNAs and HCC-DElncRNAs. The following lncRNAs were finally reserved for scientific consideration: (1) lncRNAs that were upregulated in both senescent WI38 cells and HCC tumor tissues; and (2) lncRNAs that were downregulated in both senescent WI38 cells and HCC tumor tissues.
Statistical analysis
All statistical analyses were performed using GraphPad Prism Software and R software (version 3.3.3). For comparisons, Student’s t-test (two-sided), Pearson’s chi-square test, Kaplan–Meier survival analysis, Fisher’s exact test, and Pearson’s correlation analysis were performed as indicated. Each assay was performed in three independent replicates, and all data are expressed as mean ± SD of n = 3 independent samples. A probability of P < 0.05 was considered statistically significant from control. *P < 0.05, **P < 0.01, ***P < 0.001 and ****P < 0.0001.
Supplementary Materials
Author Contributions
LMH, TJT, PFT and XDH conceived the study. LJZ, KXW, JZC, and JL performed the experiments. LJZ, KXW, and KWZ analyzed the data. LMH and LJZ wrote the manuscript. All authors read and approved the final manuscript.
Conflicts of Interest
The authors declare that they have no competing interests.
Funding
This work was supported by National Natural Science Foundation of China [81471404 to L.M.H., 81772949 to T.J.T.]; Clinical Medicine Plus X - Young Scholars Project (BMU2018MX005, Peking University)
References
- 1. Han LL, Lv Y, Guo H, Ruan ZP, Nan KJ. Implications of biomarkers in human hepatocellular carcinoma pathogenesis and therapy. World J Gastroenterol. 2014; 20:10249–61. https://doi.org/10.3748/wjg.v20.i30.10249 [PubMed]
- 2. Wallace MC, Preen D, Jeffrey GP, Adams LA. The evolving epidemiology of hepatocellular carcinoma: a global perspective. Expert Rev Gastroenterol Hepatol. 2015; 9:765–79. https://doi.org/10.1586/17474124.2015.1028363 [PubMed]
- 3. Li C, Chen J, Zhang K, Feng B, Wang R, Chen L. Progress and Prospects of Long Noncoding RNAs (lncRNAs) in Hepatocellular Carcinoma. Cell Physiol Biochem. 2015; 36:423–34. https://doi.org/10.1159/000430109 [PubMed]
- 4. Cornelissen G, Otsuka K. Chronobiology of Aging: A Mini-Review. Gerontology. 2017; 63:118–28. https://doi.org/10.1159/000450945 [PubMed]
- 5. Robert L, Labat-Robert J, Robert AM. Genetic, epigenetic and posttranslational mechanisms of aging. Biogerontology. 2010; 11:387–99. https://doi.org/10.1007/s10522-010-9262-y [PubMed]
- 6. Acosta JC, Gil J. Senescence: a new weapon for cancer therapy. Trends Cell Biol. 2012; 22:211–19. https://doi.org/10.1016/j.tcb.2011.11.006 [PubMed]
- 7. Pérez-Mancera PA, Young AR, Narita M. Inside and out: the activities of senescence in cancer. Nat Rev Cancer. 2014; 14:547–58. https://doi.org/10.1038/nrc3773 [PubMed]
- 8. Raouf S, Weston C, Yucel N, Reproducibility Project: Cancer B. Registered report: senescence surveillance of pre-malignant hepatocytes limits liver cancer development. Elife. 2015; 4. https://doi.org/10.7554/eLife.04105 [PubMed]
- 9. Jarroux J, Morillon A, Pinskaya M. History, Discovery, and Classification of lncRNAs. Adv Exp Med Biol. 2017; 1008:1–46. https://doi.org/10.1007/978-981-10-5203-3_1 [PubMed]
- 10. Peng Z, Liu C, Wu M. New insights into long noncoding RNAs and their roles in glioma. Mol Cancer. 2018; 17:61. https://doi.org/10.1186/s12943-018-0812-2 [PubMed]
- 11. Lin C, Yang L. Long Noncoding RNA in Cancer: Wiring Signaling Circuitry. Trends Cell Biol. 2018; 28:287–301. https://doi.org/10.1016/j.tcb.2017.11.008 [PubMed]
- 12. Arun G, Diermeier SD, Spector DL. Therapeutic Targeting of Long Non-Coding RNAs in Cancer. Trends Mol Med. 2018; 24:257–77. https://doi.org/10.1016/j.molmed.2018.01.001 [PubMed]
- 13. Baker DJ, Wijshake T, Tchkonia T, LeBrasseur NK, Childs BG, van de Sluis B, Kirkland JL, van Deursen JM. Clearance of p16Ink4a-positive senescent cells delays ageing-associated disorders. Nature. 2011; 479:232–36. https://doi.org/10.1038/nature10600 [PubMed]
- 14. Naylor RM, Baker DJ, van Deursen JM. Senescent cells: a novel therapeutic target for aging and age-related diseases. Clin Pharmacol Ther. 2013; 93:105–16. https://doi.org/10.1038/clpt.2012.193 [PubMed]
- 15. van Deursen JM. The role of senescent cells in ageing. Nature. 2014; 509:439–46. https://doi.org/10.1038/nature13193 [PubMed]
- 16. Almnaseer ZA, Mourtada-Maarabouni M. Long noncoding RNA MIAT regulates apoptosis and the apoptotic response to chemotherapeutic agents in breast cancer cell lines. Biosci Rep. 2018; 38:BSR20180704. https://doi.org/10.1042/BSR20180704 [PubMed]
- 17. Sha M, Lin M, Wang J, Ye J, Xu J, Xu N, Huang J. Long non-coding RNA MIAT promotes gastric cancer growth and metastasis through regulation of miR-141/DDX5 pathway. J Exp Clin Cancer Res. 2018; 37:58. https://doi.org/10.1186/s13046-018-0725-3 [PubMed]
- 18. Zhang HY, Zheng FS, Yang W, Lu JB. The long non-coding RNA MIAT regulates zinc finger E-box binding homeobox 1 expression by sponging miR-150 and promoteing cell invasion in non-small-cell lung cancer. Gene. 2017; 633:61–65. https://doi.org/10.1016/j.gene.2017.08.009 [PubMed]
- 19. Crea F, Venalainen E, Ci X, Cheng H, Pikor L, Parolia A, Xue H, Nur Saidy NR, Lin D, Lam W, Collins C, Wang Y. The role of epigenetics and long noncoding RNA MIAT in neuroendocrine prostate cancer. Epigenomics. 2016; 8:721–31. https://doi.org/10.2217/epi.16.6 [PubMed]
- 20. Abdelmohsen K, Panda A, Kang MJ, Xu J, Selimyan R, Yoon JH, Martindale JL, De S, Wood WH
3rd , Becker KG, Gorospe M. Senescence-associated lncRNAs: senescence-associated long noncoding RNAs. Aging Cell. 2013; 12:890–900. https://doi.org/10.1111/acel.12115 [PubMed] - 21. Li Y, Wang J, Sun L, Zhu S. LncRNA myocardial infarction-associated transcript (MIAT) contributed to cardiac hypertrophy by regulating TLR4 via miR-93. Eur J Pharmacol. 2018; 818:508–17. https://doi.org/10.1016/j.ejphar.2017.11.031 [PubMed]
- 22. Zhong X, Ma X, Zhang L, Li Y, Li Y, He R. MIAT promotes proliferation and hinders apoptosis by modulating miR-181b/STAT3 axis in ox-LDL-induced atherosclerosis cell models. Biomed Pharmacother. 2018; 97:1078–85. https://doi.org/10.1016/j.biopha.2017.11.052 [PubMed]
- 23. Luan T, Zhang X, Wang S, Song Y, Zhou S, Lin J, An W, Yuan W, Yang Y, Cai H, Zhang Q, Wang L. Long non-coding RNA MIAT promotes breast cancer progression and functions as ceRNA to regulate DUSP7 expression by sponging miR-155-5p. Oncotarget. 2017; 8:76153–64. https://doi.org/10.18632/oncotarget.19190 [PubMed]
- 24. Huang X, Gao Y, Qin J, Lu S. lncRNA MIAT promotes proliferation and invasion of HCC cells via sponging miR-214. Am J Physiol Gastrointest Liver Physiol. 2018; 314:G559–65. https://doi.org/10.1152/ajpgi.00242.2017 [PubMed]
- 25. Wu X, Cao N, Fenech M, Wang X. Role of Sirtuins in Maintenance of Genomic Stability: Relevance to Cancer and Healthy Aging. DNA Cell Biol. 2016; 35:542–75. https://doi.org/10.1089/dna.2016.3280 [PubMed]
- 26. Min L, Ji Y, Bakiri L, Qiu Z, Cen J, Chen X, Chen L, Scheuch H, Zheng H, Qin L, Zatloukal K, Hui L, Wagner EF. Liver cancer initiation is controlled by AP-1 through SIRT6-dependent inhibition of survivin. Nat Cell Biol. 2012; 14:1203–11. https://doi.org/10.1038/ncb2590 [PubMed]
- 27. Campisi J, d’Adda di Fagagna F. Campisi J and d’Adda di Fagagna F. Cellular senescence: when bad things happen to good cells. Nat Rev Mol Cell Biol. 2007; 8:729–40. https://doi.org/10.1038/nrm2233 [PubMed]
- 28. Adams PD. Healing and hurting: molecular mechanisms, functions, and pathologies of cellular senescence. Mol Cell. 2009; 36:2–14. https://doi.org/10.1016/j.molcel.2009.09.021 [PubMed]
- 29. Collins CJ, Sedivy JM. Involvement of the INK4a/Arf gene locus in senescence. Aging Cell. 2003; 2:145–50. https://doi.org/10.1046/j.1474-9728.2003.00048.x [PubMed]
- 30. Zhang C, Xie L, Liang H, Cui Y. LncRNA MIAT facilitates osteosarcoma progression by regulating mir-128-3p/VEGFC axis. IUBMB Life. 2019; 71:845–53. https://doi.org/10.1002/iub.2001 [PubMed]
- 31. Hanahan D, Weinberg RA. Hallmarks of cancer: the next generation. Cell. 2011; 144:646–74. https://doi.org/10.1016/j.cell.2011.02.013 [PubMed]
- 32. Solinas G, Marchesi F, Garlanda C, Mantovani A, Allavena P. Inflammation-mediated promotion of invasion and metastasis. Cancer Metastasis Rev. 2010; 29:243–48. https://doi.org/10.1007/s10555-010-9227-2 [PubMed]
- 33. Zhou X, Zhang W, Jin M, Chen J, Xu W, Kong X. lncRNA MIAT functions as a competing endogenous RNA to upregulate DAPK2 by sponging miR-22-3p in diabetic cardiomyopathy. Cell Death Dis. 2017; 8:e2929. https://doi.org/10.1038/cddis.2017.321 [PubMed]
- 34. Xu D, Takeshita F, Hino Y, Fukunaga S, Kudo Y, Tamaki A, Matsunaga J, Takahashi RU, Takata T, Shimamoto A, Ochiya T, Tahara H. miR-22 represses cancer progression by inducing cellular senescence. J Cell Biol. 2011; 193:409–24. https://doi.org/10.1083/jcb.201010100 [PubMed]
- 35. Xiong J, Du Q, Liang Z. Tumor-suppressive microRNA-22 inhibits the transcription of E-box-containing c-Myc target genes by silencing c-Myc binding protein. Oncogene. 2010; 29:4980–88. https://doi.org/10.1038/onc.2010.241 [PubMed]
- 36. Arancio W, Pizzolanti G, Genovese SI, Baiamonte C, Giordano C. Competing endogenous RNA and interactome bioinformatic analyses on human telomerase. Rejuvenation Res. 2014; 17:161–167. https://doi.org/10.1089/rej.2013.1486 [PubMed]
- 37. Sen R, Ghosal S, Das S, Balti S, Chakrabarti J. Competing endogenous RNA: the key to posttranscriptional regulation. ScientificWorldJournal. 2014; 2014:896206. https://doi.org/10.1155/2014/896206 [PubMed]
- 38. Campisi J. Aging, cellular senescence, and cancer. Annu Rev Physiol. 2013; 75:685–705. https://doi.org/10.1146/annurev-physiol-030212-183653 [PubMed]
- 39. Sharpless NE, Sherr CJ. Forging a signature of in vivo senescence. Nat Rev Cancer. 2015; 15:397–408. https://doi.org/10.1038/nrc3960 [PubMed]
- 40. Choi E, Park PG, Lee HO, Lee YK, Kang GH, Lee JW, Han W, Lee HC, Noh DY, Lekomtsev S, Lee H. BRCA2 fine-tunes the spindle assembly checkpoint through reinforcement of BubR1 acetylation. Dev Cell. 2012; 22:295–308. https://doi.org/10.1016/j.devcel.2012.01.009 [PubMed]
- 41. Jing H, Lee S. NF-κB in cellular senescence and cancer treatment. Mol Cells. 2014; 37:189–95. https://doi.org/10.14348/molcells.2014.2353 [PubMed]
- 42. Chen Z, Trotman LC, Shaffer D, Lin HK, Dotan ZA, Niki M, Koutcher JA, Scher HI, Ludwig T, Gerald W, Cordon-Cardo C, Pandolfi PP. Crucial role of p53-dependent cellular senescence in suppression of Pten-deficient tumorigenesis. Nature. 2005; 436:725–30. https://doi.org/10.1038/nature03918 [PubMed]
- 43. Visel A, Zhu Y, May D, Afzal V, Gong E, Attanasio C, Blow MJ, Cohen JC, Rubin EM, Pennacchio LA. Targeted deletion of the 9p21 non-coding coronary artery disease risk interval in mice. Nature. 2010; 464:409–12. https://doi.org/10.1038/nature08801 [PubMed]
- 44. Chung S, Nakagawa H, Uemura M, Piao L, Ashikawa K, Hosono N, Takata R, Akamatsu S, Kawaguchi T, Morizono T, Tsunoda T, Daigo Y, Matsuda K, et al. Association of a novel long non-coding RNA in 8q24 with prostate cancer susceptibility. Cancer Sci. 2011; 102:245–52. https://doi.org/10.1111/j.1349-7006.2010.01737.x [PubMed]
- 45. Schmidt LH, Spieker T, Koschmieder S, Schäffers S, Humberg J, Jungen D, Bulk E, Hascher A, Wittmer D, Marra A, Hillejan L, Wiebe K, Berdel WE, et al. The long noncoding MALAT-1 RNA indicates a poor prognosis in non-small cell lung cancer and induces migration and tumor growth. J Thorac Oncol. 2011; 6:1984–92. https://doi.org/10.1097/JTO.0b013e3182307eac [PubMed]
- 46. Tay Y, Rinn J, Pandolfi PP. The multilayered complexity of ceRNA crosstalk and competition. Nature. 2014; 505:344–52. https://doi.org/10.1038/nature12986 [PubMed]
- 47. Lujambio A, Banito A. Functional screening to identify senescence regulators in cancer. Curr Opin Genet Dev. 2019; 54:17–24. https://doi.org/10.1016/j.gde.2019.02.001 [PubMed]
- 48. Eckner R. p53-dependent growth arrest and induction of p21: a critical role for PCAF-mediated histone acetylation. Cell Cycle. 2012; 11:2591–92. https://doi.org/10.4161/cc.21235 [PubMed]
- 49. Bai J, Chen J, Ma M, Cai M, Xu F, Wang G, Tao K, Shuai X. Inhibiting enhancer of zeste homolog 2 promotes cellular senescence in gastric cancer cells SGC-7901 by activation of p21 and p16. DNA Cell Biol. 2014; 33:337–44. https://doi.org/10.1089/dna.2014.2340 [PubMed]
- 50. Li Q, Li J, Wen T, Zeng W, Peng C, Yan S, Tan J, Yang K, Liu S, Guo A, Zhang C, Su J, Jiang M, et al. Overexpression of HMGB1 in melanoma predicts patient survival and suppression of HMGB1 induces cell cycle arrest and senescence in association with p21 (Waf1/Cip1) up-regulation via a p53-independent, Sp1-dependent pathway. Oncotarget. 2014; 5:6387–403. https://doi.org/10.18632/oncotarget.2201 [PubMed]
- 51. Denkinger MD, Leins H, Schirmbeck R, Florian MC, Geiger H. HSC Aging and Senescent Immune Remodeling. Trends Immunol. 2015; 36:815–24. https://doi.org/10.1016/j.it.2015.10.008 [PubMed]
- 52. Davalos AR, Coppe JP, Campisi J, Desprez PY. Senescent cells as a source of inflammatory factors for tumor progression. Cancer Metastasis Rev. 2010; 29:273–83. https://doi.org/10.1007/s10555-010-9220-9 [PubMed]
- 53. Campisi J, Andersen JK, Kapahi P, Melov S. Cellular senescence: a link between cancer and age-related degenerative disease? Semin Cancer Biol. 2011; 21:354–59. https://doi.org/10.1016/j.semcancer.2011.09.001 [PubMed]
- 54. Young AR, Narita M. SASP reflects senescence. EMBO Rep. 2009; 10:228–30. https://doi.org/10.1038/embor.2009.22 [PubMed]
- 55. Coppé JP, Desprez PY, Krtolica A, Campisi J. The senescence-associated secretory phenotype: the dark side of tumor suppression. Annu Rev Pathol. 2010; 5:99–118. https://doi.org/10.1146/annurev-pathol-121808-102144 [PubMed]
- 56. Kang TW, Yevsa T, Woller N, Hoenicke L, Wuestefeld T, Dauch D, Hohmeyer A, Gereke M, Rudalska R, Potapova A, Iken M, Vucur M, Weiss S, et al. Senescence surveillance of pre-malignant hepatocytes limits liver cancer development. Nature. 2011; 479:547–51. https://doi.org/10.1038/nature10599 [PubMed]