


Introduction
Aging represents the largest risk factor for chronic diseases and a significant and growing socioeconomic challenge for most societies worldwide. Nevertheless, what constitutes the human phenotype of aging is not well characterized, likely due to the highly complex and heterogeneous nature of human aging. Indeed, aging is probably caused by the stochastic failure of a myriad of different biological processes leading to increased susceptibility to disease and death [1].
Due to the role of aging in numerous diseases, interventions leading to healthy aging are being heavily investigated. Clinical trials for aging interventions are challenging due to the possibility of long trial times and/or the necessity to investigate large cohorts. The generation of biomarkers that may predict the age and health of an individual has therefore received significant interest. Importantly, several recent breakthroughs have allowed us to discover complex biomarkers, or aging clocks, which are able to predict the age and risk of death and/or age-associated disease of individuals [2–6]. Nevertheless, it is unclear how these biomarkers predict the multitude of phenotypes associated with aging. To this end, having a well-defined phenotypical description of human aging and an understanding of how different aging phenotypes associate with each other will enable us to better understand aging, design trials and discover drugs targeting the aging process.
Herein, we used a previously incomplete list of phenotypes associated with human aging to mine millions of PubMed articles for co-occurring phenotypes, allowing us to better define what we term the human aging phenome. We used this computationally unbiased approach to generate a list of approximately a thousand terms and then manually curated this list to extract features associated with aging. We then validated these features manually against the description of more than 75 million individuals from published studies. Notably, these parameters cover all tissues in the human body and illustrate the heterogeneity of the human aging phenotype. Collectively, our results allow us to propose a description of what human aging is.
Results
Identification of abstracts describing human aging
As a starting point for defining human aging we used 44 clinical terms that we had previously used to describe human aging [7–9]. To increase our ability to capture semantically similar age-associated terms we extracted synonyms and spelling analogues for each of these 44 clinical terms from the SNOMED CT terminology, which contains a comprehensive and validated collection of terms describing clinical features (Table S1, Figure S1A) [10]. In all subsequent analyses using the 44 clinical terms we also included their synonyms and spelling analogues. To quantitatively test whether the terms in the list are associated with human aging, we measured their enrichment in aging-related abstracts when compared to all PubMed abstracts. To that end, we mined 17,730,690 PubMed abstracts for occurrences of the 44 clinical terms and investigated whether they co-occur with the word aging. In addition to aging we included other ‘aging keywords’ with similar semantic meaning, e.g., elderly, old age, retirement (Figure 1A and Table S2, Figure S1B). Indeed, the 44 terms were enriched 3.1-fold (mean, p-value < 2e-16, chi-squared test) in abstracts that also contained aging keywords, suggesting that this list could be used as bait for finding other terms describing aging (Figure 1B, 1C and Figure S2).
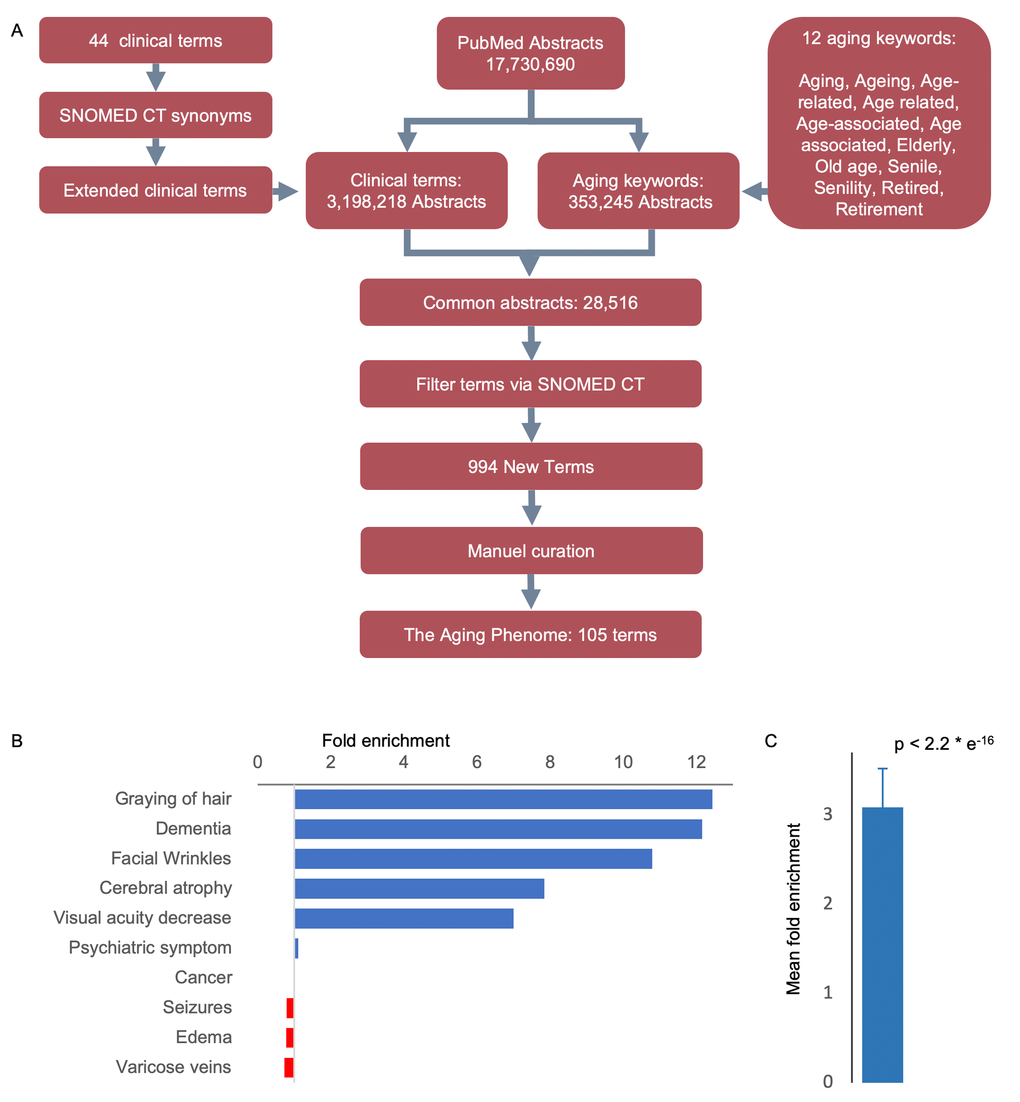
Figure 1. An approach to identifying age-related features. (A) Workflow-diagram of the project. (B) Top and bottom clinical terms that are enriched in the aging dataset (see Figure S1 for the expanded list). (C) Mean enrichment of the terms (Mean ± SEM, n = 44, p-value determine by Chi-square test, see Figure S2 for individual terms).
To qualitatively test the algorithms’ ability to find new terms, we selected 100 random abstracts and manually picked out terms of interest to determine if the text-mining algorithm would be able to capture them. We then calculated the F-measure (F1 score) based on the precision and recall of the algorithm [11]. This score is determined by identifying how many terms are included and how many are missing in the abstracts by comparing a manual selection versus the automated algorithm. The algorithm was calculated to have an Fl score of 0.898, suggesting that our text-mining algorithm captures the majority of terms allowing us to interrogate the aging phenotype.
Mining for potential aging-associated phenotype terms
We next identified 3,198,218 PubMed abstracts containing one or more of the 44 age-associated clinical terms and 431,949 abstracts containing two or more of the 44 age-associated clinical terms. We speculated that abstracts containing two or more age-associated clinical terms are more accurately associated with aging compared to abstracts containing just one term. For example, if we search for abstracts containing the single term ‘cancer’ we would possibly find terms that show only minor association with aging. We therefore compared the frequency of co-occurrence of each of the terms by dividing the number of times a term is mentioned together with any other term versus when it is mentioned on its own (Figure S3). Indeed, if we only considered abstracts where single clinical-terms were mentioned we observed that very common terms, like ‘cancer’, skewed the entire dataset towards those terms instead of aging. We therefore only considered abstracts that contain two or more age-associated clinical terms for finding new terms that describe human aging.
Employing this approach, we identified 28,516 PubMed abstracts which contain: 1) at least two occurrences of the 44 clinical terms, and 2) at least one aging keyword. These age-associated abstracts were then used as a foundation for mining new terms associated with aging. We generated a list of the most frequent words in the age-associated abstracts. We chose a cutoff of at least 100 occurrences, including repeated occurrences of a term in an abstract, as a way to filter the number of terms identified and to make sure that only well-recognized terms are included. We discarded terms based on their semantic tags in SNOMED (e.g., “procedure”, “qualifier value”, “body structure”). This led to the identification of 994 new terms that could be considered age-associated (Table S3).
Association analyses reveal tissue specific clustering in aging
To further investigate the relationships between these features, we generated a clinical term matrix reflecting the co-occurrence of terms in each abstract. To avoid bias towards terms that were more commonly or less commonly mentioned than average, we employed both standard score (z-score) and term frequency–inverse document frequency (tf-idf) normalization [12,13]. These two normalization algorithms compensate for the ways in which terms associate differently: z-score emphasizes connections between more rare co-occurrences while tf-idf emphasizes correlations between more common terms. By using these matrices, we could perform further analyses and investigate how different features associate with each other. To find large-scale patterns in the data we applied T-distributed Stochastic Neighbor Embedding (t-SNE) clustering to the matrices. This unsupervised machine-learning algorithm allowed us to identify groups of terms that appeared closely associated (Figure 2 and Figure S4). In particular, it was apparent that terms relating to specific pathologies (e.g., heart disease, neurodegeneration) associate with one another, thereby validating our normalization methods. Notably, the term cancer appeared to associate with a cluster including ‘iron’, ‘Ferritin’, ‘Anemia’ suggesting that these are possible markers for cancer identification/progression. Indeed, this may be the case [14]. In sum, these algorithms show that the results generated from our data-mining effort agree with current knowledge and suggest that our method is robust.
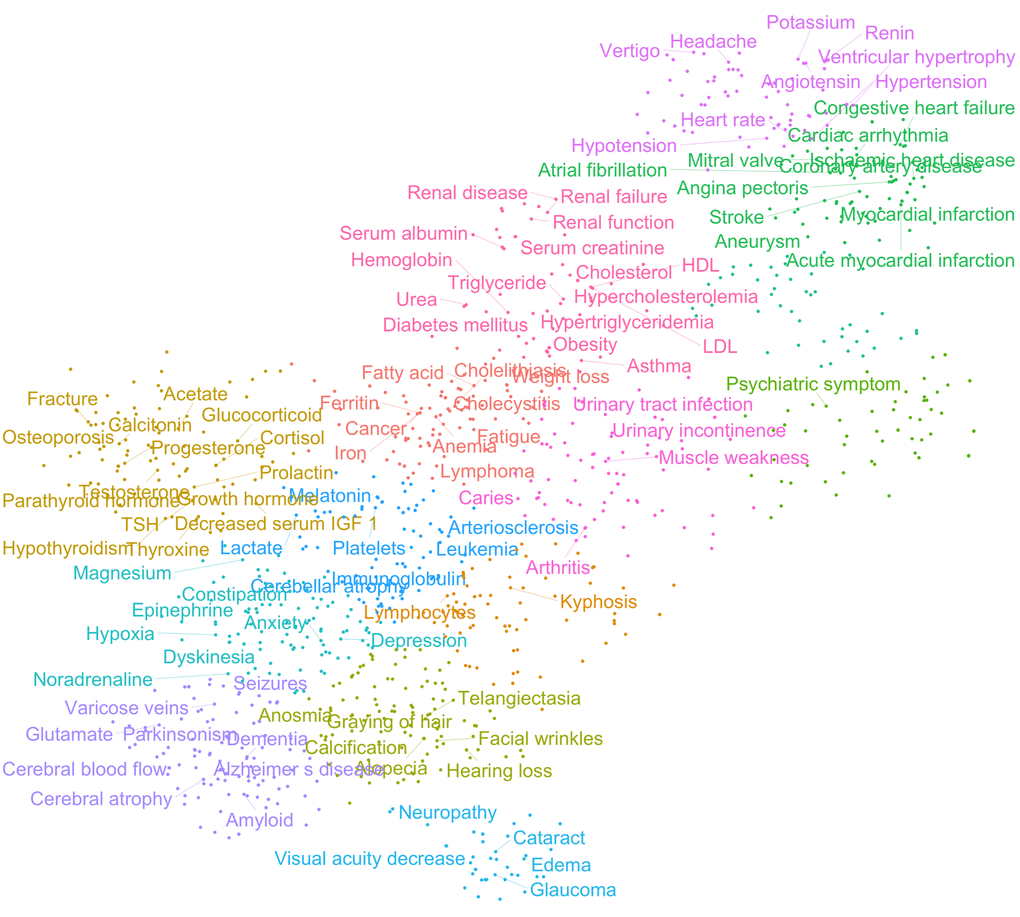
Figure 2. Age-associated clinical terms show distinct pathological clusters. T-distributed Stochastic Neighbor Embedding (t-SNE) clustering of z-score normalized data.
While the 994 terms represent an unbiased list of age-associated terms, it was apparent that many terms are not descriptive of the aging phenotype. To further condense the list of features, we manually curated the list, allowing us to identify 105 age-associated terms that could constitute the aging phenome (Table S4). To understand how these terms correlate with each other, we performed agglomerative hierarchical clustering analysis and created heatmaps of the co-occurrence of the terms. Notably, this allowed us to identify features that are co-associated with each other in aging (Figure 3 and Figure S5A-C). While t-SNE clustering appeared to work well with both tf-idf and z-score normalized data, hierarchical clustering only gave good and meaningful separation using z-score normalized data. Indeed, using this normalization, broad clusters were apparent representing major organ systems. For example, musculoskeletal terms formed a separate cluster, neurological terms another, etc. A number of interesting observations were evident from the clustering. For instance, kidney function appeared to associate more closely with cardiovascular disease than the metabolic cluster containing cholesterol; and facial wrinkles, alopecia and graying of hair associated with a hematological aging cluster.
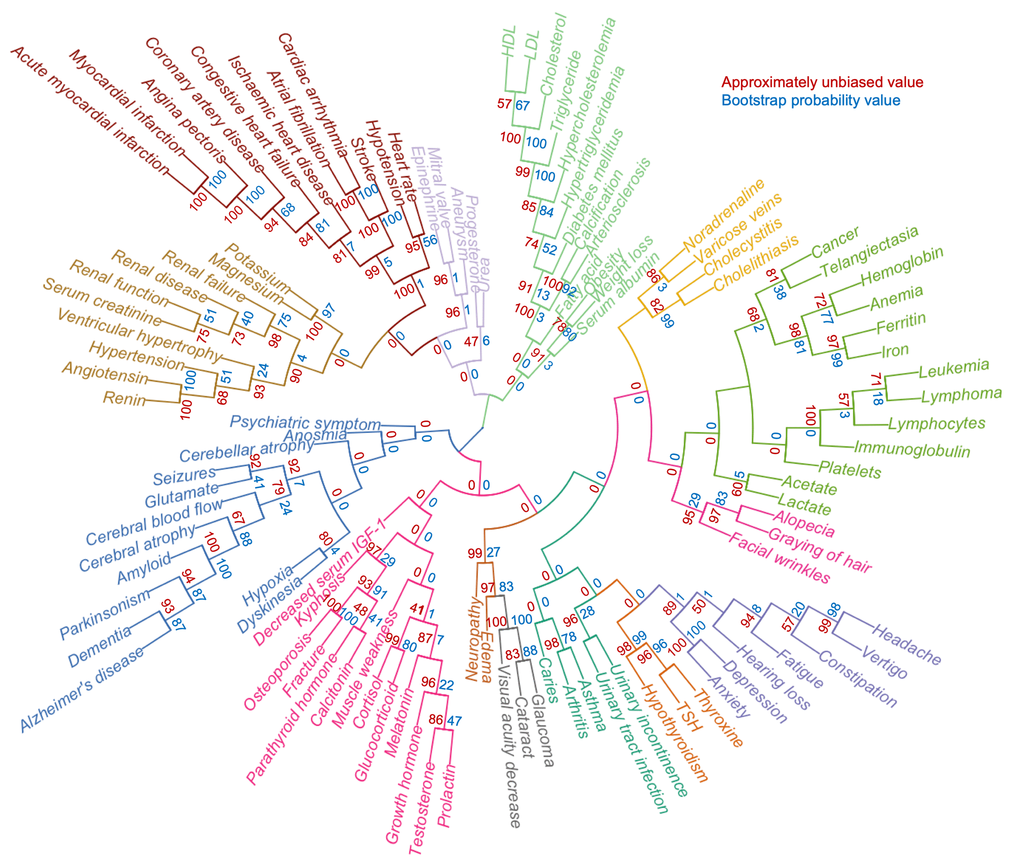
Figure 3. A defined aging phenome shows functional clustering. Agglomerative hierarchical clustering of 105 clinical terms describing human aging based on z-score normalized representation in the literature. Colors represent different clusters. The approximately unbiased value is shown in red while the bootstrap probability value is shown in blue.
Nine cellular and physiological hallmarks have been associated with aging [1]. To understand how each hallmark might contribute to the aging phenome and the observed clustering of terms, we mined the PubMed data for the hallmark terms and their synonyms (Table S5) allowing us to rank how each hallmark contributes to each term. This allowed us to generate a hierarchical clustering and heatmap of the terms and their relationships with the hallmarks (Figure 4). Quite strikingly, clusters of terms were associated with specific hallmarks, suggesting that these hallmarks are driving that specific cluster. For example, neurodegenerative diseases were associated with the proteostasis hallmark, while a metabolic cluster of obesity, weight loss, hypertriglyceridemia was associated with the nutrient sensing aging hallmark. This approach also allowed us to understand how the hallmarks relate to each other. It was evident that genomic instability was associated with telomere attrition; and stem cell exhaustion appeared to be associated with altered intercellular communication. These two clusters were associated with cellular senescence. While this approach gives us a good understanding of how the different terms associate with each other and the potential underlying molecular basis of this clustering, it remains unclear how each term contributes to aging.
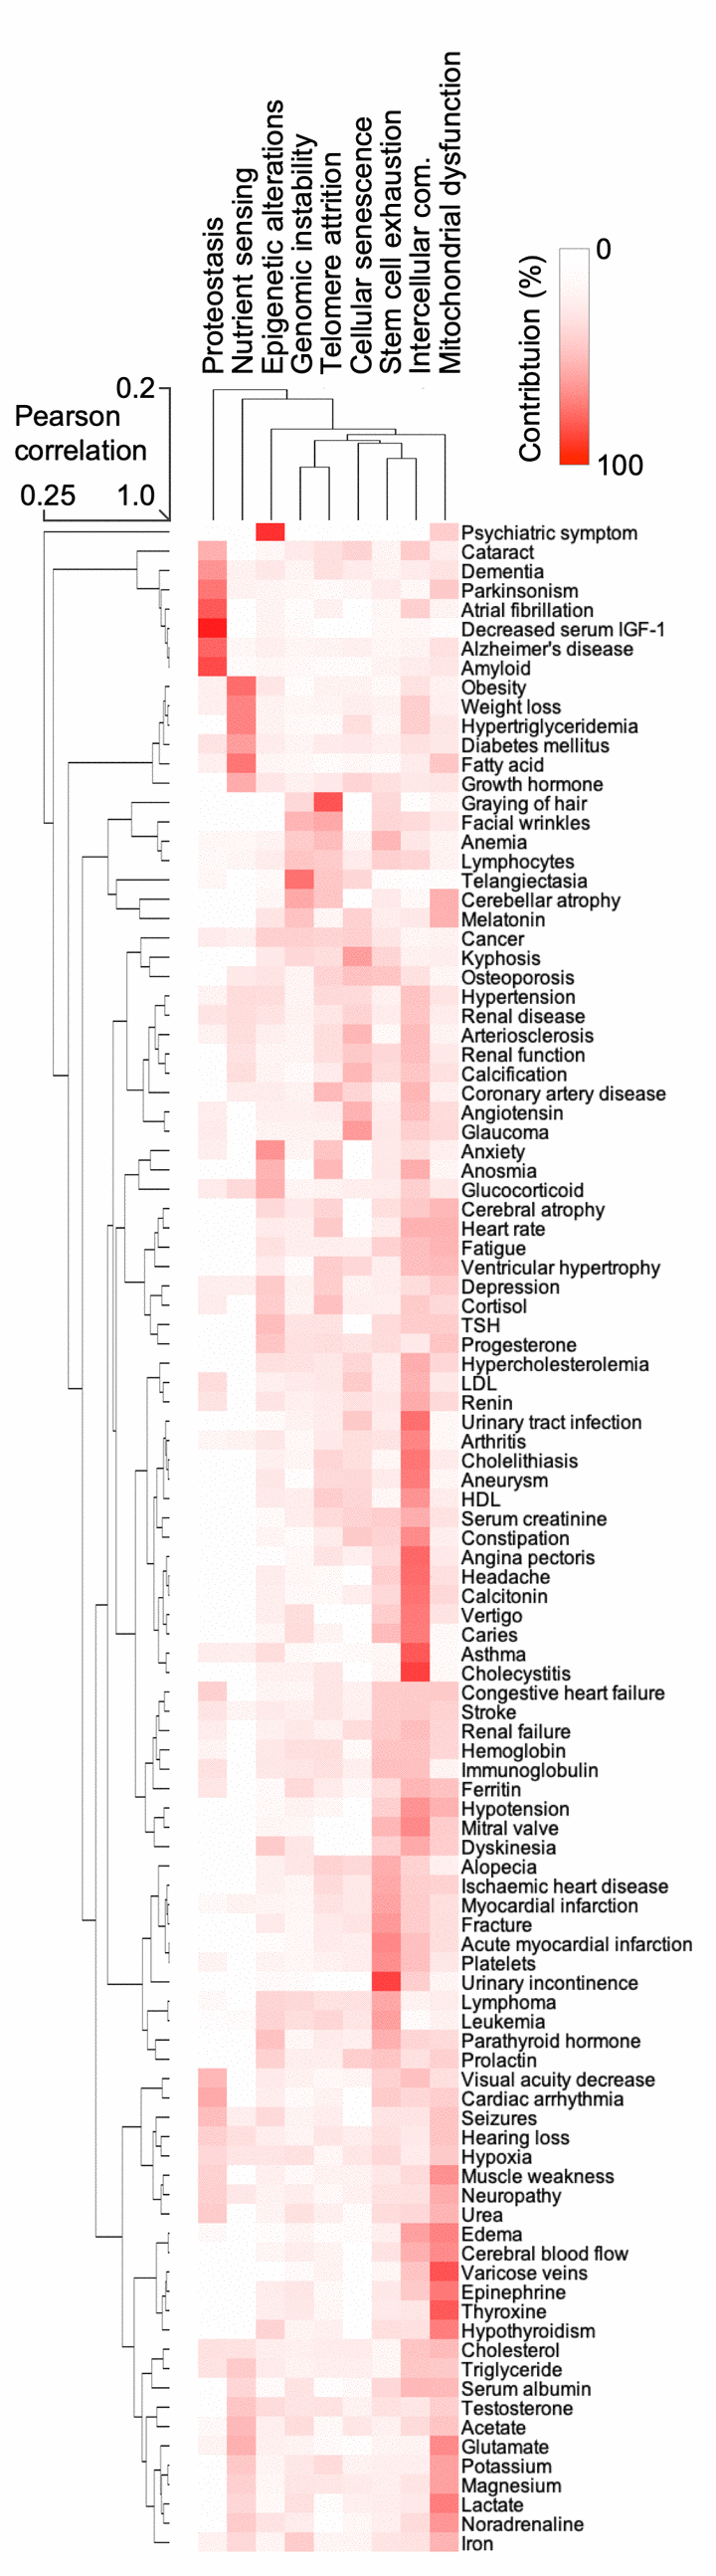
Figure 4. The hallmarks of aging are associated with certain human features. Heatmap and cluster analysis of the association between age-associated clinical terms and hallmarks of aging.
It is likely that not all features are equally important in aging. We therefore weighed the terms based on the frequency of their occurrence in abstracts also containing the aging keywords. We found 170,350 abstracts containing the 105 terms from the final list and aging keywords. Terms were counted as present or absent with a frequency ranging from 10 to 26,845 abstract occurrences (mean of 2702.67, Figure S6). Notably, we found dementia, cancer, depression, and hypertension among the most strongly age-associated terms in the literature. Interestingly, terms like “graying of hair” and “facial wrinkles” were among the 10 least frequent terms, despite being highly prevalent in the aging population [15]. This indicates a discrepancy between the perceived importance in PubMed and the real prevalence in the general population.
Manual curation producing a weighted aging phenome
To understand the importance of these terms in normal aging, we manually identified papers describing cohorts of individuals where the prevalence of the new age-associated terms was described. Since some features reflect similar processes (e.g., increased serum levels of creatinine and kidney disease), these terms were combined to allow subsequent comparative analyses. In total, the prevalence of the features from a variety of published cohorts describing a total of 76,928,696 individuals aged 65 years or older where identified, allowing us to comprehensively describe the prevalence of the different features in aging (Figure 5A) [15–70]. This process further allowed us to compare how human aging is associated with other diseases based on the prevalence of features [7–9]. To this end, we performed hierarchical clustering between aging and known premature aging diseases, primary mitochondrial disorders, and some non-mitochondrial control diseases [71]. Notably, aging clustered strongly with known premature aging diseases: Werner syndrome and Hutchinson-Gilford progeria, and these in turn clustered with primary mitochondrial diseases (Figure 5B). In sum, we were able to define and quantify a human aging phenome covering all tissues in the body.
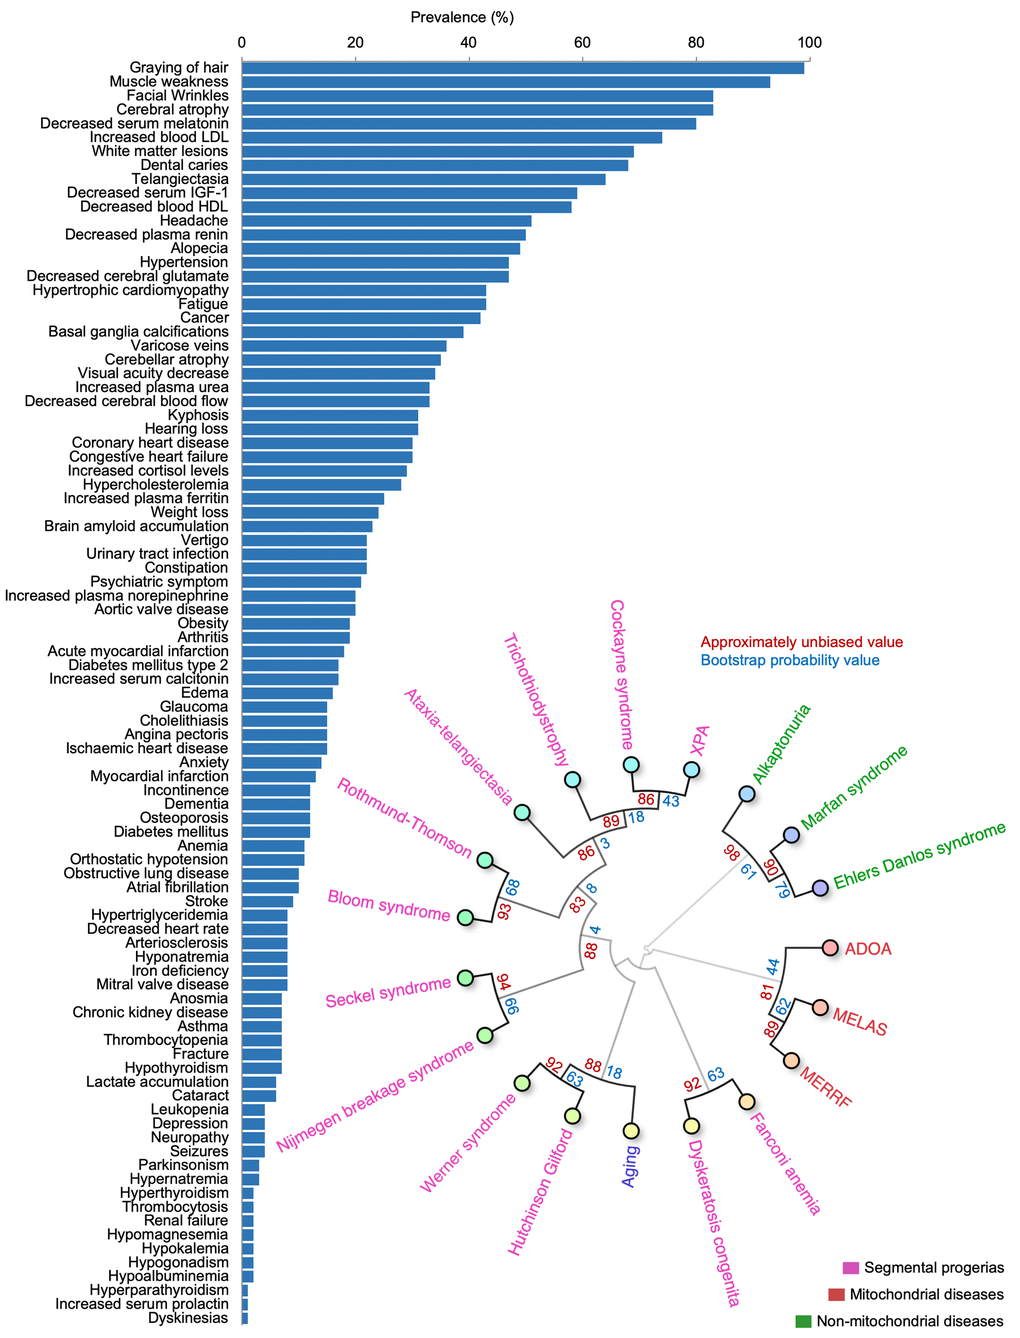
Figure 5. The aging phenome. (A) The prevalence of features in the elderly (manually curated literature describing 76,928,696 individuals). HDL: High density lipoprotein, IGF-1: Insulin like growth factor-1, LDL: Low density lipoprotein (B) Agglomerative hierarchical clustering using uncentered similarity and average linkage of aging and genetic diseases (red: primary mitochondrial disorders, green: non-mitochondrial disorders, purple: segmental progerias). The approximately unbiased value is shown in red while the bootstrap probability value is shown in blue. ADOA: Autosomal dominant optic atrophy, MELAS: Mitochondrial encephalopathy, lactic acidosis, and stroke-like episodes, MERRF: Myoclonic epilepsy with ragged-red fibers, XPA: Xeroderma pigmentosum complementation group A.
Discussion
Aging is among the most complex phenotype in humans. Indeed, the list of features found here reflects the multitude of pathologies associated with aging. Of note, we were able to identify a number of large-scale clusters within the aging phenome that associate with specific molecular pathways. This finding could indicate that clustered phenotypes share common etiologies. Indeed, loss of proteostasis is associated with multiple neurodegenerative diseases and this appeared to be corroborated with our approach. Quite interestingly, this could also indicate that there are only a few underlying processes driving each of the different phenotype clusters, suggesting that targeting these root causes may be a good strategy for treating multiple age-associated pathologies.
Determining the importance of the different features of aging is challenging. Herein, we created a ranked list of features associated with aging. The top ranked term was dementia followed by cancer, depression, hypertension, fractures, and stroke. Notably, while these features are certainly important, they are much less prevalent than features such as muscle weakness, facial wrinkles and graying of hair. Indeed, such features were considerably underrepresented in the aging research literature despite being some of the most prevalent in human aging. One could speculate that these under-represented features of aging could be good research targets in future studies. Further, the fact that some features are highly prevalent yet rarely studied could indicate that our data-mining approach incompletely describes human aging. Nevertheless, the identified terms appear to describe human aging comprehensively as well as have clinical relevance in terms of premature aging diseases. Further, the terms cluster well with each other and with the previously manually generated list of 44 terms indicating that our approach appears to be valid.
In conclusion, the aging phenome could be used in a myriad of applications. For instance, the critical knowledge of the aging phenome could determine possible outcomes for clinical trials, for identifying new biomarkers of aging and for discovering how different pathologies arise in aging. As shown, the aging phenome could also be used to better classify premature aging diseases, a group of disorders that could be of interest in understanding the mechanistic basis of aging.
Materials and Methods
Software
All source code used in this paper can be found at https://github.com/scheibye-knudsen-lab/aging-phenome/ .
PubMed Baseline Repository
17,730,690 journal abstracts from the PubMed Baseline Repository [72] (Last Updated November 28, 2017) were downloaded and used for subsequent analyses.
SNOMED clinical terms
SNOMED CT [10] was used as a source of terms as well as synonyms and spelling analogues for terms.
Synonyms of age-associated clinical terms
44 previously described age-associated clinical terms [7] were augmented with up to 20 synonyms and spelling analogues as defined in SNOMED CT [73], e.g. “Graying of hair”, “Gray Hair” (Table S1). Synonyms and spelling analogues were counted towards their corresponding original term.
Aging keywords
To identify abstracts that are associated with aging, we used a list of aging keywords, e.g. “aging”, “aging related”, “old age” and “retirement” along with spelling analogues, e.g. “ageing”, “ageing-related” (Table S2).
Abstract identification and word matrix generation
PubMed abstracts were searched for the presence of the 44 age-associated clinical terms yielding a feature matrix signifying the presence or absence of each of the terms in each of the 17,730,690 PubMed abstracts. We then discarded abstracts where no age-associated clinical terms were present yielding a remaining 3,198,218 abstracts with one or more terms present. Similarly, we constructed a matrix signifying the presence or absence of each of the 12 aging keywords in the 17,730,690 PubMed abstracts. 353,245 abstracts were found to contain one or more of the 12 aging keywords. 28,516 abstracts were identified where both an aging-keyword and at least two clinical terms were present and this was used to generate a matrix of combined terms.
Precision and recall (F1 score)
The precision of the search algorithm to find all the correct clinical terms was examined by selecting 100 random abstracts and manually identifying terms of interest. Hereafter, the terms were counted if found (or not) by the search algorithm. To evaluate the precision of the algorithm we calculated an F-measure (F1 score) for the terms that were found (true positive) and that were not found (false negative) by the algorithm, compared with the manually identified terms.
Enrichment of age-associated clinical terms in abstracts containing aging keywords
The total number of times a clinical term was present in the 353,245 abstracts containing aging keywords was calculated. This is the aging-count. To find the expected count, 353,245 abstracts were randomly selected from the entire data set of 17,730,690 abstracts and the total number of times a clinical term was present was calculated. This was repeated 100 times and the average total count per clinical term was calculated. This is the expected-count. The ratio between the aging-count and the expected-count was then calculated per clinical term as a measurement of enrichment of terms in age-associated abstracts.
New aging clinical terms from PubMed abstracts
67,901 SNOMED CT terms were found to be present in the 28,516 abstracts where both an aging-keyword and at least two clinical terms were present (see above). We discarded terms mentioned less than 100 times as those would be weaker candidates for newly discovered aging clinical terms. This reduced the list of potential new terms to 10,486.
This list of terms was filtered based on the following unwanted semantic tags associated with SNOMED CT terms: ‘procedure’, ‘qualifier value’, ‘body structure’, ‘attribute’, ‘organism’, ‘person’, ‘regime/therapy’, ‘ethnic group’, ‘environment’, ‘physical object’, ‘tumor staging’, and ‘geographic location’. Words containing ‘/’ signified unit measures and were also removed. This resulted in a final list of 994 terms.
Word matrix normalization
A combined set (n=1050) of age-associated clinical terms (44) and aging keywords (12) as well as the newly generated list of clinical terms (994) was projected into a count-matrix that consisted of 1050 terms against 28,516 abstracts. The value inserted in the matrix was 1 if the term was present in the abstract and 0 if it was absent. For normalization the values were subsequently converted into (1) z-score (z-scorex = (mean – valuex) / standard deviation) using the python scipy.stats.zscore library and (2) tf-idf using the sklearn.feature_extraction library [74].
Manual curation of new age-associated clinical terms
We manually curated the list of 994 candidate age-associated clinical terms to exclude concepts that are clearly not aging related, e.g. “disorder” or “enzyme”, yielding a list of 105 terms: the aging-phenome.
Hallmarks of aging analysis
The nine hallmarks of aging were augmented with up to three synonyms from SNOMED CT. The 17,730,690 abstracts were then mined for mentions of one or more of the nine hallmarks of aging. The abstracts containing hallmarks of aging (673,409) were then mined for the 105 human aging-phenome terms. First, we counted the co-occurrence of each of the 105 aging phenome terms with each hallmark of aging, and summarized in a count matrix with terms as rows and hallmarks as columns. Second, the count matrix was normalized, by dividing each value in the matrix by the total count (sum of the column) of each hallmark of aging. Third, for each term, we calculated the percentage contribution from each hallmark of aging. This percentage matrix was used for the generation of a heatmap and agglomerative hierarchical clustering.
Circular dendrogram
Agglomerative hierarchical clustering of the z-score and tf-idf normalized matrices was performed using Euclidian distance and average similarity, and plotted in a circular dendrogram using the ‘ape’ R package. We manually identified 14 clusters of terms that fit well together, e.g. Glaucoma, Cataract and Visual acuity decrease, and colored the dendrogram accordingly.
T-distributed Stochastic Neighbor Embedding (t-SNE)
T-distributed Stochastic Neighbor Embedding (t-SNE) [75] was performed using TensorFlow’s online implementation of t-SNE (projector.tensorflow.org) by loading the matrix of the 105 word-vectors on 28,516 PubMed abstracts. Since we applied normalization to the data, we turned TensorFlow’s spherize data feature off. We elected to visualize the results in two-dimensional space and accepted TensorFlow’s default values for perplexity (=9) and learning rate (=10.) The algorithm was allowed to run for 10,925 iterations. We then applied k-means clustering to the two-dimensional t-SNE coordinates and colored the clusters accordingly. We elected to cluster 14 centers in accordance with the number of clusters we identified manually in the circular dendrogram.
Heatmap
We used the ‘Pheatmap’ R package [76] to generate a clustered heatmap of the z-score and tf-idf normalized matrices of the 105 aging phenome. Agglomerative hierarchical clustering for both the terms and abstracts was done using average-linkage and Euclidian distance.
Term frequency in abstracts
We performed a text search for the 105 terms with synonyms to evaluate the occurrence frequency of these terms in the literature. The analysis was performed only on the 353,245 abstracts also containing aging keywords. The terms with synonyms were collapsed into the ‘main’ term and only counted as present (one) or absent (zero) in each abstract.
Identification of prevalence
Manual identification of the prevalence of each of the 105 terms in populations aged 65 or older was performed by searching PubMed for articles where cohorts were described. Each term was searched in PubMed along with the keywords ‘prevalence’ and/or 'clinical’ and/or ‘elderly’/’aging’/’retired’. For each term we attempted to identify the most recent and largest cohort available. In some cases we had to calculate how many elderly individuals had abnormal values compared to young individuals. For example, average lactate increases with age [16], but to define a prevalence of “lactate accumulation” we calculated the percentage of elderly individuals that were more than 2 standard deviations different from young individuals. In some cases, terms were redefined to more descriptive terms. For example, the term “platelets” was redefined to “thrombocytopenia” and “thrombocytosis,” and the prevalence of those terms was identified.
Statistics
Statistical tests were conducted as indicated in the text. Bootstrap resampling (100 iterations) was applied to hierarchical clustering using the ‘pvclust’ R package [77].
Acknowledgements
We would like to thank Melanie Broadley for critically reading our manuscript.
Conflicts of Interest
The authors declare no conflicts of interest.
Funding
MSK is funded by the Novo Nordisk Foundation (#NNF17OC0027812), the Nordea Foundation (#02-2017-1749), the Danish Cancer Society (#R167-A11015_001), the Independent Research Fund Denmark (#7016-00230B) and the Kirsten og Freddy Johansens Foundation.
References
- 1. López-Otín C, Blasco MA, Partridge L, Serrano M, Kroemer G. The hallmarks of aging. Cell. 2013; 153:1194–217. https://doi.org/10.1016/j.cell.2013.05.039 [PubMed]
- 2. Horvath S. DNA methylation age of human tissues and cell types. Genome Biol. 2013; 14:R115. https://doi.org/10.1186/gb-2013-14-10-r115 [PubMed]
- 3. Mamoshina P, Kochetov K, Putin E, Cortese F, Aliper A, Lee WS, Ahn SM, Uhn L, Skjodt N, Kovalchuk O, Scheibye-Knudsen M, Zhavoronkov A. Population specific biomarkers of human aging: a big data study using South Korean, Canadian and Eastern European patient populations. J Gerontol A Biol Sci Med Sci. 2018; 73:1482–90. https://doi.org/10.1093/gerona/gly005 [PubMed]
- 4. Fleischer JG, Schulte R, Tsai HH, Tyagi S, Ibarra A, Shokhirev MN, Huang L, Hetzer MW, Navlakha S. Predicting age from the transcriptome of human dermal fibroblasts. Genome Biol. 2018; 19:221. https://doi.org/10.1186/s13059-018-1599-6 [PubMed]
- 5. Bobrov E, Georgievskaya A, Kiselev K, Sevastopolsky A, Zhavoronkov A, Gurov S, Rudakov K, Del Pilar Bonilla Tobar M, Jaspers S, Clemann S. PhotoAgeClock: deep learning algorithms for development of non-invasive visual biomarkers of aging. Aging (Albany NY). 2018; 10:3249–59. https://doi.org/10.18632/aging.101629 [PubMed]
- 6. Lu AT, Quach A, Wilson JG, Reiner AP, Aviv A, Raj K, Hou L, Baccarelli AA, Li Y, Stewart JD, Whitsel EA, Assimes TL, Ferrucci L, Horvath S. DNA methylation GrimAge strongly predicts lifespan and healthspan. Aging (Albany NY). 2019; 11:303–27. https://doi.org/10.18632/aging.101684 [PubMed]
- 7. Scheibye-Knudsen M, Scheibye-Alsing K, Canugovi C, Croteau DL, Bohr VA. A novel diagnostic tool reveals mitochondrial pathology in human diseases and aging. Aging (Albany NY). 2013; 5:192–208. https://doi.org/10.18632/aging.100546 [PubMed]
- 8. Scheibye-Knudsen M, Tseng A, Borch Jensen M, Scheibye-Alsing K, Fang EF, Iyama T, Bharti SK, Marosi K, Froetscher L, Kassahun H, Eckley DM, Maul RW, Bastian P, et al. Cockayne syndrome group A and B proteins converge on transcription-linked resolution of non-B DNA. Proc Natl Acad Sci USA. 2016; 113:12502–07. https://doi.org/10.1073/pnas.1610198113 [PubMed]
- 9. Fang EF, Scheibye-Knudsen M, Brace LE, Kassahun H, SenGupta T, Nilsen H, Mitchell JR, Croteau DL, Bohr VA. Defective mitophagy in XPA via PARP-1 hyperactivation and NAD(+)/SIRT1 reduction. Cell. 2014; 157:882–96. https://doi.org/10.1016/j.cell.2014.03.026 [PubMed]
- 10. Donnelly K. SNOMED-CT: the advanced terminology and coding system for eHealth. Stud Health Technol Inform. 2006; 121:279–90. [PubMed]
- 11. Powers DM. Evaluation: from Precision, Recall and F-measure to ROC, Informedness, Markedness and Correlation. 2011. https://dspace.flinders.edu.au/xmlui/handle/2328/27165.
- 12. Curtis AE, Smith TA, Ziganshin BA, Elefteriades JA. The Mystery of the Z-Score. Aorta (Stamford). 2016; 4:124–30. https://doi.org/10.12945/j.aorta.2016.16.014 [PubMed]
- 13. Wilbur WJ, Kim W. The Ineffectiveness of Within - Document Term Frequency in Text Classification. Inf Retr Boston. 2009; 12:509–25. https://doi.org/10.1007/s10791-008-9069-5 [PubMed]
- 14. Fonseca-Nunes A, Jakszyn P, Agudo A. Iron and cancer risk--a systematic review and meta-analysis of the epidemiological evidence. Cancer Epidemiol Biomarkers Prev. 2014; 23:12–31. https://doi.org/10.1158/1055-9965.EPI-13-0733 [PubMed]
- 15. Schnohr P, Lange P, Nyboe J, Appleyard M, Jensen G. Gray hair, baldness, and wrinkles in relation to myocardial infarction: the Copenhagen City Heart Study. Am Heart J. 1995; 130:1003–10. https://doi.org/10.1016/0002-8703(95)90201-5 [PubMed]
- 16. Leen WG, Willemsen MA, Wevers RA, Verbeek MM. Cerebrospinal fluid glucose and lactate: age-specific reference values and implications for clinical practice. PLoS One. 2012; 7:e42745. https://doi.org/10.1371/journal.pone.0042745 [PubMed]
- 17. Weidmann P, De Myttenaere-Bursztein S, Maxwell MH, de Lima J. Effect on aging on plasma renin and aldosterone in normal man. Kidney Int. 1975; 8:325–33. https://doi.org/10.1038/ki.1975.120 [PubMed]
- 18. Peräsalo R, Raitta C. The prevalence and type of glaucoma in geriatric patients. Acta Ophthalmol (Copenh). 1992; 70:308–11. https://doi.org/10.1111/j.1755-3768.1992.tb08569.x [PubMed]
- 19. Woerner MG, Kane JM, Lieberman JA, Alvir J, Bergmann KJ, Borenstein M, Schooler NR, Mukherjee S, Rotrosen J, Rubinstein M, Basavaraju N. The prevalence of tardive dyskinesia. J Clin Psychopharmacol. 1991; 11:34–42. https://doi.org/10.1097/00004714-199102000-00005 [PubMed]
- 20. Sawin CT, Carlson HE, Geller A, Castelli WP, Bacharach P. Serum prolactin and aging: basal values and changes with estrogen use and hypothyroidism. J Gerontol. 1989; 44:M131–35. https://doi.org/10.1093/geronj/44.4.M131 [PubMed]
- 21. Levy D, Anderson KM, Savage DD, Kannel WB, Christiansen JC, Castelli WP. Echocardiographically detected left ventricular hypertrophy: prevalence and risk factors. The Framingham Heart Study. Ann Intern Med. 1988; 108:7–13. https://doi.org/10.7326/0003-4819-108-1-7 [PubMed]
- 22. Campbell AJ, Reinken J, McCosh L. Incontinence in the elderly: prevalence and prognosis. Age Ageing. 1985; 14:65–70. https://doi.org/10.1093/ageing/14.2.65 [PubMed]
- 23. Touitou Y, Proust J, Carayon A, Klinger E, Nakache JP, Huard D, Sachet A. Plasma ferritin in old age. Influence of biological and pathological factors in a large elderly population. Clin Chim Acta. 1985; 149:37–45. https://doi.org/10.1016/0009-8981(85)90271-2 [PubMed]
- 24. Haavisto M, Geiger U, Mattila K, Rajala S. A health survey of the very aged in Tampere, Finland. Age Ageing. 1984; 13:266–72. https://doi.org/10.1093/ageing/13.5.266 [PubMed]
- 25. Loré F, Galli M, Franci B, Martorelli MT. Calcitonin levels in normal subjects according to age and sex. Biomed Pharmacother. 1984; 38:261–63. [PubMed]
- 26. Barnes RF, Raskind M, Gumbrecht G, Halter JB. The effects of age on the plasma catecholamine response to mental stress in man. J Clin Endocrinol Metab. 1982; 54:64–69. https://doi.org/10.1210/jcem-54-1-64 [PubMed]
- 27. Koller WC, Glatt SL, Fox JH, Kaszniak AW, Wilson RS, Huckman MS. Cerebellar atrophy: relationship to aging and cerebral atrophy. Neurology. 1981; 31:1486–88. https://doi.org/10.1212/WNL.31.11.1486 [PubMed]
- 28. Ito M, Hatazawa J, Yamaura H, Matsuzawa T. Age-related brain atrophy and mental deterioration--a study with computed tomography. Br J Radiol. 1981; 54:384–90. https://doi.org/10.1259/0007-1285-54-641-384 [PubMed]
- 29. Lupien S, Lecours AR, Schwartz G, Sharma S, Hauger RL, Meaney MJ, Nair NP. Longitudinal study of basal cortisol levels in healthy elderly subjects: evidence for subgroups. Neurobiol Aging. 1996; 17:95–105. https://doi.org/10.1016/0197-4580(95)02005-5 [PubMed]
- 30. Beghi E, Monticelli ML, and Italian General Practitioner Study Group (IGPST). Chronic symmetric symptomatic polyneuropathy in the elderly: a field screening investigation of risk factors for polyneuropathy in two Italian communities. J Clin Epidemiol. 1998; 51:697–702. https://doi.org/10.1016/S0895-4356(98)00039-0 [PubMed]
- 31. Chen CY, Lu CL, Lee PC, Wang SS, Chang FY, Lee SD. The risk factors for gallstone disease among senior citizens: an Oriental study. Hepatogastroenterology. 1999; 46:1607–12. [PubMed]
- 32. Steffens DC, Skoog I, Norton MC, Hart AD, Tschanz JT, Plassman BL, Wyse BW, Welsh-Bohmer KA, Breitner JC. Prevalence of depression and its treatment in an elderly population: the Cache County study. Arch Gen Psychiatry. 2000; 57:601–07. [PubMed]
- 33. Prencipe M, Casini AR, Ferretti C, Santini M, Pezzella F, Scaldaferri N, Culasso F. Prevalence of headache in an elderly population: attack frequency, disability, and use of medication. J Neurol Neurosurg Psychiatry. 2001; 70:377–81. https://doi.org/10.1136/jnnp.70.3.377 [PubMed]
- 34. Tenenhouse A, Joseph L, Kreiger N, Poliquin S, Murray TM, Blondeau L, Berger C, Hanley DA, Prior JC, and CaMos Research Group.Canadian Multicentre Osteoporosis Study. Estimation of the prevalence of low bone density in Canadian women and men using a population-specific DXA reference standard: the Canadian Multicentre Osteoporosis Study (CaMos). Osteoporos Int. 2000; 11:897–904. https://doi.org/10.1007/s001980070050 [PubMed]
- 35. Mishima K, Okawa M, Shimizu T, Hishikawa Y. Diminished melatonin secretion in the elderly caused by insufficient environmental illumination. J Clin Endocrinol Metab. 2001; 86:129–34. https://doi.org/10.1210/jcem.86.1.7097 [PubMed]
- 36. Coban E, Timuragaoglu A, Meriç M. Iron deficiency anemia in the elderly: prevalence and endoscopic evaluation of the gastrointestinal tract in outpatients. Acta Haematol. 2003; 110:25–28. https://doi.org/10.1159/000072410 [PubMed]
- 37. Guralnik JM, Eisenstaedt RS, Ferrucci L, Klein HG, Woodman RC. Prevalence of anemia in persons 65 years and older in the United States: evidence for a high rate of unexplained anemia. Blood. 2004; 104:2263–68. https://doi.org/10.1182/blood-2004-05-1812 [PubMed]
- 38. Kado DM, Huang MH, Karlamangla AS, Barrett-Connor E, Greendale GA. Hyperkyphotic posture predicts mortality in older community-dwelling men and women: a prospective study. J Am Geriatr Soc. 2004; 52:1662–67. https://doi.org/10.1111/j.1532-5415.2004.52458.x [PubMed]
- 39. Kaiser LG, Schuff N, Cashdollar N, Weiner MW. Age-related glutamate and glutamine concentration changes in normal human brain: 1H MR spectroscopy study at 4 T. Neurobiol Aging. 2005; 26:665–72. https://doi.org/10.1016/j.neurobiolaging.2004.07.001 [PubMed]
- 40. Chiesa R, Marone EM, Limoni C, Volonté M, Schaefer E, Petrini O. Chronic venous insufficiency in Italy: the 24-cities cohort study. Eur J Vasc Endovasc Surg. 2005; 30:422–29. https://doi.org/10.1016/j.ejvs.2005.06.005 [PubMed]
- 41. Olichney JM, Murphy C, Hofstetter CR, Foster K, Hansen LA, Thal LJ, Katzman R. Anosmia is very common in the Lewy body variant of Alzheimer’s disease. J Neurol Neurosurg Psychiatry. 2005; 76:1342–47. https://doi.org/10.1136/jnnp.2003.032003 [PubMed]
- 42. Maggio M, Ble A, Ceda GP, Metter EJ. Decline in insulin-like growth factor-I levels across adult life span in two large population studies. J Gerontol A Biol Sci Med Sci. 2006; 61:182–83. https://doi.org/10.1093/gerona/61.2.182 [PubMed]
- 43. Naughton C, Bennett K, Feely J. Prevalence of chronic disease in the elderly based on a national pharmacy claims database. Age Ageing. 2006; 35:633–36. https://doi.org/10.1093/ageing/afl106 [PubMed]
- 44. Hayat MJ, Howlader N, Reichman ME, Edwards BK. Cancer statistics, trends, and multiple primary cancer analyses from the Surveillance, Epidemiology, and End Results (SEER) Program. Oncologist. 2007; 12:20–37. https://doi.org/10.1634/theoncologist.12-1-20 [PubMed]
- 45. Gom I, Fukushima H, Shiraki M, Miwa Y, Ando T, Takai K, Moriwaki H. Relationship between serum albumin level and aging in community-dwelling self-supported elderly population. J Nutr Sci Vitaminol (Tokyo). 2007; 53:37–42. https://doi.org/10.3177/jnsv.53.37 [PubMed]
- 46. Melov S, Tarnopolsky MA, Beckman K, Felkey K, Hubbard A. Resistance exercise reverses aging in human skeletal muscle. PLoS One. 2007; 2:e465. https://doi.org/10.1371/journal.pone.0000465 [PubMed]
- 47. Musch W, Verfaillie L, Decaux G. Age-related increase in plasma urea level and decrease in fractional urea excretion: clinical application in the syndrome of inappropriate secretion of antidiuretic hormone. Clin J Am Soc Nephrol. 2006; 1:909–14. https://doi.org/10.2215/CJN.00320106 [PubMed]
- 48. Bangen KJ, Restom K, Liu TT, Jak AJ, Wierenga CE, Salmon DP, Bondi MW. Differential age effects on cerebral blood flow and BOLD response to encoding: associations with cognition and stroke risk. Neurobiol Aging. 2009; 30:1276–87. https://doi.org/10.1016/j.neurobiolaging.2007.11.012 [PubMed]
- 49. Simoni M, Pantoni L, Pracucci G, Palmertz B, Guo X, Gustafson D, Skoog I. Prevalence of CT-detected cerebral abnormalities in an elderly Swedish population sample. Acta Neurol Scand. 2008; 118:260–67. https://doi.org/10.1111/j.1600-0404.2008.01010.x [PubMed]
- 50. Hardy SE, Studenski SA. Fatigue predicts mortality in older adults. J Am Geriatr Soc. 2008; 56:1910–14. https://doi.org/10.1111/j.1532-5415.2008.01957.x [PubMed]
- 51. Lloyd-Jones D, Adams R, Carnethon M, De Simone G, Ferguson TB, Flegal K, Ford E, Furie K, Go A, Greenlund K, Haase N, Hailpern S, Ho M, et al, and American Heart Association Statistics Committee and Stroke Statistics Subcommittee. Heart disease and stroke statistics--2009 update: a report from the American Heart Association Statistics Committee and Stroke Statistics Subcommittee. Circulation. 2009; 119:480–86. https://doi.org/10.1161/CIRCULATIONAHA.108.191259 [PubMed]
- 52. Stevens LA, Li S, Wang C, Huang C, Becker BN, Bomback AS, Brown WW, Burrows NR, Jurkovitz CT, McFarlane SI, Norris KC, Shlipak M, Whaley-Connell AT, et al. Prevalence of CKD and comorbid illness in elderly patients in the United States: results from the Kidney Early Evaluation Program (KEEP). Am J Kidney Dis. 2010 (Suppl 2); 55:S23–33. https://doi.org/10.1053/j.ajkd.2009.09.035 [PubMed]
- 53. Siilin H, Lundgren E, Mallmin H, Mellström D, Ohlsson C, Karlsson M, Orwoll E, Ljunggren O. Prevalence of primary hyperparathyroidism and impact on bone mineral density in elderly men: MrOs Sweden. World J Surg. 2011; 35:1266–72. https://doi.org/10.1007/s00268-011-1062-2 [PubMed]
- 54. Tajar A, Huhtaniemi IT, O’Neill TW, Finn JD, Pye SR, Lee DM, Bartfai G, Boonen S, Casanueva FF, Forti G, Giwercman A, Han TS, Kula K, et al, and EMAS Group. Characteristics of androgen deficiency in late-onset hypogonadism: results from the European Male Aging Study (EMAS). J Clin Endocrinol Metab. 2012; 97:1508–16. https://doi.org/10.1210/jc.2011-2513 [PubMed]
- 55. Feinstein M, Ning H, Kang J, Bertoni A, Carnethon M, Lloyd-Jones DM. Racial differences in risks for first cardiovascular events and noncardiovascular death: the Atherosclerosis Risk in Communities study, the Cardiovascular Health Study, and the Multi-Ethnic Study of Atherosclerosis. Circulation. 2012; 126:50–59. https://doi.org/10.1161/CIRCULATIONAHA.111.057232 [PubMed]
- 56. Oraka E, Kim HJ, King ME, Callahan DB. Asthma prevalence among US elderly by age groups: age still matters. J Asthma. 2012; 49:593–99. https://doi.org/10.3109/02770903.2012.684252 [PubMed]
- 57. Liamis G, Rodenburg EM, Hofman A, Zietse R, Stricker BH, Hoorn EJ. Electrolyte disorders in community subjects: prevalence and risk factors. Am J Med. 2013; 126:256–63. https://doi.org/10.1016/j.amjmed.2012.06.037 [PubMed]
- 58. Dahl AK, Fauth EB, Ernsth-Bravell M, Hassing LB, Ram N, Gerstof D. Body mass index, change in body mass index, and survival in old and very old persons. J Am Geriatr Soc. 2013; 61:512–18. https://doi.org/10.1111/jgs.12158 [PubMed]
- 59. Zhi X, Joas E, Waern M, Östling S, Börjesson-Hanson A, Skoog I. Prevalence of cardiovascular disorders and risk factors in two 75-year-old birth cohorts examined in 1976-1977 and 2005-2006. Aging Clin Exp Res. 2013; 25:377–83. https://doi.org/10.1007/s40520-013-0058-1 [PubMed]
- 60. Chételat G, La Joie R, Villain N, Perrotin A, de La Sayette V, Eustache F, Vandenberghe R. Amyloid imaging in cognitively normal individuals, at-risk populations and preclinical Alzheimer’s disease. Neuroimage Clin. 2013; 2:356–65. https://doi.org/10.1016/j.nicl.2013.02.006 [PubMed]
- 61. Liu L, Zhang Y, Wu W, Cheng M, Li Y, Cheng R. Prevalence and correlates of dental caries in an elderly population in northeast China. PLoS One. 2013; 8:e78723. https://doi.org/10.1371/journal.pone.0078723 [PubMed]
- 62. Msaouel P, Lam AP, Gundabolu K, Chrysofakis G, Yu Y, Mantzaris I, Friedman E, Verma A. Abnormal platelet count is an independent predictor of mortality in the elderly and is influenced by ethnicity. Haematologica. 2014; 99:930–36. https://doi.org/10.3324/haematol.2013.101949 [PubMed]
- 63. Bach V, Schruckmayer G, Sam I, Kemmler G, Stauder R. Prevalence and possible causes of anemia in the elderly: a cross-sectional analysis of a large European university hospital cohort. Clin Interv Aging. 2014; 9:1187–96. https://doi.org/10.2147/CIA.S61125 [PubMed]
- 64. O’Hartaigh B, Pahor M, Buford TW, Dodson JA, Forman DE, Gill TM, and LIFE Study Group. Physical activity and resting pulse rate in older adults: findings from a randomized controlled trial. Am Heart J. 2014; 168:597–604. https://doi.org/10.1016/j.ahj.2014.07.024 [PubMed]
- 65. Virgini VS, Rodondi N, Cawthon PM, Harrison SL, Hoffman AR, Orwoll ES, Ensrud KE, Bauer DC, and Osteoporotic Fractures in Men MrOS Research Group. Subclinical Thyroid Dysfunction and Frailty Among Older Men. J Clin Endocrinol Metab. 2015; 100:4524–32. https://doi.org/10.1210/jc.2015-3191 [PubMed]
- 66. Zhu QO, Tan CS, Tan HL, Wong RG, Joshi CS, Cuttilan RA, Sng GK, Tan NC. Orthostatic hypotension: prevalence and associated risk factors among the ambulatory elderly in an Asian population. Singapore Med J. 2016; 57:444–51. https://doi.org/10.11622/smedj.2016135 [PubMed]
- 67. Hart J, Woodruff M, Joy E, Dalto J, Snow G, Srivastava R, Isaacson B, Allen T. Association of Age, Systolic Blood Pressure, and Heart Rate with Adult Morbidity and Mortality after Urgent Care Visits. West J Emerg Med. 2016; 17:591–99. https://doi.org/10.5811/westjem.2016.6.30353 [PubMed]
- 68. Wang YT, Tao J, Maimaiti A, Adi D, Yang YN, Li XM, Ma X, Liu F, Chen BD, Ma YT. Prevalence of valvular heart diseases and associated risk factors in Han, Uygur and Kazak population in Xinjiang, China. PLoS One. 2017; 12:e0174490. https://doi.org/10.1371/journal.pone.0174490 [PubMed]
- 69. Abujbara M, Batieha A, Khader Y, Jaddou H, El-Khateeb M, Ajlouni K. The Prevalence of Dyslipidemia among Jordanians. J Lipids. 2018; 2018:6298739. https://doi.org/10.1155/2018/6298739 [PubMed]
- 70. Zhang L, Li JL, Zhang LL, Guo LL, Li H, Li D. Association and Interaction Analysis of Body Mass Index and Triglycerides Level with Blood Pressure in Elderly Individuals in China. BioMed Res Int. 2018; 2018:8934534. https://doi.org/10.1155/2018/8934534 [PubMed]
- 71. Keijzers G, Bakula D, Scheibye-Knudsen M. Monogenic Diseases of DNA Repair. N Engl J Med. 2017; 377:1868–76. https://doi.org/10.1056/NEJMra1703366 [PubMed]
- 72. National Library of Medicine. The PubMed Baseline Repository http:/ftp.ncbi.nlm.nih.gov/pubmed/baseline.
- 73. Rogers J, Bodenreider O. SNOMED CT: Browsing the browsers. 2008. http://ceur-ws.org/Vol-410/Paper06.pdf.
- 74. Pedregosa F, Varoquaux G, Gramfort A, Michel V, Thirion B, Grisel O, Blondel M, Prettenhofer P, Weiss R, Dubourg V, Vanderplas J, Passos A, Cournapeau D, et al. Scikit-learn: Machine Learning in Python. J Mach Learn Res. 2011; 12:2825–30. http://www.jmlr.org/papers/v12/pedregosa11a.
- 75. van der Maaten L, Hinton G. Visualizing Data using t-SNE. J Mach Learn Res. 2008; 9:2579–605. .
- 76. Kolde R. pheatmap: Pretty Heatmaps. 2019, https://CRAN.R-project.org/package=pheatmap.
- 77. Suzuki R, Shimodaira H. Pvclust: an R package for assessing the uncertainty in hierarchical clustering. Bioinformatics. 2006; 22:1540–42. https://doi.org/10.1093/bioinformatics/btl117 [PubMed]