


Introduction
Liver cancer was the third leading cause of cancer-related mortality worldwide in 2018, and its incidence is rising, particularly in Asia and Africa [1–3]. Hepatocellular carcinoma (HCC) accounts for approximately 90% of all primary liver cancers, and prognoses remain poor for HCC patients because of the high likelihood of metastasis and recurrence [4, 5]. This low long-term survival rate is most likely attributable to the biological behavior of cancer cells [6, 7]. It is therefore important to identify novel biomarkers that are essential for HCC cell proliferation and progression and which might predict prognosis and aid in the selection of more effective targeted therapies.
Heterochromatin protein 1 gamma (HP1γ), encoded by Chromebox protein homolog 3 (CBX3), is a member of the heterochromatin protein 1 family that binds to chromatin and interacts with heterochromatin to silence gene expression [8–11]. CBX3/HP1γ can affect transcriptional activation, alternative RNA splicing, DNA damage responses, transcription elongation, and cell growth and differentiation [12–19]. Recent studies have demonstrated that overexpression of CBX3/HP1γ negatively impacts prognosis by promoting cancer development and growth in osteosarcoma [20], prostate cancer [21–23], colon cancer [24, 25], pancreatic cancer [26, 27], tongue squamous cell carcinoma [28, 29], breast cancer [30], and lung cancer [31–33]. However, CBX3/HP1γ expression and its impact on clinical pathologic parameters have not been studied in HCC patients.
In the present study, we used bioinformatics analysis to examine the expression and prognostic significance of CBX3/HP1γ in patients with different cancers, including liver cancer. We then analyzed the expression of CBX3/HP1γ in HCC tissues using quantitative real-time polymerase chain reaction (qPCR), western blotting, and immunohistochemical (IHC) staining and examined the correlations between CBX3/HP1γ, clinicopathological parameters, and prognosis in HCC patients. In addition, we performed invitro experiments to determine the biological functions of CBX3/HP1γ. Finally, the molecular mechanisms underlying these functions were explored.
Results
Expression and prognostic significance of CBX3/ HP1γ in various cancers
CBX3/HP1γ mRNA expression levels were examined in various cancers using the Oncomine (Figure 1A) and Human Protein Atlas (Figure 1B) databases. Most cancer tissues showed moderate to strong nuclear expression of CBX3/HP1γ. However, most lymphomas, prostate, and renal cancers displayed weak or negative staining. Bioinformatic analysis indicated that upregulated CBX3/HP1γ expression predicts poor prognosis in liver cancer (Figure 1C), breast cancer (Figure 1D), pancreatic cancer (Figure 1E), and renal cancer (Figure 1F) (Kaplan-Meier plot, log-rank test, all P values< 0.001).
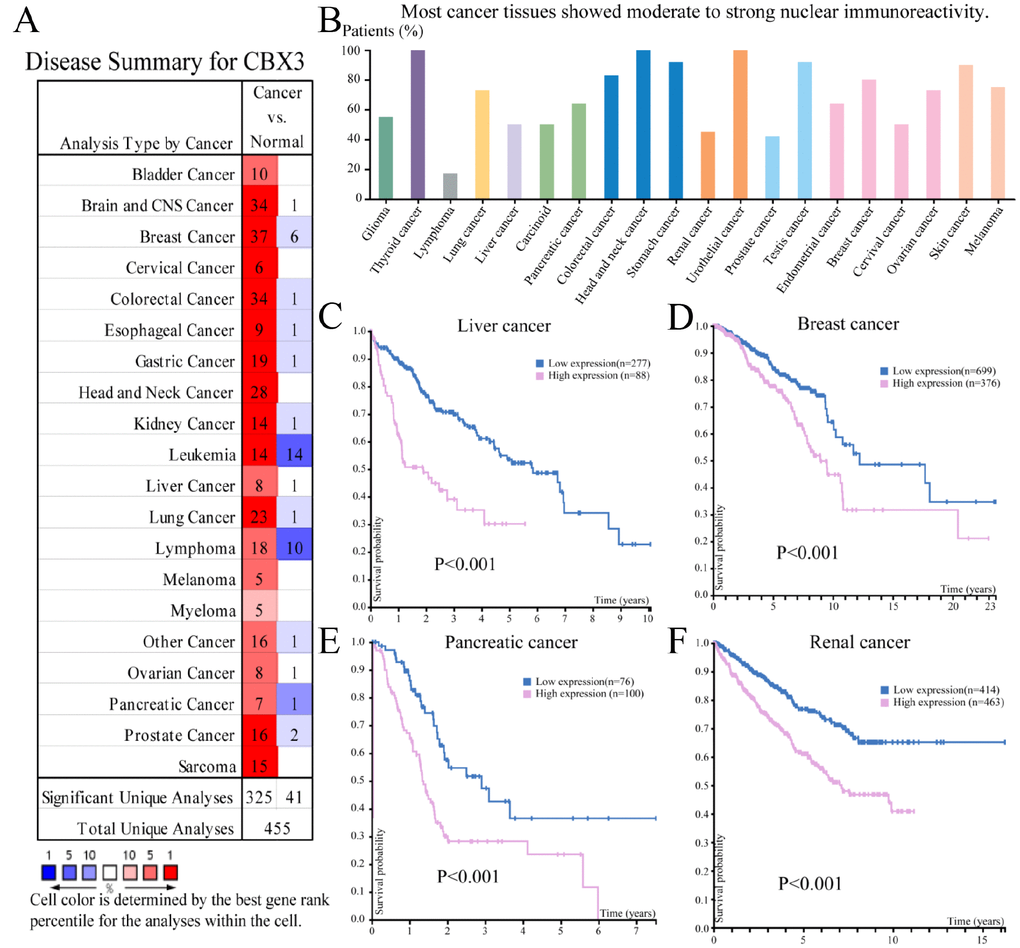
Figure 1. The expression and prognostic significance of CBX3/HP1γ in various cancers. (A) Transcriptional expression of CBX3/HP1γ in 20 different types of cancer (ONCOMINE database). Differences in mRNA expression were compared using Student’s t-tests. The cut-off p value and fold change values were 0.01 and 1.5, respectively, with a gene rank of 10%. (B) CBX3/HP1γ expression in 20 different types of cancer (the Human Protein Atlas database). High CBX3/HP1γ expression was associated with worse prognosis in liver cancer (C), breast cancer (D), pancreatic cancer (E), and renal cancer (F) (Kaplan-Meier Plot, log-rank test, P value < 0.01).
CBX3/HP1γ expression is higher in liver cancer than in normal tissues
CBX3/HP1γ expression was compared in liver cancer and normal liver tissues in the following six datasets from the Oncomine and TCGA databases (Figure 2): Roessler Liver 2, Chen Liver, Roessler Liver, Guichard Liver, TCGA, and Wurmbach Liver. CBX3/HP1γ mRNA expression was elevated in liver cancer tissues compared to normal tissues. In the two Roessler datasets, CBX3/ HP1γ mRNA expression was 1.89-fold (p=7.91E-63) and 1.70-fold (p=2.12E-5) higher in HCC tissues [34]. Similarly, in the Chen Liver [35], Guichard Liver [36], Wurmbach Liver [36], and TCGA datasets, CBX3/HP1γ mRNA expression was increased 1.32- (p=1.85E-8), 1.05- (p=2.36E-9), 1.48- (p=6.23E-8), and 1.09-fold (p=3.93E-8), respectively, in HCC tissues.
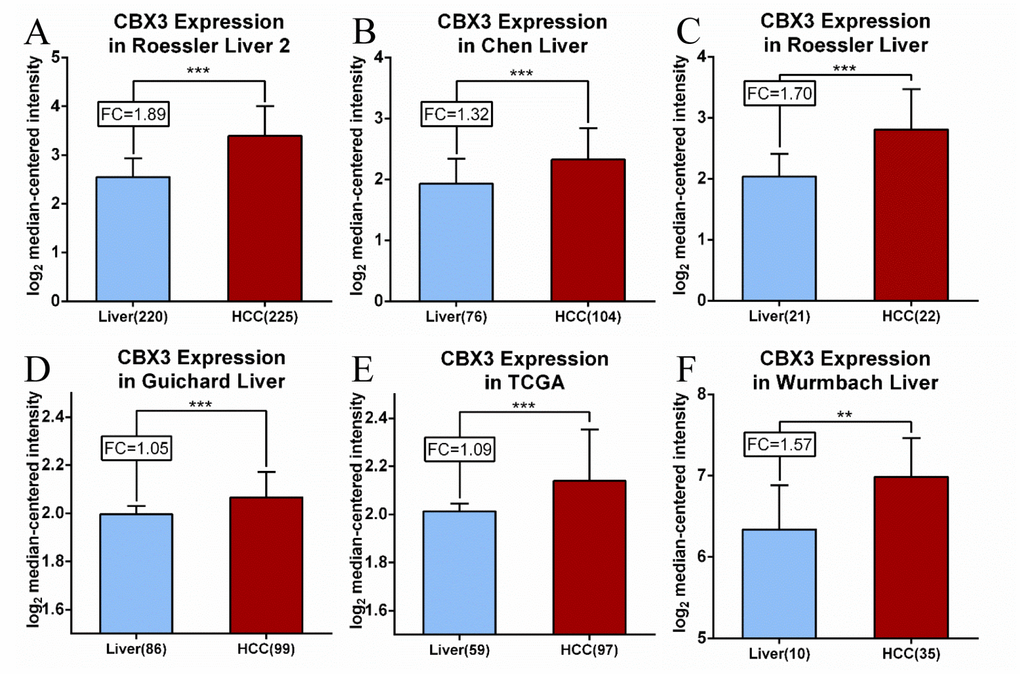
Figure 2. CBX3/HP1γ mRNA expression is elevated in liver cancer compared to normal tissues. Expression levels are shown for the (A) Roessler Liver 2, (B) Chen Liver, (C) Roessler Liver, (D) Guichard Liver, (E) TCGA and (F) Wurmbach Liver datasets. CBX3 mRNA levels are shown as log2 median-centered intensity values. **P<0.01, *** p<0.001. FC, fold change.
Upregulation of CBX3/HP1γ is associated with poor prognosis in liver cancer
CBX3 expression in liver cancer and normal liver tissues was verified using the UALCAN database (Figure 3). The median transcript level in primary tumors was 60.5 per million compared to 29.6 per million in normal tissue (p=1.62e-12). We explored the prognostic significance of CBX3/HP1γ expression level in liver cancer using the Human Protein Atlas database (Figures 1C and 3B), the UALCAN web-portal (Figure 3C, log-rank test p<0.0001), and the Kaplan–Meier plotter survival analysis platforms (Figure 3D, HR=2.37 (1.67-3.36), log-rank test p=6.9E-7). High CBX3/HP1γ expression was associated with unfavorable prognosis in liver cancer.
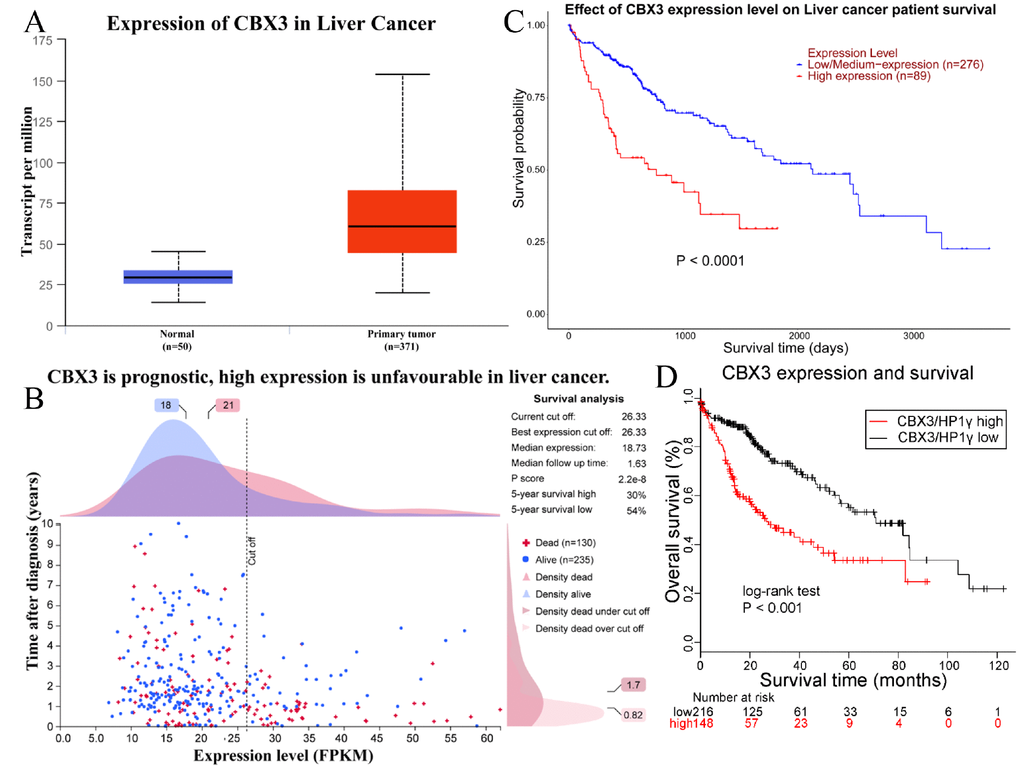
Figure 3. Upregulation of CBX3/HP1γ is associated with poor prognosis in liver cancer. (A) Upregulation of CBX3/HP1γ in liver cancer was confirmed in the UALCAN database (60.5 per million in primary tumor vs. 29.6 per million in normal tissue, P value = 1.62e-12). (B) Prognostic significance of CBX3/HP1γ expression in liver cancer in the Human Protein Atlas database. (C) Survival curve based on CBX3/HP1γ expression from the UALCAN web-portal (log-rank test P value < 0.0001). (D) Survival curve based on CBX3/HP1γ expression level from the Kaplan–Meier plotter survival analysis platforms (HR=2.37 (1.67-3.36), log-rank test P value = 6.9E-7).
Elevated CBX3/HP1γ expression in human HCC tissue specimens based on Western blot and qPCR analyses
Next, we compared CBX3/HP1γ protein and RNA expression levels in three pairs of matched HCC tumor and adjacent non-tumor tissue using Western blots and qPCR. Both CBX3/HP1γ protein and mRNA expression were elevated in HCC tumor tissues compared to matched adjacent nonneoplastic tissues (Figure 4A–4C).
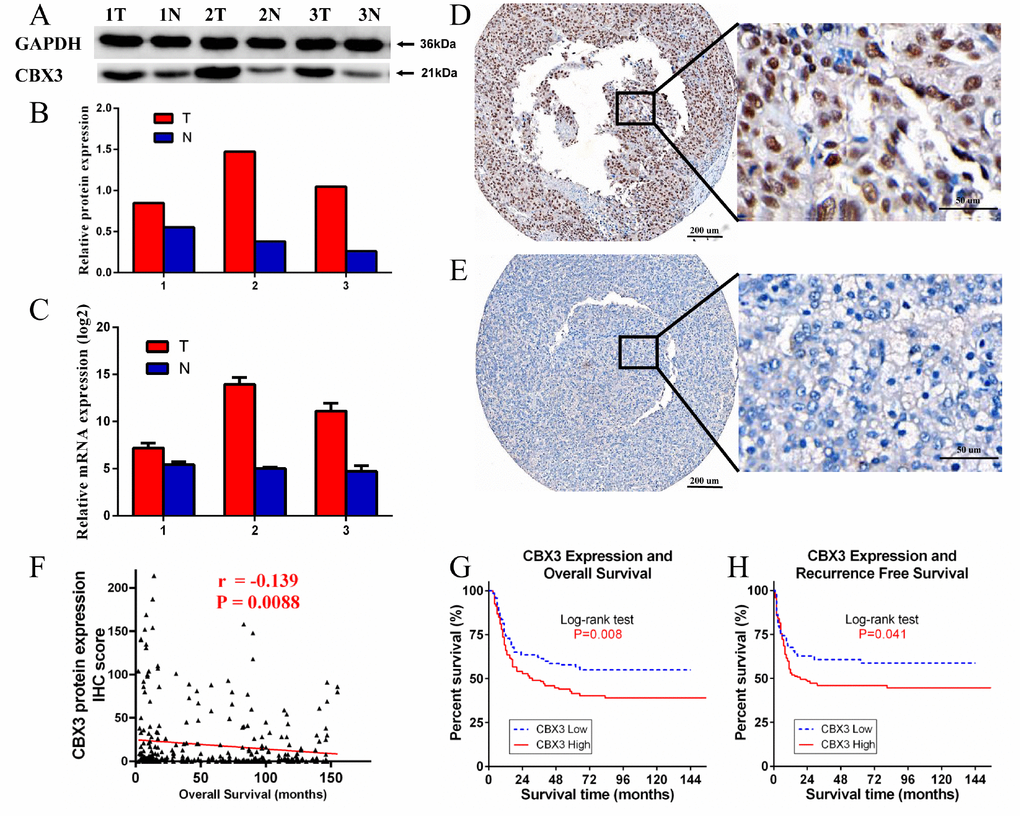
Figure 4. Western blotting (WB), quantitative real-time PCR (qPCR), and immunohistochemistry (IHC) measurements of CBX3/HP1γ in hepatocellular carcinoma (HCC) tissues and HCC tissue microarrays. (A and B) WB results show that CBX3/HP1γ expression was higher in tumor tissues than in adjacent normal tissue. (C) qPCR confirmed that CBX3/HP1γ expression was higher in tumor tissues. (D and E) IHC for CBX3/HP1γ protein in HCC tissue microarrays. (D) Representative image of strong CBX3/HP1γ staining (high expression) in tumor cell nuclei (left ×40, right ×400). (E) Representative image of weak CBX3/HP1γ staining (low expression) in tumor cell nuclei (left ×40, right ×400). (F) CBX3 expression was negatively correlated with overall survival (r = -0.139, P = 0.0088). (G) High CBX3/HP1γ expression was associated with worse overall survival (OS) in HCC patients (Kaplan- Meier analysis, log-rank test, P value = 0.008). (H) High CBX3/HP1γ expression was associated with worse recurrence free survival (RFS) in HCC patients (Kaplan- Meier analysis, log-rank test, P value = 0.041).
IHC staining of CBX3/HP1γ in HCC tissue and its prognostic value in HCC patients
We performed IHC staining of HCC tissue microarrays containing samples from 354 HCC patients to evaluate the relationship between CBX3/HP1γ expression and HCC prognosis. CBX3/HP1γ protein expression was mainly located in the nucleus (Figure 4D). Based on our IHC scoring regime and the ROC curve cutoff value, patients were divided into low CBX3/HP1γ expression (negative or low expression in tumor cells; Figure 4E) and high CBX3/HP1γ expression (high expression in tumor cells; Figure 4D) groups. We then examined the relationship between CBX3/HP1γ expression levels and clinicopathological characteristics (Table 1). Among these, AFP > 20 μg/L, liver cirrhosis, tumor size > 5 cm, multiple tumors, vascular invasion, and tumor recurrence were associated with high CBX3/HP1γ expression (Chi square test P<0.05). In addition, CBX3 IHC scores were negatively correlated with overall survival (OS) times (Figure 4F).
Table 1. Patient characteristics.
| Variable | No. of patients (%) | ||||||||||||||||||||||||||||||||||||||||||||||||||||||||||||||||||||||||||||||||||||||||||||||||||
| No. of patients | 354(100) | ||||||||||||||||||||||||||||||||||||||||||||||||||||||||||||||||||||||||||||||||||||||||||||||||||
| Age:median [range], y | 48.9±11.1 | ||||||||||||||||||||||||||||||||||||||||||||||||||||||||||||||||||||||||||||||||||||||||||||||||||
| Gender | |||||||||||||||||||||||||||||||||||||||||||||||||||||||||||||||||||||||||||||||||||||||||||||||||||
| Female | 34(9.60) | ||||||||||||||||||||||||||||||||||||||||||||||||||||||||||||||||||||||||||||||||||||||||||||||||||
| Male | 320(90.4) | ||||||||||||||||||||||||||||||||||||||||||||||||||||||||||||||||||||||||||||||||||||||||||||||||||
| HBsAg | |||||||||||||||||||||||||||||||||||||||||||||||||||||||||||||||||||||||||||||||||||||||||||||||||||
| Negative | 38(11.5) | ||||||||||||||||||||||||||||||||||||||||||||||||||||||||||||||||||||||||||||||||||||||||||||||||||
| Positive | 292(88.5) | ||||||||||||||||||||||||||||||||||||||||||||||||||||||||||||||||||||||||||||||||||||||||||||||||||
| AFP: Median [range], ug/l | 13759.1±33680.6 | ||||||||||||||||||||||||||||||||||||||||||||||||||||||||||||||||||||||||||||||||||||||||||||||||||
| GGT: Median [range], U/l | 84.9±70.3 | ||||||||||||||||||||||||||||||||||||||||||||||||||||||||||||||||||||||||||||||||||||||||||||||||||
| Liver cirrhosis | |||||||||||||||||||||||||||||||||||||||||||||||||||||||||||||||||||||||||||||||||||||||||||||||||||
| No | 160(47.6) | ||||||||||||||||||||||||||||||||||||||||||||||||||||||||||||||||||||||||||||||||||||||||||||||||||
| Yes | 176(52.4) | ||||||||||||||||||||||||||||||||||||||||||||||||||||||||||||||||||||||||||||||||||||||||||||||||||
| Tumor size: Median [range], cm | 6.51±3.34 | ||||||||||||||||||||||||||||||||||||||||||||||||||||||||||||||||||||||||||||||||||||||||||||||||||
| Tumor number | |||||||||||||||||||||||||||||||||||||||||||||||||||||||||||||||||||||||||||||||||||||||||||||||||||
| Solitary | 266(75.1) | ||||||||||||||||||||||||||||||||||||||||||||||||||||||||||||||||||||||||||||||||||||||||||||||||||
| Multiple | 88(24.9) | ||||||||||||||||||||||||||||||||||||||||||||||||||||||||||||||||||||||||||||||||||||||||||||||||||
| Vascular invasion | |||||||||||||||||||||||||||||||||||||||||||||||||||||||||||||||||||||||||||||||||||||||||||||||||||
| No | 272(81.0) | ||||||||||||||||||||||||||||||||||||||||||||||||||||||||||||||||||||||||||||||||||||||||||||||||||
| Yes | 64(19.4) | ||||||||||||||||||||||||||||||||||||||||||||||||||||||||||||||||||||||||||||||||||||||||||||||||||
| Tumor capsule | |||||||||||||||||||||||||||||||||||||||||||||||||||||||||||||||||||||||||||||||||||||||||||||||||||
| No/incomplete | 226(67.7) | ||||||||||||||||||||||||||||||||||||||||||||||||||||||||||||||||||||||||||||||||||||||||||||||||||
| Complete | 108(32.3) | ||||||||||||||||||||||||||||||||||||||||||||||||||||||||||||||||||||||||||||||||||||||||||||||||||
| Differentiation grade# | |||||||||||||||||||||||||||||||||||||||||||||||||||||||||||||||||||||||||||||||||||||||||||||||||||
| I + II | 36(10.9) | ||||||||||||||||||||||||||||||||||||||||||||||||||||||||||||||||||||||||||||||||||||||||||||||||||
| III + IV | 294(89.1) | ||||||||||||||||||||||||||||||||||||||||||||||||||||||||||||||||||||||||||||||||||||||||||||||||||
| Child-Pugh class | |||||||||||||||||||||||||||||||||||||||||||||||||||||||||||||||||||||||||||||||||||||||||||||||||||
| A | 334(100) | ||||||||||||||||||||||||||||||||||||||||||||||||||||||||||||||||||||||||||||||||||||||||||||||||||
| B | 0(0) | ||||||||||||||||||||||||||||||||||||||||||||||||||||||||||||||||||||||||||||||||||||||||||||||||||
| TNM stage | |||||||||||||||||||||||||||||||||||||||||||||||||||||||||||||||||||||||||||||||||||||||||||||||||||
| I | 114(33.7) | ||||||||||||||||||||||||||||||||||||||||||||||||||||||||||||||||||||||||||||||||||||||||||||||||||
| II–IV | 224(66.3) | ||||||||||||||||||||||||||||||||||||||||||||||||||||||||||||||||||||||||||||||||||||||||||||||||||
| BCLC stage | |||||||||||||||||||||||||||||||||||||||||||||||||||||||||||||||||||||||||||||||||||||||||||||||||||
| 0–A | 288(86.2) | ||||||||||||||||||||||||||||||||||||||||||||||||||||||||||||||||||||||||||||||||||||||||||||||||||
| B–C | 46(13.8) | ||||||||||||||||||||||||||||||||||||||||||||||||||||||||||||||||||||||||||||||||||||||||||||||||||
| Recurrence | |||||||||||||||||||||||||||||||||||||||||||||||||||||||||||||||||||||||||||||||||||||||||||||||||||
| No | 158(51.8) | ||||||||||||||||||||||||||||||||||||||||||||||||||||||||||||||||||||||||||||||||||||||||||||||||||
| Yes | 147(48.2) | ||||||||||||||||||||||||||||||||||||||||||||||||||||||||||||||||||||||||||||||||||||||||||||||||||
| CBX3/HP1γexpression | |||||||||||||||||||||||||||||||||||||||||||||||||||||||||||||||||||||||||||||||||||||||||||||||||||
| Low | 158(44.6) | ||||||||||||||||||||||||||||||||||||||||||||||||||||||||||||||||||||||||||||||||||||||||||||||||||
| High | 196(55.4) | ||||||||||||||||||||||||||||||||||||||||||||||||||||||||||||||||||||||||||||||||||||||||||||||||||
| Values are expressed as the mean ± SD or no. (%), unless otherwise indicated; Abbreviations: HBsAg, hepatitis B surface antigen; AFP, alpha-fetoprotein; GGT, gamma-glutamyltransferase. #, According to the Edmondson and Steiner grading system | |||||||||||||||||||||||||||||||||||||||||||||||||||||||||||||||||||||||||||||||||||||||||||||||||||
To confirm the correlation between CBX3/HP1γ expression levels in tumor cells and HCC prognosis, we compared OS and recurrence-free survival (RFS) between the high and low CBX3/HP1γ expression groups. RFS was defined as the time from surgery to first recurrence of HCC or death without evidence of disease. Kaplan-Meier survival analysis revealed that patients in the high expression group had poorer OS and RFS times than those in the low expression group (Figure 4G and 4H).
Univariate and multivariate survival analyses were conducted to determine whether high CBX3/HP1γ expression in tumor cells was an independent prognostic factor for HCC. Univariate survival analysis revealed that CBX3/HP1γ expression, AFP, GGT, liver cirrhosis, tumor size, tumor number, vascular invasion, and tumor capsule were significantly associated with OS. Meanwhile, GGT, liver cirrhosis, tumor size, tumor number, vascular invasion, differentiation grade, and tumor capsule were significantly associated with RFS. Multivariate survival analysis was also performed to exclude confounding factors. Hazard ratios for OS and RFS are shown in Table 2. CBX3/HP1γ expression level (HR=1.375; 95% CI 1.080–1.928; P=0.045), liver cirrhosis (HR=1.537; 95% CI 1.065–2.218; P=0.022), tumor size (HR=2.214; 95% CI 1.419–3.455; P < 0.001), tumor number (HR=3.066; 95% CI 2.116–4.441; P < 0.001), and vascular invasion (HR=2.499; 95% CI 1.720–3.633; P < 0.001) were independent prognostic factors for OS in HCC patients. In addition, liver cirrhosis (HR=1.582; 95% CI 1.112–2.250; P=0.011), tumor size (HR=2.255; 95% CI 1.461–3.482; P < 0.001), tumor number (HR=2.952; 95% CI 2.038–4.276; P < 0.001), and tumor differentiation grade (HR=3.301; 95% CI 1.535–7.102; P=0.002) were independent prognostic factors for RFS in HCC patients in this Cox regression model (Table 3).
Table 2. Patient baseline and correlation between CBX3/HP1γ expression and clinicopathologic characteristics in hepatocellular carcinoma (HCC).
| Clinicopathological variable | No. of patients | CBX3/HP1γ expression levels | P value | ||||||||||||||||||||||||||||||||||||||||||||||||||||||||||||||||||||||||||||||||||||||||||||||||
| Low expression(%) | High expression(%) | ||||||||||||||||||||||||||||||||||||||||||||||||||||||||||||||||||||||||||||||||||||||||||||||||||
| Age(years) | 0.688 | ||||||||||||||||||||||||||||||||||||||||||||||||||||||||||||||||||||||||||||||||||||||||||||||||||
| ≤50 | 184 | 84(45.7) | 100(54.3) | ||||||||||||||||||||||||||||||||||||||||||||||||||||||||||||||||||||||||||||||||||||||||||||||||
| >50 | 170 | 74(43.5) | 96(56.5) | ||||||||||||||||||||||||||||||||||||||||||||||||||||||||||||||||||||||||||||||||||||||||||||||||
| Gender | 0.670 | ||||||||||||||||||||||||||||||||||||||||||||||||||||||||||||||||||||||||||||||||||||||||||||||||||
| Female | 34 | 14(41.2) | 20(58.8) | ||||||||||||||||||||||||||||||||||||||||||||||||||||||||||||||||||||||||||||||||||||||||||||||||
| Male | 320 | 144(45.0) | 176(55.0) | ||||||||||||||||||||||||||||||||||||||||||||||||||||||||||||||||||||||||||||||||||||||||||||||||
| HBsAg | 0.718 | ||||||||||||||||||||||||||||||||||||||||||||||||||||||||||||||||||||||||||||||||||||||||||||||||||
| Negative | 38 | 16(42.1) | 22(57.9) | ||||||||||||||||||||||||||||||||||||||||||||||||||||||||||||||||||||||||||||||||||||||||||||||||
| Positive | 292 | 132(45.2) | 160(54.8) | ||||||||||||||||||||||||||||||||||||||||||||||||||||||||||||||||||||||||||||||||||||||||||||||||
| AFP(ug/l) | 0.021 | ||||||||||||||||||||||||||||||||||||||||||||||||||||||||||||||||||||||||||||||||||||||||||||||||||
| ≤20 | 108 | 39(36.1) | 69(63.9) | ||||||||||||||||||||||||||||||||||||||||||||||||||||||||||||||||||||||||||||||||||||||||||||||||
| >20 | 226 | 112(49.6) | 114(50.4) | ||||||||||||||||||||||||||||||||||||||||||||||||||||||||||||||||||||||||||||||||||||||||||||||||
| GGT (U/l) | 0.421 | ||||||||||||||||||||||||||||||||||||||||||||||||||||||||||||||||||||||||||||||||||||||||||||||||||
| ≤50 | 130 | 62(47.7) | 68(52.3) | ||||||||||||||||||||||||||||||||||||||||||||||||||||||||||||||||||||||||||||||||||||||||||||||||
| >50 | 206 | 89(43.2) | 117(56.8) | ||||||||||||||||||||||||||||||||||||||||||||||||||||||||||||||||||||||||||||||||||||||||||||||||
| Liver cirrhosis | 0.008 | ||||||||||||||||||||||||||||||||||||||||||||||||||||||||||||||||||||||||||||||||||||||||||||||||||
| No | 160 | 84(52.5) | 76(47.5) | ||||||||||||||||||||||||||||||||||||||||||||||||||||||||||||||||||||||||||||||||||||||||||||||||
| Yes | 176 | 67(38.1) | 109(61.9) | ||||||||||||||||||||||||||||||||||||||||||||||||||||||||||||||||||||||||||||||||||||||||||||||||
| Tumor size(cm) | 0.040 | ||||||||||||||||||||||||||||||||||||||||||||||||||||||||||||||||||||||||||||||||||||||||||||||||||
| ≤5 | 131 | 68(51.9) | 63(48.1) | ||||||||||||||||||||||||||||||||||||||||||||||||||||||||||||||||||||||||||||||||||||||||||||||||
| >5 | 205 | 86(40.5) | 122(59.5) | ||||||||||||||||||||||||||||||||||||||||||||||||||||||||||||||||||||||||||||||||||||||||||||||||
| Tumor number | 0.041 | ||||||||||||||||||||||||||||||||||||||||||||||||||||||||||||||||||||||||||||||||||||||||||||||||||
| Solitary | 266 | 127(47.7) | 139(52.3) | ||||||||||||||||||||||||||||||||||||||||||||||||||||||||||||||||||||||||||||||||||||||||||||||||
| Multiple | 88 | 31(35.2) | 57(64.8) | ||||||||||||||||||||||||||||||||||||||||||||||||||||||||||||||||||||||||||||||||||||||||||||||||
| Vascular invasion | 0.046 | ||||||||||||||||||||||||||||||||||||||||||||||||||||||||||||||||||||||||||||||||||||||||||||||||||
| No | 272 | 131(48.2) | 141(51.8) | ||||||||||||||||||||||||||||||||||||||||||||||||||||||||||||||||||||||||||||||||||||||||||||||||
| Yes | 64 | 22(34.4) | 42(65.6) | ||||||||||||||||||||||||||||||||||||||||||||||||||||||||||||||||||||||||||||||||||||||||||||||||
| Tumor capsule | 0.369 | ||||||||||||||||||||||||||||||||||||||||||||||||||||||||||||||||||||||||||||||||||||||||||||||||||
| No/incomplete | 226 | 97(42.9) | 129(57.1) | ||||||||||||||||||||||||||||||||||||||||||||||||||||||||||||||||||||||||||||||||||||||||||||||||
| Complete | 108 | 52(48.1) | 56(51.9) | ||||||||||||||||||||||||||||||||||||||||||||||||||||||||||||||||||||||||||||||||||||||||||||||||
| Differentiation grade# | 0.742 | ||||||||||||||||||||||||||||||||||||||||||||||||||||||||||||||||||||||||||||||||||||||||||||||||||
| I + II | 36 | 15(41.7) | 21(58.3) | ||||||||||||||||||||||||||||||||||||||||||||||||||||||||||||||||||||||||||||||||||||||||||||||||
| III + IV | 294 | 131(44.6) | 163(55.4) | ||||||||||||||||||||||||||||||||||||||||||||||||||||||||||||||||||||||||||||||||||||||||||||||||
| TNM stage | 0.580 | ||||||||||||||||||||||||||||||||||||||||||||||||||||||||||||||||||||||||||||||||||||||||||||||||||
| I | 114 | 54(47.4) | 60(52.6) | ||||||||||||||||||||||||||||||||||||||||||||||||||||||||||||||||||||||||||||||||||||||||||||||||
| II–IV | 224 | 99(44.2) | 125(55.8) | ||||||||||||||||||||||||||||||||||||||||||||||||||||||||||||||||||||||||||||||||||||||||||||||||
| BCLC stage | 0.097 | ||||||||||||||||||||||||||||||||||||||||||||||||||||||||||||||||||||||||||||||||||||||||||||||||||
| 0–A | 288 | 125(43.4) | 163(56.6) | ||||||||||||||||||||||||||||||||||||||||||||||||||||||||||||||||||||||||||||||||||||||||||||||||
| B–C | 46 | 26(56.5) | 20(43.5) | ||||||||||||||||||||||||||||||||||||||||||||||||||||||||||||||||||||||||||||||||||||||||||||||||
| Recurrence | 0.041 | ||||||||||||||||||||||||||||||||||||||||||||||||||||||||||||||||||||||||||||||||||||||||||||||||||
| No | 158 | 65(41.4) | 93(58.9) | ||||||||||||||||||||||||||||||||||||||||||||||||||||||||||||||||||||||||||||||||||||||||||||||||
| Yes | 147 | 44(29.9) | 103(70.1) | ||||||||||||||||||||||||||||||||||||||||||||||||||||||||||||||||||||||||||||||||||||||||||||||||
| Abbreviations: HBsAg, hepatitis B surface antigen; AFP, alpha-fetoprotein; GGT, gamma-glutamyltransferase. #, According to the Edmondson and Steiner grading system. Chi square test P<0.05. | |||||||||||||||||||||||||||||||||||||||||||||||||||||||||||||||||||||||||||||||||||||||||||||||||||
Table 3. Univariate and multivariate analysis of the association of CBX3/HP1γ with survival and recurrence in patients with hepatocellular carcinoma.
| Variables* | OS | RFS | |||||||||||||||||||||||||||||||||||||||||||||||||||||||||||||||||||||||||||||||||||||||||||||||||
| Univariate | Multivariable Analysis | Univariate | Multivariable Analysis | ||||||||||||||||||||||||||||||||||||||||||||||||||||||||||||||||||||||||||||||||||||||||||||||||
| P value | P value | HR | 95% CI | P value | P value | HR | 95% CI | ||||||||||||||||||||||||||||||||||||||||||||||||||||||||||||||||||||||||||||||||||||||||||||
| Age (y) (≤ 50 vs. > 50) | 0.739 | 0.549 | |||||||||||||||||||||||||||||||||||||||||||||||||||||||||||||||||||||||||||||||||||||||||||||||||
| Gender (Female vs. Male) | 0.553 | 0.254 | |||||||||||||||||||||||||||||||||||||||||||||||||||||||||||||||||||||||||||||||||||||||||||||||||
| HBsAg (Negative vs. Positive) | 0.500 | 0.588 | |||||||||||||||||||||||||||||||||||||||||||||||||||||||||||||||||||||||||||||||||||||||||||||||||
| AFP (ng/ml) (< 400 vs. ≥ 400) | 0.049 | 0.057 | |||||||||||||||||||||||||||||||||||||||||||||||||||||||||||||||||||||||||||||||||||||||||||||||||
| GGT (U/l) (≤ 50 vs. > 50) | 0.000 | 0.001 | |||||||||||||||||||||||||||||||||||||||||||||||||||||||||||||||||||||||||||||||||||||||||||||||||
| Liver cirrhosis (No vs. Yes) | 0.000 | 0.022 | 1.537 | 1.065-2.218 | 0.004 | 0.011 | 1.582 | 1.112-2.250 | |||||||||||||||||||||||||||||||||||||||||||||||||||||||||||||||||||||||||||||||||||||||||||
| Tumor size (cm) (≤ 5 vs. > 5) | 0.000 | 0.000 | 2.214 | 1.419-3.455 | 0.000 | 0.000 | 2.255 | 1.461-3.482 | |||||||||||||||||||||||||||||||||||||||||||||||||||||||||||||||||||||||||||||||||||||||||||
| Tumor number (Solitary vs. Multiple) | 0.000 | 0.000 | 3.066 | 2.116-4.441 | 0.000 | 0.000 | 2.952 | 2.038-4.276 | |||||||||||||||||||||||||||||||||||||||||||||||||||||||||||||||||||||||||||||||||||||||||||
| Vascular invasion (No vs. Yes) | 0.000 | 0.000 | 2.499 | 1.720-3.633 | 0.000 | ||||||||||||||||||||||||||||||||||||||||||||||||||||||||||||||||||||||||||||||||||||||||||||||
| Tumor capsule (No/incomplete vs. complete) | 0.001 | 0.003 | |||||||||||||||||||||||||||||||||||||||||||||||||||||||||||||||||||||||||||||||||||||||||||||||||
| Differentiation grade# (I + II vs. III + IV) | 0.673 | 0.002 | 0.002 | 3.301 | 1.535-7.102 | ||||||||||||||||||||||||||||||||||||||||||||||||||||||||||||||||||||||||||||||||||||||||||||||
| CBX3/HP1γ expression (Low vs. High) | 0.009 | 0.045 | 1.375 | 1.080-1.928 | 0.047 | ||||||||||||||||||||||||||||||||||||||||||||||||||||||||||||||||||||||||||||||||||||||||||||||
| *TNM stage and BCLC stage was combined with several clinical indexes such as tumor size, number and tumor thrombus; we did not enter the TNM stage and BCLC stage into multiple analysis with these indexes to avoid any bias in analysis. Abbreviations: HBsAg, hepatitis B surface antigen; OS, overall survival; RFS, recurrence free survival; AFP, alpha-fetoprotein; HR, hazard ratio; GGT, gamma-glutamyltransferase; CI, confidence interval. #, According to the Edmondson and Steiner grading system. | |||||||||||||||||||||||||||||||||||||||||||||||||||||||||||||||||||||||||||||||||||||||||||||||||||
Stable overexpression of CBX3/HP1γ promotes growth in HCC cell lines
Because higher CBX3/HP1γ expression was associated with malignant clinicopathological features in HCC patients, we explored the potential biological function of CBX3/HP1γ in HCC tumorigenesis. The HCC cell lines SK-Hep-1 and SMMC-7721 were stably transfected with a CBX3/HP1γ expression plasmid (pEZ-Lv105-CBX3) or a control vector (pEZ-Lv105). Ectopic CBX3/HP1γ messenger RNA and protein expression in transfected cells was confirmed by quantitative real-time PCR and Western blot analyses, respectively (Figure 5A–5C). Functional CCK-8 and colony-forming assays were used to characterize proliferation ability in cells overexpressing CBX3/HP1γ. As shown in Figure 5D and 5E, cells overexpressing CBX3/HP1γ generated significantly more colonies than cells expressing only the vector in both the CCK-8 and colony-forming assays.
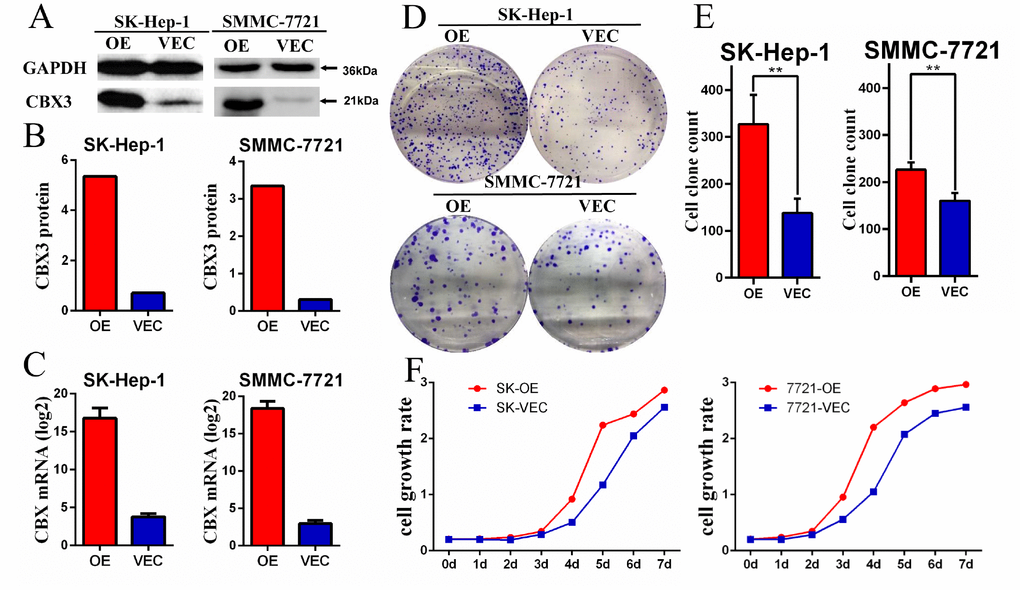
Figure 5. CBX3/HP1γ was stably overexpressed in HCC cell lines and promoted cell proliferation. (A and B) Overexpression of CBX3/HP1γ (OE) in a transfected SK-Hep-1 and SMMC-7721 cell lines compared to cells transfected with the control vector (Vec) was verified by Western blotting. (C) qPCR confirmed overexpression of CBX3/HP1γ mRNA in SK-Hep-1 and SMMC-7721 cell lines. (D and E) Cell colony formation assay results showing that CBX3/HP1γ overexpression promoted cell proliferation in SK-Hep-1 and SMMC-7721 cells (OE) compared to cells transfected with control vector (Vec). (F) CCK8 assay results showing CBX3/HP1γ overexpression accelerated cell growth rates in SK-Hep-1 and SMMC-7721 cells (OE) compared to cells transfected with control vector (Vec).
Molecular mechanisms underlying the effects of CBX3/HP1γ
The GeneMANIA and STRING web portals were used to predict interactions between CBX3/HP1γ and other genes (Figure 6A and 6B). The results showed that CBX3/HP1γ interacts with CBX1 and CBX5, which are members of the heterochromatin protein 1 family. The CircNet database was used to predict upstream circRNAs and microRNAs of CBX3/HP1γ (Figure 6C and 6D). These results indicated that CBX3 expression may be related to circ-CBX3.7 and microRNAs such as miR-30a.
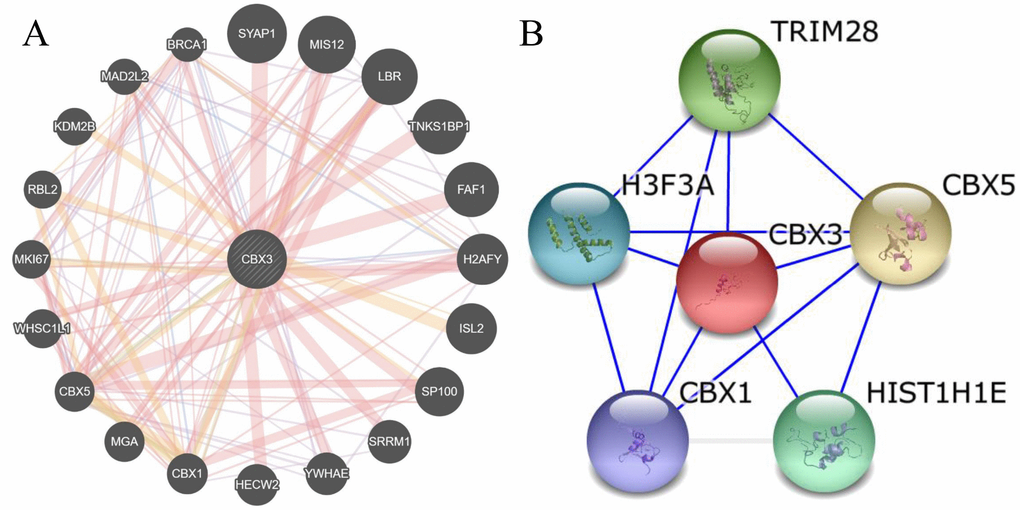
Figure 6. Molecular mechanisms underlying the effects of CBX3/HP1γ. (A and B) Interactions between CBX3/HP1γ and other genes from the web-portals GeneMANIA and STRING.
(C and D) Upstream circRNA and microRNA of CBX3/HP1γ from the CircNet database.
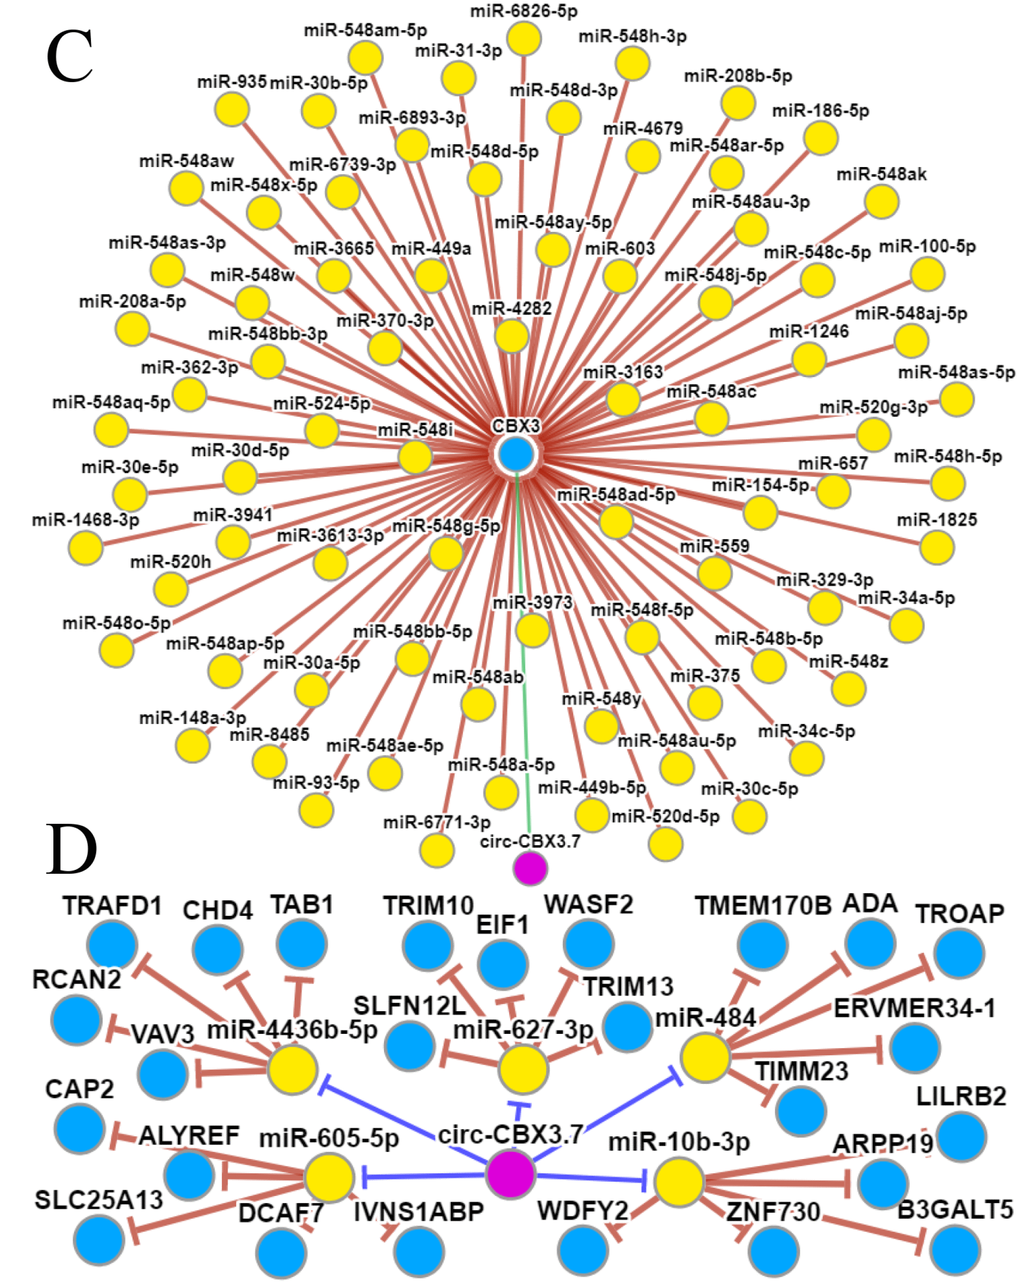
Figure 6. Molecular mechanisms underlying the effects of CBX3/HP1γ. (C and D) Upstream circRNA and microRNA of CBX3/HP1γ from the CircNet database.
Discussion
Because of tumor multiplicity and the high incidence of recurrence and metastasis after resection, long-term survival of HCC patients remains poor [2, 37]. Molecular classification and associated therapies have improved survival rates for some malignancies [38], but accurate prognosis prediction and identification of molecular treatment strategies for HCC patients has been hampered by the molecular complexity of HCC and the lack of standard tumor prediction models [3, 4, 39]. Further investigation of the molecular mechanisms involved in the development of HCC is therefore needed to identify effective prognostic and therapeutic targets.
Members of the heterochromatin protein 1 (HP1) family, also known as the chromatin binding proteins, contain an N-terminal chromodomain and a C-terminal chromoshadow domain [13, 40]. By directly binding to the promoter region of methylated H3K9 (the methyl groups of histone H3 at lysine 9), HP1 proteins regulate heterochromatin, gene expression, and developmental processes [41–43]. Abnormal expression of HP1 genes might contribute to various human diseases and cancer progression [16, 22]. CBX3/HP1γ, which is a paralog of HP1, performs various biological functions and is associated with prognosis in multiple cancers.
In the present study, we explored the expression and prognostic significance of CBX3/HP1γ in cancer patients using the Oncomine, Cancer Genome Atlas (TCGA) and Human Protein Atlas databases, the UALCAN interactive web-portal, and the Kaplan–Meier plotter survival analysis platforms. Although CBX3/HP1γ protein staining was weak in some lymphomas, prostate cancer and renal cancer, CBX3/HP1γ mRNA expression was higher in 20 types of cancer than in normal tissues (p value: 0.01, fold change: 1.5, gene rank: 10%; Figure 1). We also found that high CBX3/HP1γ expression was associated with poor survival in patients with liver, breast, pancreatic, or renal cancer. In order to confirm the expression and function of CBX3/HP1γ in liver cancer, multiple bioinformatics analyses were conducted. The results indicated that CBX3/HP1γ is significantly upregulated in HCC tissues compared to normal tissues in datasets from the Oncomine, TCGA, THPA, and UALCAN databases (Figure 2). This association between high CBX3/HP1γ expression and poorer prognosis in HCC patients was further confirmed using the Kaplan–Meier plotter and the UALCAN interactive web-portal (Figure 3). We then examined CBX3/HP1γ protein and mRNA expression in HCC tissues using qPCR, Western blotting, and IHC staining. CBX3/HP1γ expression as measured in those assays was associated with malignant clinicopathological characteristics, such as AFP > 20 μg/L, liver cirrhosis, tumor size > 5 cm, multiple tumors, vascular invasion, and tumor recurrence. More importantly, we demonstrated that increased CBX3/HP1γ expression in HCC tissues was associated with poorer prognoses and recurrence following curative surgery. Furthermore, univariate and multivariate analyses revealed that high CBX3/HP1γ expression in tumor cells was an independent and significant risk factor for shorter overall survival times after curative surgery.
HCC tumorigenesis is a complicated process affected by tumor multiplicity, chromosomal instability, and gene alterations. Oncogene activation and tumor suppressor inactivation are crucial steps in HCC carcinogenesis and progression. CBX3/HP1γ regulates gene expression via epigenetic silencing, and previous studies have demonstrated that up-regulation of CBX3/HP1γ occurs in a variety of cancers. Zhang etal. [28, 29] showed that CBX3/HP1γ is upregulated in tongue squamous cell carcinoma and negatively impacts prognosis by delaying the G1/S phase via p21 downregulation, which promotes tumor proliferation. Chen etal. [26, 27] found that CBX3/HP1γ promoted cell cycle transition-associated tumor progression by suppressing FBP1 in pancreatic cancer. Recent studies show that CBX3/HP1γ is upregulated in human colorectal cancer and that it promotes cell proliferation by directly regulating CDKN1A via methylation of histone H3K9 on its promoter. Moreover, miR-30a targeted CBX3/HP1γ invitro and invivo to specifically inhibit the growth of colorectal cancer in mouse xenograft models [24, 25]. CBX3/HP1γ is also one of the most frequently over-expressed histone reader proteins in human lung cancer, and high CBX3/HP1γ mRNA levels are associated with poorer prognosis [32, 33, 44]. Alam etal. demonstrated that CBX3/HP1γ promoted proliferation, colony formation, and migration in lung adenocarcinoma (LUAD) cells by directly repressing NCOR2 and ZBTB7A. Invivo depletion of CBX3/HP1γ suppressed K-RasG12D-driven LUAD and increased survival in mice bearing K-RasG12D-induced LUAD [31]. Itsumi [23] and Chang etal. [21] proposed that a CBX3/miR-451a/c-Myc regulatory circuitry exists in prostate cancer and that it plays a crucial role in tumor progression. Notably, Ning etal. found that overexpression of CBX family genes is significantly associated with higher clinical cancer stages and pathological tumor grades as well as reduced overall survival in HCC patients [45]. Similarly, our study showed that CBX3/HP1γ mRNA and protein expression are elevated in HCC tissues, and high CBX3/HP1γ expression was also an independent prognostic factor associated with shorter survival in HCC patients. Moreover, CBX3/HP1γ expression was associated with tumor size, tumor numbers, vascular invasion, and tumor recurrence, indicating that CBX3/HP1γ plays important role in HCC cell proliferation, invasion, and metastasis. We also demonstrated that CBX3/HP1γ overexpression promoted HCC cell proliferation. Furthermore, we explored the molecular mechanisms underlying the effects of CBX3/HP1γ using the GeneMANIA, STRING, and CircNet databases and identified potential interactions between CBX3 and other genes, micro RNAs, and circle RNAs. Overall, our results suggest that CBX3, together with other members of HP1 family (CBX1, CBX5), is regulated by miR-30a and targets downstream genes such as p21, CDK6, and CD44 to inhibit cell cycle and apoptosis, thereby promoting the growth, development, and invasion of HCC.
To the best of our knowledge, this study is the first to explore the prognostic value, cellular functions, and molecular mechanisms of CBX3/HP1γ in HCC. However, the number of patients enrolled in this study was relatively small, and the set of cellular functional assays used was limited. These results should therefore be confirmed in additional patients from different institutions. Additional studies using invitro and invivo assays are also needed to validate the functions and mechanisms of CBX3/HP1γ in HCC.
In summary, our bioinformatics analysis indicates that elevated Cbx3/HP1γ expression is associated with poor survival in various malignancies. Our results further suggest that high CBX3/HP1γ expression in HCC tumor cells is an independent prognostic factor associated with poorer disease outcomes in HCC patients, and that CBX3/ HP1γ plays an important role in HCC tumorigenesis and progression by promoting cell proliferation.
Materials and Methods
Bioinformatics analysis
CBX3/HP1γ mRNA levels were examined in various cancers, including liver cancer, using the ONCOMINE database (http://www.oncomine.org) and The Cancer Genome Atlas database (TCGA, https://cancergenome.nih.gov/), which is a publicly accessible online database. The Human Protein Atlas database (https://proteinatlas.org/), Kaplan–Meier plotter survival analysis platforms (http://kmplot.com/), and UALCAN database (http://ualcan.path.uab.edu/) were employed to examine CBX3/HP1γ expression and survival in different cancers. Potential interactions between CBX3/HP1γ and different genes, microRNAs, and circRNAs were predicted using GeneMANIA (http://genemania.org/), STRING (http://string905.embl.de/), and CircNet (http://syslab5.nchu.edu.tw/CircNet/).
Patients and specimens
HCC tissue microarrays containing 354 samples from patients who underwent hepatic resection for HCC at Sun Yat-sen Cancer Center between 2005 and 2013 were examined. The inclusion criteria for patient enrollment were: an absence of anticancer therapies or distant metastasis prior to the surgery; a lack of concurrent autoimmune disease, human immunodeficiency virus, or syphilis; and the availability of follow-up data. Patients with Child-Pugh scores of B or C were excluded from the study. Histologic tumor differentiation grades were assigned according to the Edmondson-Steiner grading system. The BCLC staging system and the seventh edition of the International Union Against Cancer/American Joint Committee on Cancer TNM staging system were used for staging. The clinicopathological characteristics of the patients are summarized in Table 1. Freshly resected HCC specimens and adjacent non-neoplastic liver tissues were collected from patients who had undergone hepatectomy for curative treatment of HCC at the Sun Yat-sen Cancer Center. None of these patients received any neoadjuvant therapies before surgery, including radiotherapy or chemotherapy. This study was approved by the institutional review boards of the Sun Yat-sen Cancer Center. Written informed consent was obtained from all patients, including for the use of their liver specimens for research.
Immunohistochemistry
HCC tissue microarrays were cut into 3-μm sections for immunohistochemistry. Tissue sections were prepared for antigen retrieval using microwave treatment in citrate buffer (pH 6.0) and then incubated with a rabbit anti-CBX3 antibody (diluted 1:400 in PBS; Catalog number: 11650-2-AP, Wuhan Sanying Biotechnology, Wuhan, China) overnight at 4°C, followed by incubation with a secondary anti-rabbit HRP-conjugated antibody (Envision System, Catalog number: GK500711, Dako Cytomation, Glostrup, Denmark) at a concentration of 1:100 at 37°C for 30 min. Subsequently, the sections were washed with PBS, colorized with a diaminobenzidine (DAB) solution, and counterstained with hematoxylin. To minimize inter-observer variation, IHC staining was evaluated with a computerized image analysis platform that was constructed using the TMAJ Image application (http://tmaj.pathology.jhmi.edu) [7]. The cut-off point for low versus high expression was determined using the Youden index (sensitivity + specificity - 1) according to receiver operation characteristic (ROC) curves [38].
Follow-up
Follow-ups consisted of physical examination, tumor marker measurement, liver biochemistry and function, blood tests, abdominal ultrasonography, and contrast-enhanced CT and were conducted for all patients less than every 1-3 months for the first year after liver operations and every 6 months thereafter for more than 60 months after treatment. The overall survival (OS) time was defined as the interval between surgery and death or between surgery and the last follow-up for surviving patients. The recurrence-free survival time was defined as the interval between surgery and recurrence or between surgery and the last follow-up for patients without recurrence. The median follow-up was 63.5 months (range 2–155 months). Of the 354 patients examined during the follow-up period, 160 patients (45.2 %) died and 157 patients (44.6 %) did not experience tumor recurrence.
Cell lines and culture conditions
The human hepatocellular carcinoma (HCC) cell lines SK-Hep-1 and SMMC-7721 and the human embryonic kidney 293T (HEK 293T) cell line were obtained from the Liver Cancer Institute of Fudan University (Shanghai, China). All cell lines were cultured in high-glucose Dulbecco’s modified Eagle’s medium (DMEM; Gibco, Carlsbad, CA, USA) supplemented with 10% fetal bovine serum (FBS; Gibco). The cells were incubated at 37°C in a humidified incubator supplied with 5% carbon dioxide.
Establishment of CBX3/HP1γ overexpression cells
A lentiviral CBX3/HP1γ overexpression vector was purchased from Hanbio Biotechnology Co., Ltd (Shanghai, China) and transfected into SK-Hep1 cells using Lipofectamine 2000 (Invitrogen) according to the manufacturer’s instructions. Cells transfected with empty vector were used as controls. Puromycin was used to select stable clones.
Western blot analysis
Tissues and cells were lysed on ice in 50 mM Tris (pH 7.5), 150 mM NaCl, and 0.5% NP-40. Protein lysates were separated using 10% sodium dodecyl sulphate-polyacrylamide gel electrophoresis and then transferred to a polyvinylidene fluoride membranes. After the membranes were blocked with 5% bovine serum albumin, they were incubated with primary antibody (CBX3 or GAPDH: Catalog number: 60004-1-Ig, Wuhan Sanying Biotechnology, Wuhan, China) at 4°C overnight. The membranes were then incubated with horseradish peroxidase (HRP)-conjugated secondary antibodies at room temperature for 45 min. Protein signals were detected using enhanced chemiluminescence (Pierce, Rockford, IL, USA). Bands were quantified using ImageJ (Ver. 1.52a; NIH, Bethesda, MD), normalized to GAPDH, and expression ratios were determined.
RNA isolation and quantitative real-time PCR
Total RNA was isolated from the tissue specimens and cell lines using TRIzol Reagent (Invitrogen Life Technologies, Shanghai, China). The isolated RNA (2 μg) was reverse-transcribed to cDNA using a SuperScript® III First-Strand Synthesis System (Invitrogen Life Technologies) according to the manufacturer’s instructions. For the qPCR assay, the cDNA was subjected to PCR amplification using SYBR Green (Toyobo, Kita-ku, Osaka, Japan) and a Roche LightCycler 480 System. GAPDH was used as an internal control. The primers used included the CBX3/HP1γ forward primer (5′-TAGATCGACGTGTA GTGAATGGG-3′), CBX3/HP1γ reverse primer (5′-TGT CTGTGGCACCAATTATTCTT-3′), GAPDH forward primer (5′- GTCTCCTCTGACTTCAACAGCG-3′), and GAPDH reverse primer (5′-ACCACCCTGTTGCTGTA GCCAA-3′).
Invitro cell growth assays
The proliferative activity of cultured cells was determined using Cell Counting Kit-8 (CCK8) assays (Promega, WI, USA); numbers of viable cells were evaluated after 2 h of incubation in medium containing CCK8. The conversion of the tetrazolium salt WST-8 to formazan was measured at 450 nm using a plate reader. For colony formation assays, 1,000 cells were seeded in each well of a 6-well plate and cultured with DMEM (Gibco) supplemented with 10% FBS (Gibco) for 7 d. The colonies were washed twice with phosphate-buffered saline (PBS), fixed in methanol for 15 min, and stained with crystal violet for 15 min at room temperature. After the excess stain was washed out, the number of colonies was counted. Colony formation efficiency was calculated as the ratio of the number of colonies formed to the total number of cells plated.
Statistical analyses
For continuous variables, the data are expressed as the mean ± standard error of the mean. The significance of differences between values was determined using the Student’s t-test. The chi-squared test was used to examine associations between CBX3/HP1γ expression and clinical pathological parameters. Patient survival curves were calculated using the Kaplan-Meier method and analyzed using the log-rank test. Prognostic factors were examined by univariate and multivariate analyses using the Cox proportional hazards model. All differences were deemed significant at P < 0.05. All statistical analyses were performed using SPSS software version 19.0 (SPSS, Chicago, IL).
Author Contributions
Xiaoping Zhong and Huayong Zhang designed the study. The article was written by Xiaoping Zhong and Jiasheng Chen. Xiaoping Zhong and Anna Kan collected the patient samples. Xiaoping Zhong and Wancong Zhang performed the statistical analyses. Professor Shijie Tang and Jianda Zhou are responsible for guidance. All authors read and approved the final manuscript.
Conflicts of Interest
The authors have no conflicts of interest to disclose.
Funding
This study was supported by the National Natural Science Foundation of China (No. 81571920), Natural Science Foundation of Guangdong Province (No. 2015A030313436) and Scientific and Technological Innovation Strategy of Guangdong (No.2018-157-45).
References
- 1. Siegel RL, Miller KD, Jemal A. Cancer statistics, 2019. CA Cancer J Clin. 2019; 69:7–34. https://doi.org/10.3322/caac.21551 [PubMed]
- 2. Bray F, Ferlay J, Soerjomataram I, Siegel RL, Torre LA, Jemal A. Global cancer statistics 2018: GLOBOCAN estimates of incidence and mortality worldwide for 36 cancers in 185 countries. CA Cancer J Clin. 2018; 68:394–424. https://doi.org/10.3322/caac.21492 [PubMed]
- 3. Llovet JM, Montal R, Sia D, Finn RS. Molecular therapies and precision medicine for hepatocellular carcinoma. Nat Rev Clin Oncol. 2018; 15:599–616. https://doi.org/10.1038/s41571-018-0073-4 [PubMed]
- 4. Llovet JM, Zucman-Rossi J, Pikarsky E, Sangro B, Schwartz M, Sherman M, Gores G. Hepatocellular carcinoma. Nat Rev Dis Primers. 2016; 2:16018. https://doi.org/10.1038/nrdp.2016.18 [PubMed]
- 5. Wang JH, Zhong XP, Zhang YF, Wu XL, Li SH, Jian PE, Ling YH, Shi M, Chen MS, Wei W, Guo RP. Cezanne predicts progression and adjuvant TACE response in hepatocellular carcinoma. Cell Death Dis. 2017; 8:e3043. https://doi.org/10.1038/cddis.2017.428 [PubMed]
- 6. Hoshida Y, Villanueva A, Kobayashi M, Peix J, Chiang DY, Camargo A, Gupta S, Moore J, Wrobel MJ, Lerner J, Reich M, Chan JA, Glickman JN, et al. Gene expression in fixed tissues and outcome in hepatocellular carcinoma. N Engl J Med. 2008; 359:1995–2004. https://doi.org/10.1056/NEJMoa0804525 [PubMed]
- 7. OuYang HY, Xu J, Luo J, Zou RH, Chen K, Le Y, Zhang YF, Wei W, Guo RP, Shi M. MEP1A contributes to tumor progression and predicts poor clinical outcome in human hepatocellular carcinoma. Hepatology. 2016; 63:1227–39. https://doi.org/10.1002/hep.28397 [PubMed]
- 8. Mishima Y, Jayasinghe CD, Lu K, Otani J, Shirakawa M, Kawakami T, Kimura H, Hojo H, Carlton P, Tajima S, Suetake I. Nucleosome compaction facilitates HP1γ binding to methylated H3K9. Nucleic Acids Res. 2015; 43:10200–12. https://doi.org/10.1093/nar/gkv841 [PubMed]
- 9. Singh PB. HP1 proteins—what is the essential interaction? Genetika. 2010; 46:1424–29. https://doi.org/10.1134/s1022795410100297 [PubMed]
- 10. Jones DO, Mattei MG, Horsley D, Cowell IG, Singh PB. The gene and pseudogenes of Cbx3/mHP1 gamma. DNA Seq. 2001; 12:147–160. https://doi.org/10.3109/10425170109080769 [PubMed]
- 11. Minc E, Courvalin JC, Buendia B. HP1gamma associates with euchromatin and heterochromatin in mammalian nuclei and chromosomes. Cytogenet Cell Genet. 2000; 90:279–84. https://doi.org/10.1159/000056789 [PubMed]
- 12. Huang C, Su T, Xue Y, Cheng C, Lay FD, McKee RA, Li M, Vashisht A, Wohlschlegel J, Novitch BG, Plath K, Kurdistani SK, Carey M. Cbx3 maintains lineage specificity during neural differentiation. Genes Dev. 2017; 31:241–46. https://doi.org/10.1101/gad.292169.116 [PubMed]
- 13. Bot C, Pfeiffer A, Giordano F, Manjeera DE, Dantuma NP, Ström L. Independent mechanisms recruit the cohesin loader protein NIPBL to sites of DNA damage. J Cell Sci. 2017; 130:1134–46. https://doi.org/10.1242/jcs.197236 [PubMed]
- 14. Velez G, Lin M, Christensen T, Faubion WA, Lomberk G, Urrutia R. Evidence supporting a critical contribution of intrinsically disordered regions to the biochemical behavior of full-length human HP1γ. J Mol Model. 2016; 22:12. https://doi.org/10.1007/s00894-015-2874-z [PubMed]
- 15. Morikawa K, Ikeda N, Hisatome I, Shirayoshi Y. Heterochromatin protein 1γ overexpression in P19 embryonal carcinoma cells elicits spontaneous differentiation into the three germ layers. Biochem Biophys Res Commun. 2013; 431:225–31. https://doi.org/10.1016/j.bbrc.2012.12.128 [PubMed]
- 16. Thorne JL, Ouboussad L, Lefevre PF. Heterochromatin protein 1 gamma and IκB kinase alpha interdependence during tumour necrosis factor gene transcription elongation in activated macrophages. Nucleic Acids Res. 2012; 40:7676–89. https://doi.org/10.1093/nar/gks509 [PubMed]
- 17. Smallwood A, Hon GC, Jin F, Henry RE, Espinosa JM, Ren B. CBX3 regulates efficient RNA processing genome-wide. Genome Res. 2012; 22:1426–36. https://doi.org/10.1101/gr.124818.111 [PubMed]
- 18. Ruan J, Ouyang H, Amaya MF, Ravichandran M, Loppnau P, Min J, Zang J. Structural basis of the chromodomain of Cbx3 bound to methylated peptides from histone h1 and G9a. PLoS One. 2012; 7:e35376. https://doi.org/10.1371/journal.pone.0035376 [PubMed]
- 19. Abe K, Naruse C, Kato T, Nishiuchi T, Saitou M, Asano M. Loss of heterochromatin protein 1 gamma reduces the number of primordial germ cells via impaired cell cycle progression in mice. Biol Reprod. 2011; 85:1013–24. https://doi.org/10.1095/biolreprod.111.091512 [PubMed]
- 20. Saini V, Hose CD, Monks A, Nagashima K, Han B, Newton DL, Millione A, Shah J, Hollingshead MG, Hite KM, Burkett MW, Delosh RM, Silvers TE, et al. Identification of CBX3 and ABCA5 as putative biomarkers for tumor stem cells in osteosarcoma. PLoS One. 2012; 7:e41401. https://doi.org/10.1371/journal.pone.0041401 [PubMed]
- 21. Chang C, Liu J, He W, Qu M, Huang X, Deng Y, Shen L, Zhao X, Guo H, Jiang J, Fu XY, Huang R, Zhang D, Yan J. A regulatory circuit HP1γ/miR-451a/c-Myc promotes prostate cancer progression. Oncogene. 2018; 37:415–26. https://doi.org/10.1038/onc.2017.332 [PubMed]
- 22. Slezak J, Truong M, Huang W, Jarrard D. HP1γ expression is elevated in prostate cancer and is superior to Gleason score as a predictor of biochemical recurrence after radical prostatectomy. BMC Cancer. 2013; 13:148. https://doi.org/10.1186/1471-2407-13-148 [PubMed]
- 23. Itsumi M, Shiota M, Yokomizo A, Kashiwagi E, Takeuchi A, Tatsugami K, Inokuchi J, Song Y, Uchiumi T, Naito S. Human heterochromatin protein 1 isoforms regulate androgen receptor signaling in prostate cancer. J Mol Endocrinol. 2013; 50:401–09. https://doi.org/10.1530/JME-13-0024 [PubMed]
- 24. Fan Y, Li H, Liang X, Xiang Z. CBX3 promotes colon cancer cell proliferation by CDK6 kinase-independent function during cell cycle. Oncotarget. 2017; 8:19934–46. https://doi.org/10.18632/oncotarget.15253 [PubMed]
- 25. Liu M, Huang F, Zhang D, Ju J, Wu XB, Wang Y, Wang Y, Wu Y, Nie M, Li Z, Ma C, Chen X, Zhou JY, et al. Heterochromatin protein HP1γ promotes colorectal cancer progression and is regulated by miR-30a. Cancer Res. 2015; 75:4593–604. https://doi.org/10.1158/0008-5472.CAN-14-3735 [PubMed]
- 26. Chen LY, Cheng CS, Qu C, Wang P, Chen H, Meng ZQ, Chen Z. CBX3 promotes proliferation and regulates glycolysis via suppressing FBP1 in pancreatic cancer. Biochem Biophys Res Commun. 2018; 500:691–97. https://doi.org/10.1016/j.bbrc.2018.04.137 [PubMed]
- 27. Chen LY, Cheng CS, Qu C, Wang P, Chen H, Meng ZQ, Chen Z. Overexpression of CBX3 in Pancreatic Adenocarcinoma Promotes Cell Cycle Transition-Associated Tumor Progression. Int J Mol Sci. 2018; 19:E1768. https://doi.org/10.3390/ijms19061768 [PubMed]
- 28. Zhang H, Fu X, Su X, Yang A. CBX3/HP1γ is upregulated in tongue squamous cell carcinoma and is associated with an unfavorable prognosis. Exp Ther Med. 2018; 15:4271–76. https://doi.org/10.3892/etm.2018.5969 [PubMed]
- 29. Zhang H, Chen W, Fu X, Su X, Yang A. CBX3 promotes tumor proliferation by regulating G1/S phase via p21 downregulation and associates with poor prognosis in tongue squamous cell carcinoma. Gene. 2018; 654:49–56. https://doi.org/10.1016/j.gene.2018.02.043 [PubMed]
- 30. Liang YK, Lin HY, Chen CF, Zeng D. Prognostic values of distinct CBX family members in breast cancer. Oncotarget. 2017; 8:92375–87. https://doi.org/10.18632/oncotarget.21325 [PubMed]
- 31. Alam H, Li N, Dhar SS, Wu SJ, Lv J, Chen K, Flores ER, Baseler L, Lee MG. HP1γ Promotes Lung Adenocarcinoma by Downregulating the Transcription-Repressive Regulators NCOR2 and ZBTB7A. Cancer Res. 2018; 78:3834–48. https://doi.org/10.1158/0008-5472.CAN-17-3571 [PubMed]
- 32. Chang SC, Lai YC, Chen YC, Wang NK, Wang WS, Lai JI. CBX3/heterochromatin protein 1 gamma is significantly upregulated in patients with non-small cell lung cancer. Asia Pac J Clin Oncol. 2018; 14:e283–e288. https://doi.org/10.1111/ajco.12820 [PubMed]
- 33. Zhou J, Bi H, Zhan P, Chang C, Xu C, Huang X, Yu L, Yao X, Yan J. Overexpression of HP1γ is associated with poor prognosis in non-small cell lung cancer cell through promoting cell survival. Tumour Biol. 2014; 35:9777–85. https://doi.org/10.1007/s13277-014-2182-8 [PubMed]
- 34. Roessler S, Jia HL, Budhu A, Forgues M, Ye QH, Lee JS, Thorgeirsson SS, Sun Z, Tang ZY, Qin LX, Wang XW. A unique metastasis gene signature enables prediction of tumor relapse in early-stage hepatocellular carcinoma patients. Cancer Res. 2010; 70:10202–12. https://doi.org/10.1158/0008-5472.CAN-10-2607 [PubMed]
- 35. Chen X, Cheung ST, So S, Fan ST, Barry C, Higgins J, Lai KM, Ji J, Dudoit S, Ng IO, Van De Rijn M, Botstein D, Brown PO. Gene expression patterns in human liver cancers. Mol Biol Cell. 2002; 13:1929–39. https://doi.org/10.1091/mbc.02-02-0023 [PubMed]
- 36. Guichard C, Amaddeo G, Imbeaud S, Ladeiro Y, Pelletier L, Maad IB, Calderaro J, Bioulac-Sage P, Letexier M, Degos F, Clément B, Balabaud C, Chevet E, et al. Integrated analysis of somatic mutations and focal copy-number changes identifies key genes and pathways in hepatocellular carcinoma. Nat Genet. 2012; 44:694–98. https://doi.org/10.1038/ng.2256 [PubMed]
- 37. Bruix J, Sherman M, and American Association for the Study of Liver Diseases. Management of hepatocellular carcinoma: an update. Hepatology. 2011; 53:1020–22. https://doi.org/10.1002/hep.24199 [PubMed]
- 38. Xu J, Ding T, He Q, Yu XJ, Wu WC, Jia WH, Yun JP, Zhang Y, Shi M, Shao CK, Pan WD, Yin XY, Min J, et al. An in situ molecular signature to predict early recurrence in hepatitis B virus-related hepatocellular carcinoma. J Hepatol. 2012; 57:313–21. https://doi.org/10.1016/j.jhep.2012.03.027 [PubMed]
- 39. Dutta R, Mahato RI. Recent advances in hepatocellular carcinoma therapy. Pharmacol Ther. 2017; 173:106–17. https://doi.org/10.1016/j.pharmthera.2017.02.010 [PubMed]
- 40. Lomberk G, Wallrath L, Urrutia R. The Heterochromatin Protein 1 family. Genome Biol. 2006; 7:228. https://doi.org/10.1186/gb-2006-7-7-228 [PubMed]
- 41. Oyama K, El-Nachef D, Fang C, Kajimoto H, Brown JP, Singh PB, MacLellan WR. Deletion of HP1γ in cardiac myocytes affects H4K20me3 levels but does not impact cardiac growth. Epigenetics Chromatin. 2018; 11:18. https://doi.org/10.1186/s13072-018-0187-z [PubMed]
- 42. Oshiro H, Hirabayashi Y, Furuta Y, Okabe S, Gotoh Y. Up-regulation of HP1gamma expression during neuronal maturation promotes axonal and dendritic development in mouse embryonic neocortex. Genes Cells. 2015; 20:108–20. https://doi.org/10.1111/gtc.12205 [PubMed]
- 43. Sridharan R, Gonzales-Cope M, Chronis C, Bonora G, McKee R, Huang C, Patel S, Lopez D, Mishra N, Pellegrini M, Carey M, Garcia BA, Plath K. Proteomic and genomic approaches reveal critical functions of H3K9 methylation and heterochromatin protein-1γ in reprogramming to pluripotency. Nat Cell Biol. 2013; 15:872–82. https://doi.org/10.1038/ncb2768 [PubMed]
- 44. Han SS, Kim WJ, Hong Y, Hong SH, Lee SJ, Ryu DR, Lee W, Cho YH, Lee S, Ryu YJ, Won JY, Rhee H, Park JH, et al. RNA sequencing identifies novel markers of non-small cell lung cancer. Lung Cancer. 2014; 84:229–35. https://doi.org/10.1016/j.lungcan.2014.03.018 [PubMed]
- 45. Ning G, Huang YL, Zhen LM, Xu WX, Jiao Q, Yang FJ, Wu LN, Zheng YY, Song J, Wang YS, Xie C, Peng L. Transcriptional expressions of Chromobox 1/2/3/6/8 as independent indicators for survivals in hepatocellular carcinoma patients. Aging (Albany NY). 2018; 10:3450–73. https://doi.org/10.18632/aging.101658 [PubMed]