


Introduction
Dementia affects 43.8 million adults worldwide [1]. Due to increasing longevity globally, the absolute number of individuals living with dementia is expected to triple by 2050 [2]. Alzheimer’s disease (AD) is the most common type of dementia, representing 70% of all dementia cases and affecting approximately 5 million U.S. adults [3]. As the country’s sixth leading cause of death and a leading cause of disability and poor health, AD represents a major public health challenge [4]. Despite the well-established burden of AD on individual patients, their caregivers, and society, there are few effective strategies for the early prevention and treatment of this debilitating condition.
The long prodromal period preceding AD, which may include over a decade of pre-clinical cognitive decline followed by mild cognitive impairment (MCI) [5,6], provides an opportunity to identify novel molecular precursors to clinical symptoms and diagnosis of AD. Indeed, previous studies have discovered various blood metabolites that can differentiate normal controls from those MCI, in addition to AD [7–11]. Although these findings are promising, the previous studies have been limited in sample size or to the sole use of targeted metabolomics approaches which only measure pre-specified, biological candidate metabolites [7–11]. To our knowledge, only one previous study employed agnostic untargeted metabolomics profiling to discover novel metabolites for early cognitive decline [12]. Additional research in this area is critically needed to identify novel biomarkers for early AD prediction and potential targets for molecular-based interventions aimed at AD prevention and early treatment.
In the current study, we aimed to identify novel serum metabolites and metabolite networks associated with cognition in middle-aged adults, prior to any clinical symptoms. Our analysis leveraged data collected from the large, biracial Bogalusa Heart Study (BHS), whose participants underwent untargeted, ultrahigh performance liquid chromatography-tandem mass spectroscopy metabolomics profiling and were carefully phenotyped for multiple domains of cognition, along with important covariables, at the recently completed 2013 to 2016 study visit.
Results
Characteristics of the 1,177 BHS metabolomics study participants are shown in Table 1. On average, BHS participants were middle-aged, obese, with systolic BP, glucose, and LDL-C values elevated slightly above the normal range. The participants were predominantly female, non-smokers, and approximately half were current drinkers and had at least a high-school education. As expected, BHS participants tended to perform well on all eight tests of cognitive function, which measured global cognition as well as the domains of verbal memory, attention and concentration, processing speed, ability to decode, and executive function (Table 1 and Supplementary Figure 1).
Table 1. Characteristics of BHS Participants (n=1,177).
| Characteristic | Overall | White Male (n=324) | White Female (n=449) | Black Male (n=150) | Black Female (n=254) | ||||||||||||||||||||||||||||||||||||||||||||||||||||||||||||||||||||||||||||||||||||||||||||||
| Age(years), mean (SD) | 48.11 (5.26) | 48.92 (4.91) | 48.15 (5.08) | 47.27 (6.03) | 47.53 (5.38) | ||||||||||||||||||||||||||||||||||||||||||||||||||||||||||||||||||||||||||||||||||||||||||||||
| <=12 years (high school), n (%) | 589 (50.04%) | 156 (48.15%) | 176 (39.20%) | 105 (70.00%) | 152 (59.84%) | ||||||||||||||||||||||||||||||||||||||||||||||||||||||||||||||||||||||||||||||||||||||||||||||
| Vocabulary score, mean (SD) | 26.54 (9.83) | 28.87 (8.94) | 30.43 (9.30) | 20.23 (7.88) | 20.42 (7.91) | ||||||||||||||||||||||||||||||||||||||||||||||||||||||||||||||||||||||||||||||||||||||||||||||
| Depression, n (%) | 124 (10.54%) | 26 (8.02%) | 60 (13.36%) | 11 (7.33%) | 27 (10.63%) | ||||||||||||||||||||||||||||||||||||||||||||||||||||||||||||||||||||||||||||||||||||||||||||||
| Smoking, n (%) | |||||||||||||||||||||||||||||||||||||||||||||||||||||||||||||||||||||||||||||||||||||||||||||||||||
| Never | 600 (50.98%) | 158 (48.77%) | 243 (54.12%) | 50 (33.33%) | 149 (58.66%) | ||||||||||||||||||||||||||||||||||||||||||||||||||||||||||||||||||||||||||||||||||||||||||||||
| Former | 348 (29.57%) | 105 (32.41%) | 133 (29.62%) | 47 (31.33%) | 63 (24.80%) | ||||||||||||||||||||||||||||||||||||||||||||||||||||||||||||||||||||||||||||||||||||||||||||||
| Current | 229 (19.46%) | 61 (18.83%) | 73 (16.26%) | 53 (35.33%) | 42 (16.54%) | ||||||||||||||||||||||||||||||||||||||||||||||||||||||||||||||||||||||||||||||||||||||||||||||
| Drinking, n (%) | |||||||||||||||||||||||||||||||||||||||||||||||||||||||||||||||||||||||||||||||||||||||||||||||||||
| Never | 138 (11.72%) | 13 (4.01%) | 55 (12.25%) | 17 (11.33%) | 53 (20.87%) | ||||||||||||||||||||||||||||||||||||||||||||||||||||||||||||||||||||||||||||||||||||||||||||||
| Former | 379 (32.20%) | 109 (33.64%) | 145 (32.29%) | 48 (32.00%) | 77 (30.31%) | ||||||||||||||||||||||||||||||||||||||||||||||||||||||||||||||||||||||||||||||||||||||||||||||
| Current | 660 (56.07%) | 202 (62.35%) | 249 (55.46%) | 85 (56.67%) | 124 (48.82%) | ||||||||||||||||||||||||||||||||||||||||||||||||||||||||||||||||||||||||||||||||||||||||||||||
| BMI (kg/m2), mean (SD) | 31.37 (7.79) | 30.46 (6.05) | 30.12 (7.40) | 31.13 (8.58) | 34.87 (8.88) | ||||||||||||||||||||||||||||||||||||||||||||||||||||||||||||||||||||||||||||||||||||||||||||||
| SBP (mmHg), mean (SD) | 123.08 (16.72) | 125.35 (13.69) | 117.28 (14.45) | 131.50 (15.86) | 125.46 (20.68) | ||||||||||||||||||||||||||||||||||||||||||||||||||||||||||||||||||||||||||||||||||||||||||||||
| Glucose(mg/dl), mean (SD) | 106.07 (34.64) | 106.90 (26.73) | 103.88 (35.65) | 107.55 (31.81) | 108.03 (42.47) | ||||||||||||||||||||||||||||||||||||||||||||||||||||||||||||||||||||||||||||||||||||||||||||||
| LDL cholesterol(mg/dl), mean (SD) | 114.61 (35.06) | 116.97 (33.74) | 116.04 (33.91) | 108.02 (35.82) | 112.95 (37.81) | ||||||||||||||||||||||||||||||||||||||||||||||||||||||||||||||||||||||||||||||||||||||||||||||
| Global cognition, median (IQR) | 0.52 (7.68) | 0.71 (6.91) | 2.98 (6.80) | -3.80 (6.39) | -1.36 (7.32) | ||||||||||||||||||||||||||||||||||||||||||||||||||||||||||||||||||||||||||||||||||||||||||||||
| Verbal Memory | |||||||||||||||||||||||||||||||||||||||||||||||||||||||||||||||||||||||||||||||||||||||||||||||||||
| Logical memory I, median (IQR) | 20.00 (10.00) | 20.00 (9.00) | 22.00 (9.00) | 17.00 (10.00) | 18.00 (8.00) | ||||||||||||||||||||||||||||||||||||||||||||||||||||||||||||||||||||||||||||||||||||||||||||||
| Logical memory II, median (IQR) | 16.00 (10.00) | 16.00 (10.00) | 18.00 (9.00) | 12.00 (8.00) | 14.00 (8.00) | ||||||||||||||||||||||||||||||||||||||||||||||||||||||||||||||||||||||||||||||||||||||||||||||
| Logical memory II-recognition, median (IQR) | 24.00 (4.00) | 24.00 (4.00) | 25.00 (4.00) | 22.00 (5.00) | 23.00 (4.00) | ||||||||||||||||||||||||||||||||||||||||||||||||||||||||||||||||||||||||||||||||||||||||||||||
| Attention and Concentration | |||||||||||||||||||||||||||||||||||||||||||||||||||||||||||||||||||||||||||||||||||||||||||||||||||
| Digit span forward, median (IQR) | 11.00 (4.00) | 12.00 (4.00) | 12.00 (4.00) | 10.50 (4.00) | 11.00 (4.00) | ||||||||||||||||||||||||||||||||||||||||||||||||||||||||||||||||||||||||||||||||||||||||||||||
| Digit span backward, median (IQR) | 7.00(3.00) | 8.00 (4.00) | 8.00 (4.00) | 6.00 (3.00) | 7.00 (2.00) | ||||||||||||||||||||||||||||||||||||||||||||||||||||||||||||||||||||||||||||||||||||||||||||||
| Processing Speed | |||||||||||||||||||||||||||||||||||||||||||||||||||||||||||||||||||||||||||||||||||||||||||||||||||
| Digit coding, median (IQR) | 60.00 (24.00) | 57.00 (20.00) | 67.00 (23.00) | 45.00 (20.00) | 59.00 (25.00) | ||||||||||||||||||||||||||||||||||||||||||||||||||||||||||||||||||||||||||||||||||||||||||||||
| Trial making test A, median (IQR) | 0.42 (0.21) | 0.43 (0.20) | 0.39 (0.18) | 0.48 (0.25) | 0.44 (0.21) | ||||||||||||||||||||||||||||||||||||||||||||||||||||||||||||||||||||||||||||||||||||||||||||||
| Ability to Decode | |||||||||||||||||||||||||||||||||||||||||||||||||||||||||||||||||||||||||||||||||||||||||||||||||||
| Word reading, median (IQR) | 42.00 (13.00) | 45.00 (10.00) | 46.00 (9.00) | 36.00 (16.00) | 37.00 (13.00) | ||||||||||||||||||||||||||||||||||||||||||||||||||||||||||||||||||||||||||||||||||||||||||||||
| Executive function | |||||||||||||||||||||||||||||||||||||||||||||||||||||||||||||||||||||||||||||||||||||||||||||||||||
| Trial making test B, median (IQR) | 0.91 (0.53) | 0.89 (0.48) | 0.83 (0.44) | 1.16 (0.67) | 1.01 (0.57) | ||||||||||||||||||||||||||||||||||||||||||||||||||||||||||||||||||||||||||||||||||||||||||||||
| Data are presented as mean (standard deviation) or median (interquartile range) for continuous variables and as percentage for categorical variables. | |||||||||||||||||||||||||||||||||||||||||||||||||||||||||||||||||||||||||||||||||||||||||||||||||||
| BMI: body mass index | |||||||||||||||||||||||||||||||||||||||||||||||||||||||||||||||||||||||||||||||||||||||||||||||||||
| SBP: systolic blood pressure | |||||||||||||||||||||||||||||||||||||||||||||||||||||||||||||||||||||||||||||||||||||||||||||||||||
| LDL: low-density lipoprotein | |||||||||||||||||||||||||||||||||||||||||||||||||||||||||||||||||||||||||||||||||||||||||||||||||||
| SD: standard deviation | |||||||||||||||||||||||||||||||||||||||||||||||||||||||||||||||||||||||||||||||||||||||||||||||||||
| IQR: interquartile range | |||||||||||||||||||||||||||||||||||||||||||||||||||||||||||||||||||||||||||||||||||||||||||||||||||
Association of single metabolites with cognitive tests
A total of 14 metabolites achieved Bonferroni corrected significance in the overall and/or ethnicity-sex stratified analyses (Figure 1 and Supplementary Figure 2). Among them, 6 metabolites were robustly association with cognition phenotypes, demonstrating consistent effect directions across all analyses. These metabolites included 5 known biochemicals (Table 2) and 1 still unrecognized biochemicals (Supplementary Table 1). One of these metabolites, maltose, was negatively associated with global cognition score [minimum P-value (min-P) =9.77E-06]. Five metabolites were associated with the processing speed cognitive domain. Among them, four metabolites were negatively associated with digit coding test scores, including: N-acetyl-isoputreanine which belongs to the amino acid super pathway (min-P =1.03E-05), 9-hydroxystearate which belongs to the lipid super pathway (min-P =1.11E-05), 7-methylguanine which belongs to the nucleotide super pathway (min-P =1.19E-05), and unknown metabolite X-21840 (min-P =4.32E-06). From the lipid super pathway, the remaining metabolite, glyco-alpha-muricholate (min-P =4.10E-05), was positively associated with trail making test A scores. The remaining 8 metabolites, which reached Bonferroni-corrected significance in the overall or either ethnicity-sex-specific analysis, had inconsistent effect directions across the groups (Supplementary Table 2). Although not significant by the stringent criteria used in the current study, these promising metabolites included two associated with the global cognition domain (3-hydroxyoctanoate and phosphoethanolamine), one associated with the verbal memory domain (3-methoxytyrosine), two associated with the attention & concentration domain [1-palmitoyl-GPC (16:0) and 1-palmitoyl-2-stearoyl-GPC (16:0/18:0)], one associated with the processing speed domain [1-(1-enyl-palmitoyl)-2-palmitoleoyl-GPC (P-16:0/16:1)], and two associated with the executive function domain [methionine sulfone and 1-stearoyl-2-oleoyl-GPC (18:0/18:1)].
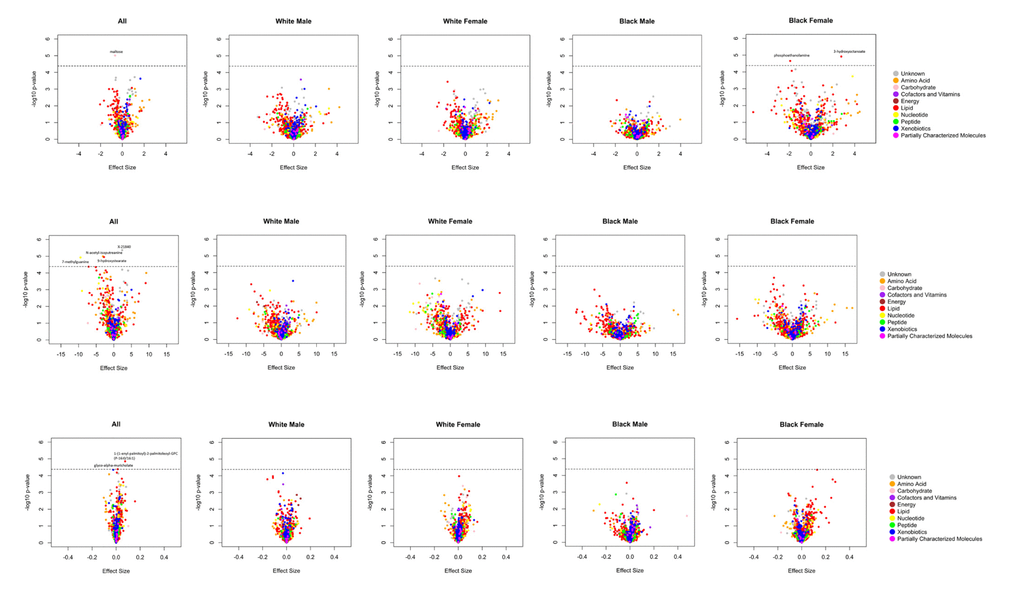
Figure 1. A. Volcano plots of effect sizes versus –log10 P values for all 1202 metabolites among BHS participants, according to cognitive domain. (A) Global cognition; (B) Processing speed (digit coding test); (C) Processing speed (trail making test A).
Table 2. Novel metabolites achieving significance in BHS participants.
| Super Pathway | Sub Pathway | Metabolite | BHS Sample | ES | SE | P | |||||||||||||||||||||||||||||||||||||||||||||||||||||||||||||||||||||||||||||||||||||||||||||
| Global Cognition | |||||||||||||||||||||||||||||||||||||||||||||||||||||||||||||||||||||||||||||||||||||||||||||||||||
| Carbohydrate | Glycogen Metabolism | Maltose1 | Overall | -0.67 | 0.15 | 9.77E-06 | |||||||||||||||||||||||||||||||||||||||||||||||||||||||||||||||||||||||||||||||||||||||||||||
| White Male | -0.65 | 0.25 | 9.66E-03 | ||||||||||||||||||||||||||||||||||||||||||||||||||||||||||||||||||||||||||||||||||||||||||||||||
| White Female | -1.01 | 0.31 | 1.12E-03 | ||||||||||||||||||||||||||||||||||||||||||||||||||||||||||||||||||||||||||||||||||||||||||||||||
| Black Male | -0.47 | 0.35 | 1.76E-01 | ||||||||||||||||||||||||||||||||||||||||||||||||||||||||||||||||||||||||||||||||||||||||||||||||
| Black Female | -0.07 | 0.38 | 8.60E-01 | ||||||||||||||||||||||||||||||||||||||||||||||||||||||||||||||||||||||||||||||||||||||||||||||||
| Processing Speed | |||||||||||||||||||||||||||||||||||||||||||||||||||||||||||||||||||||||||||||||||||||||||||||||||||
| Amino Acid | Polyamine Metabolism | N-acetyl-isoputreanine*2 | Overall | -3.11 | 0.70 | 1.03E-05 | |||||||||||||||||||||||||||||||||||||||||||||||||||||||||||||||||||||||||||||||||||||||||||||
| White Male | -0.95 | 1.23 | 4.41E-01 | ||||||||||||||||||||||||||||||||||||||||||||||||||||||||||||||||||||||||||||||||||||||||||||||||
| White Female | -3.66 | 1.32 | 5.71E-03 | ||||||||||||||||||||||||||||||||||||||||||||||||||||||||||||||||||||||||||||||||||||||||||||||||
| Black Male | -2.47 | 1.55 | 1.15E-01 | ||||||||||||||||||||||||||||||||||||||||||||||||||||||||||||||||||||||||||||||||||||||||||||||||
| Black Female | -4.82 | 1.85 | 9.77E-03 | ||||||||||||||||||||||||||||||||||||||||||||||||||||||||||||||||||||||||||||||||||||||||||||||||
| Lipid | Fatty Acid, Monohydroxy | 9-hydroxystearate2 | Overall | -2.79 | 0.63 | 1.11E-05 | |||||||||||||||||||||||||||||||||||||||||||||||||||||||||||||||||||||||||||||||||||||||||||||
| White Male | -1.44 | 1.17 | 2.18E-01 | ||||||||||||||||||||||||||||||||||||||||||||||||||||||||||||||||||||||||||||||||||||||||||||||||
| White Female | -2.35 | 0.99 | 1.82E-02 | ||||||||||||||||||||||||||||||||||||||||||||||||||||||||||||||||||||||||||||||||||||||||||||||||
| Black Male | -3.61 | 1.76 | 4.23E-02 | ||||||||||||||||||||||||||||||||||||||||||||||||||||||||||||||||||||||||||||||||||||||||||||||||
| Black Female | -5.06 | 1.69 | 2.98E-03 | ||||||||||||||||||||||||||||||||||||||||||||||||||||||||||||||||||||||||||||||||||||||||||||||||
| Nucleotide | Purine Metabolism, Guanine containing | 7-methylguanine2 | Overall | -9.46 | 2.15 | 1.19E-05 | |||||||||||||||||||||||||||||||||||||||||||||||||||||||||||||||||||||||||||||||||||||||||||||
| White Male | -9.14 | 3.78 | 1.61E-02 | ||||||||||||||||||||||||||||||||||||||||||||||||||||||||||||||||||||||||||||||||||||||||||||||||
| White Female | -10.55 | 3.91 | 7.18E-03 | ||||||||||||||||||||||||||||||||||||||||||||||||||||||||||||||||||||||||||||||||||||||||||||||||
| Black Male | -8.42 | 5.29 | 1.14E-01 | ||||||||||||||||||||||||||||||||||||||||||||||||||||||||||||||||||||||||||||||||||||||||||||||||
| Black Female | -5.89 | 5.12 | 2.51E-01 | ||||||||||||||||||||||||||||||||||||||||||||||||||||||||||||||||||||||||||||||||||||||||||||||||
| Lipid | Primary Bile Acid Metabolism | Glyco-alpha-muricholate**3 | Overall | 0.01 | 0.0032 | 4.10E-05 | |||||||||||||||||||||||||||||||||||||||||||||||||||||||||||||||||||||||||||||||||||||||||||||
| White Male | 0.01 | 0.0045 | 1.58E-02 | ||||||||||||||||||||||||||||||||||||||||||||||||||||||||||||||||||||||||||||||||||||||||||||||||
| White Female | 0.02 | 0.01 | 1.27E-03 | ||||||||||||||||||||||||||||||||||||||||||||||||||||||||||||||||||||||||||||||||||||||||||||||||
| Black Male | 0.01 | 0.01 | 1.54E-01 | ||||||||||||||||||||||||||||||||||||||||||||||||||||||||||||||||||||||||||||||||||||||||||||||||
| Black Female | 0.01 | 0.01 | 2.19E-01 | ||||||||||||||||||||||||||||||||||||||||||||||||||||||||||||||||||||||||||||||||||||||||||||||||
| ES=Effect size; SE=Standard error. Adjusted for age, gender, ethnicity, cigarette smoking, drinking, education, depression, vocabulary, BMI, SBP, LDL-C and glucose. | |||||||||||||||||||||||||||||||||||||||||||||||||||||||||||||||||||||||||||||||||||||||||||||||||||
| * Indicates compounds that have not been officially confirmed based on a standard, but we are confident in its identity. | |||||||||||||||||||||||||||||||||||||||||||||||||||||||||||||||||||||||||||||||||||||||||||||||||||
| ** Indicates a compound for which a standard is not available, but we are reasonably confident in its identity. | |||||||||||||||||||||||||||||||||||||||||||||||||||||||||||||||||||||||||||||||||||||||||||||||||||
| 1. Associated with global cognition score. | |||||||||||||||||||||||||||||||||||||||||||||||||||||||||||||||||||||||||||||||||||||||||||||||||||
| 2. Associated with digit coding test. | |||||||||||||||||||||||||||||||||||||||||||||||||||||||||||||||||||||||||||||||||||||||||||||||||||
| 3. Associated with trail making test A. | |||||||||||||||||||||||||||||||||||||||||||||||||||||||||||||||||||||||||||||||||||||||||||||||||||
Pearson correlations between the six robustly identified metabolites are presented in Figure 2. Metabolites associated with digit coding and trail making test A, which both measure the processing speed cognitive domain, were all modestly to moderately correlated, with correlation coefficients ranging from 0.08 to 0.44.
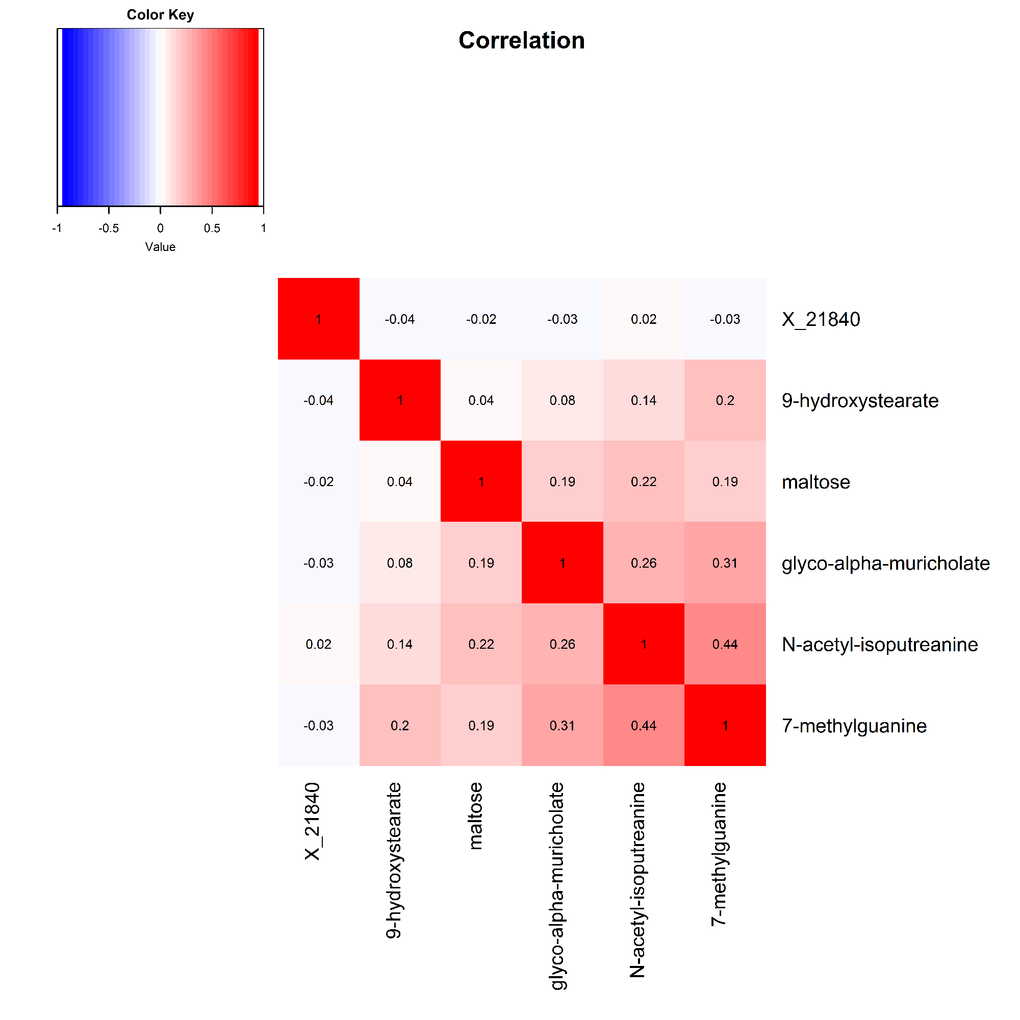
Figure 2. Heat map displaying pairwise correlation coefficients for the six identified metabolites.
Associations of metabolite modules with cognitive tests
The 9 metabolite modules identified among BHS participants are depicted in Figure 3A, Figure 3B, Figure 3C and Supplementary Figure 3. A module comprised of metabolites involved in primary and secondary bile acid metabolism were consistently associated with processing speed. This module demonstrated negative associations with digit coding test scores (min-P =6.00E-04), where higher test score values represent better test performance, and positive associations with TMT A scores (min-P =5.00E-04), where lower test score values represent better test performance. The network of eight metabolites most highly correlated with this module’s eigenmetabolite value (r>0.70) are presented in Figure 4. Additionally, a module comprised of metabolites involved in androgenic steroids was associated with global cognition score. This module demonstrated positive associations with global cognition score (min-P =3.00E-03), where higher test score values represent better test performance. The network of seven metabolites most highly correlated with this module’s eigenmetabolite value (r>0.70) are presented in Figure 5.
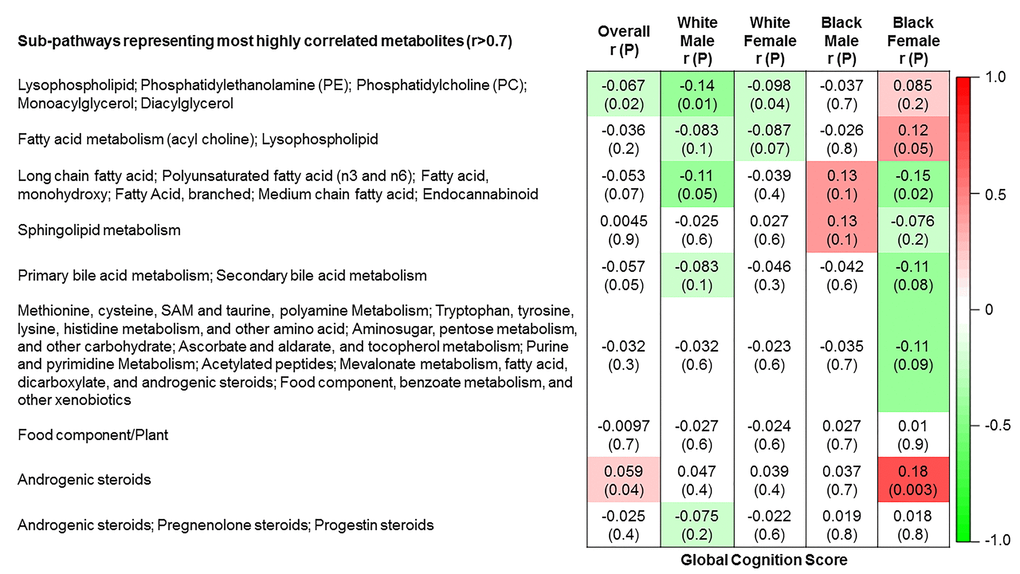
Figure 3A. Correlations of metabolite modules with cognition. Global cognition (global cognition score).
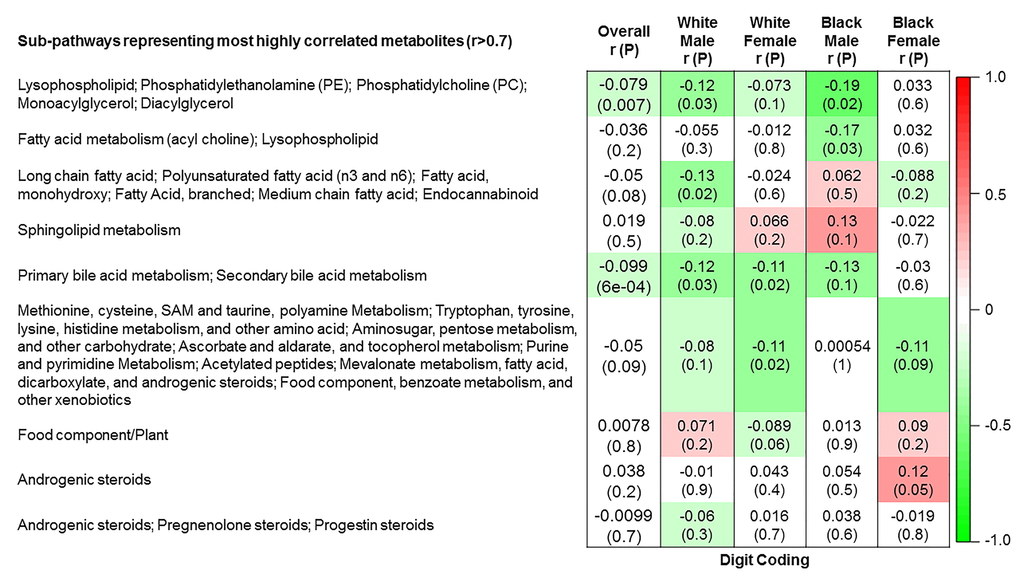
Figure 3B. Correlations of metabolite modules with cognition. Processing speed domain (digit coding test).
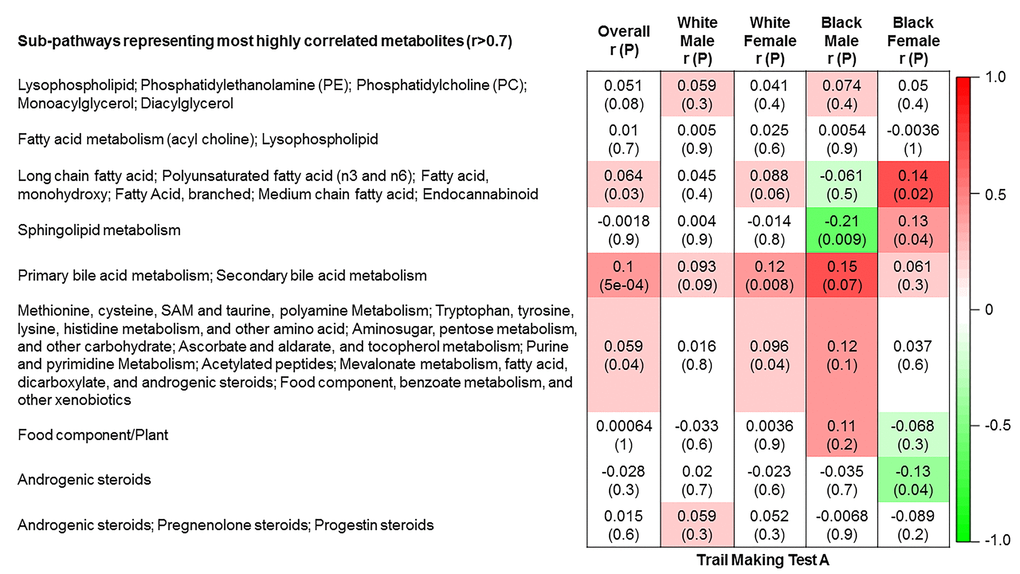
Figure 3C. Correlations of metabolite modules with cognition. Processing speed domain (trail making test A).
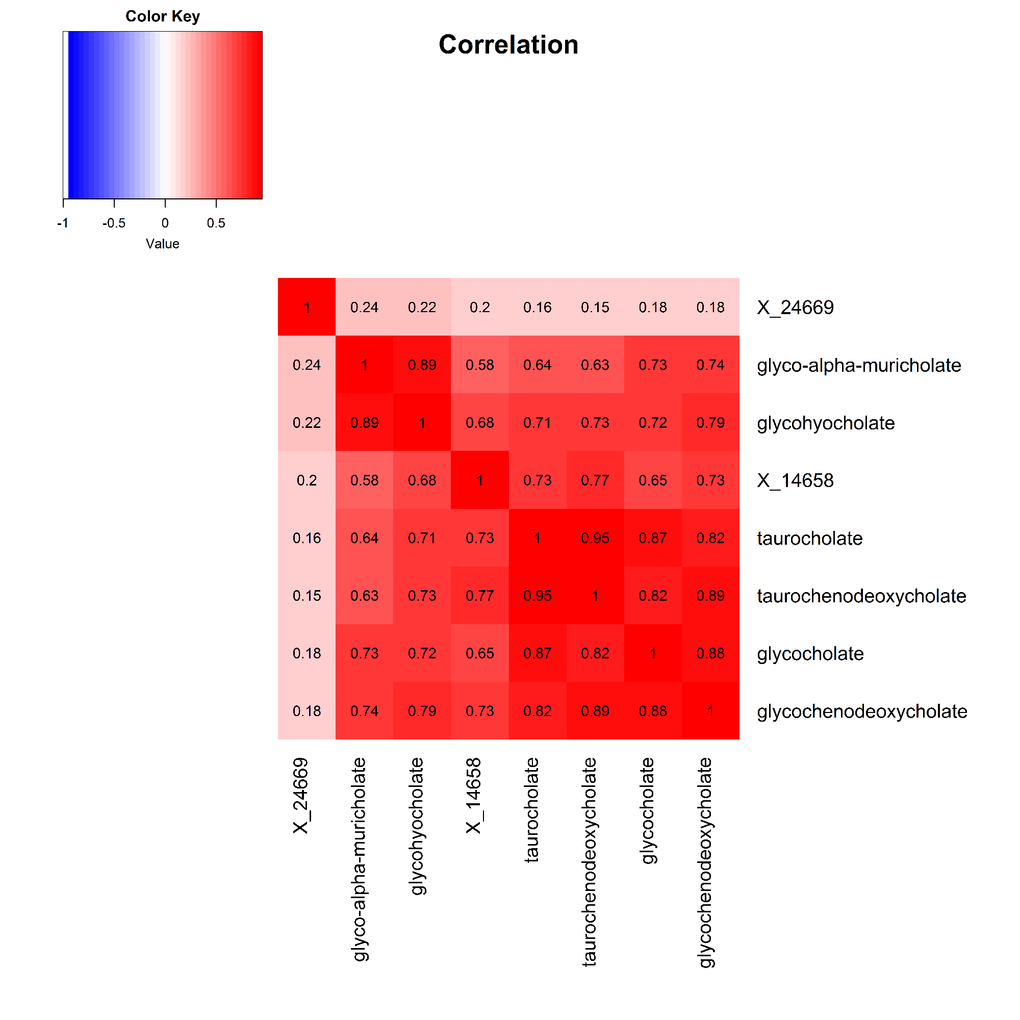
Figure 4. Heat map displaying pairwise correlation coefficients for the network of metabolites representing the significant primary and secondary bile acid metabolism pathway.
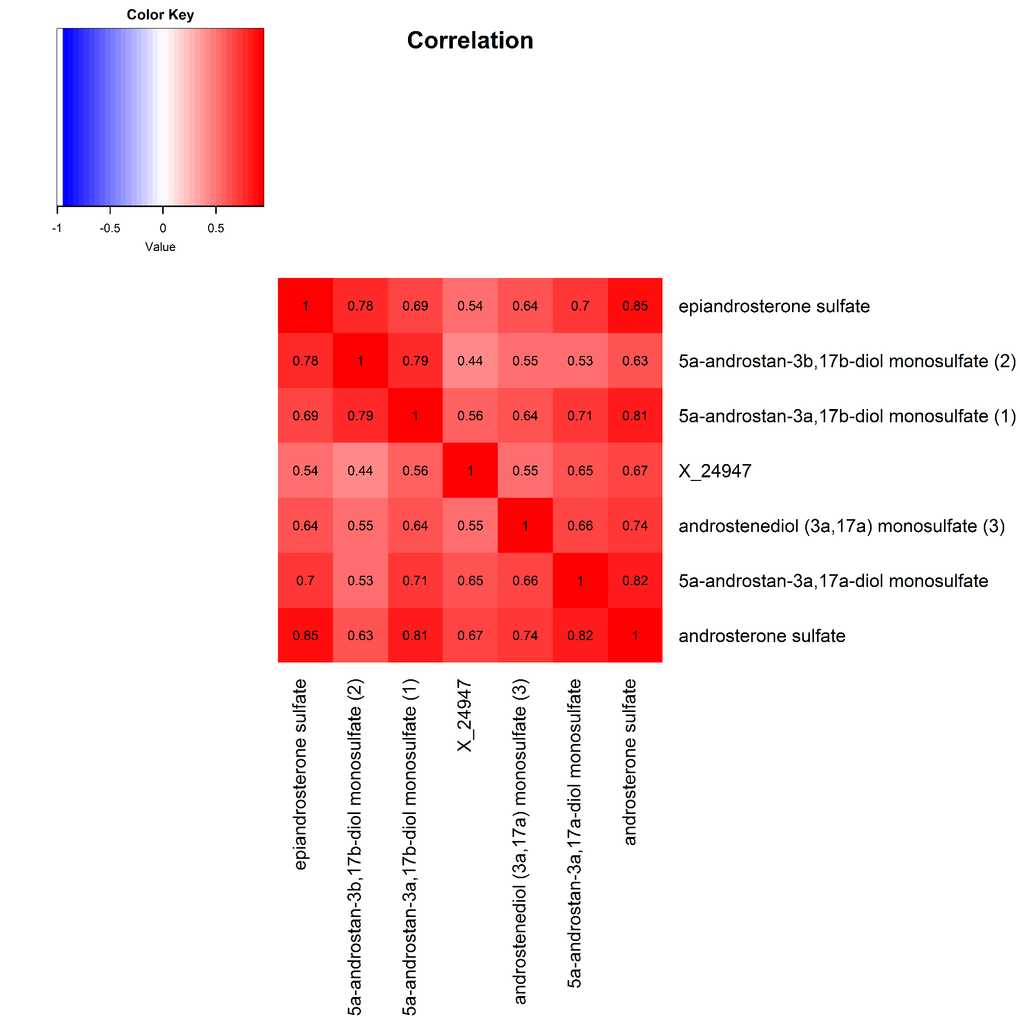
Figure 5. Heat map displaying pairwise correlation coefficients for the network of metabolites representing the significant androgenic steroids pathway.
Discussion
The current study robustly identified novel associations of six individual metabolites and two metabolite modules with cognition phenotypes among BHS participants. Identified metabolites included 5 known biochemical compounds along with 1 still unidentified analyte. Among the 5 known metabolites, one involved in glycogen metabolism, maltose, was associated with global cognition. An additional four metabolites associated with the processing speed cognitive domain including: N-acetyl-isoputreanine, an amino acid involved in polyamine metabolism; 9-hydroxystearate, a mono-hydroxy fatty acid metabolite; 7-methylguanine, a nucleotide involved in guanine containing purine metabolism; and glyco-alpha-muricholate, a metabolite involved in primary bile acid metabolism. Bolstering findings from the single metabolite analysis, a correlated network of metabolites involved in primary and secondary bile acid metabolism, which included glycol-alpha-muricholate, consistently associated with processing speed. In addition, one metabolite module comprised of metabolites related to androgenic steroids, which were not identified in the single metabolite analyses, were correlated with global cognition score. In aggregate, these findings identify several novel biomarkers of cognitive function in middle-aged adults, prior to clinical symptoms and onset of AD.
One single metabolite, maltose, and one metabolite module comprised of androgenic steroid related metabolites associated with global cognition in the current analysis. As one of the major disaccharides, maltose is produced by the breakdown of starch and can be further metabolized into two glucose molecules [13]. Similar to glucose, serum insulin concentrations have been empirically demonstrated to increase in response to intravenous maltose infusion [14–16], with maltose providing twice the calories for the same volume and concentration of glucose [14,15]. While insulin resistance and obesity, in the context of the metabolic syndrome, have been independently linked to cognitive decline [17,18], our study demonstrated a persistent inverse relation between maltose and cognitive phenotypes even after adjustment for BMI, systolic BP, and fasting LDL-C and glucose levels. While future research in this area is needed, these data suggest potentially novel biological pathways linking maltose to cognition. In addition to maltose, network analyses suggested a role for androgenic steroid metabolites in global cognition. Sex differences in cognitive function and certain neuropsychiatric diseases have been reported previously [19–21]. Consistent with findings reported here, sex hormones, including androgens, were believed to be important drivers underlying these associations [20,22]. Our findings add to the previous literature, suggesting that within each sex group and after adjusting for sex, androgenic steroid metabolite levels directly associate with cognition.
Four correlated metabolites and one metabolite module associated with the processing speed cognitive domain in our analyses. Among them, three metabolites associated with the digit coding test and included N-acetyl-isoputreanine, 9-hydroxystearate and 7-methylguanine. N-acetyl-isoputreanine is a purported byproduct of aldehyde dehydrogenase (ALDH) enzymatic action and end-product of polyamine metabolism [23]. ALDH is an enzyme critical to alcohol metabolism while polyamine metabolism plays an important role in cell growth and differentiation. Since both ALDH activity and polyamine metabolism have been implicated in cognitive dysfunction, the results of this analysis suggest a potentially shared biological mechanism of action [24–30]. As an endogenous lipoperoxidation product, 9-hydroxystearate is poorly studied but its parent compound, 9-hydroxystearic acid, is a well-known negative regulator of histone deacetylase (HDAC) [31,32]. HDAC can remove the acetyl group from histone proteins, thereby decreasing gene transcription rates [33]. Histone acetylation levels have previously been linked to cognitive dysfunction [33–35], and HDAC inhibitors are considered promising future therapeutic agents for the treatment of AD [34]. While we are the first to link 7-methylguanine to a complex cognition phenotype, this metabolite has previously been associated with Huntington’s disease (HD), a monogenic disorder with profound effects on cognitive and motor function [36]. Furthermore, urine levels of 7-methylguanine are a well-known indicator of tobacco smoking, which has been previously linked to cognitive decline and may suggest a novel biological mechanism mediating this relation [37–39]. In aggregate, the potential biological relevance of these metabolites to cognition strongly support a need further study of their temporal relations to cognitive decline.
The remaining metabolite associated with processing speed was identified by the TMT A test. The recently identified glyco-alpha-muricholate metabolite belongs to the primary bile acid metabolism sub-pathway, which is essential for the digestion of dietary fats and the secretion of lipids [40]. Bolstering the evidence for its role in cognition was our observation of a network of correlated primary and secondary bile acid metabolism metabolites, including glycol-alpha-muricholate, that collectively and consistently associated with processing speed as measured by both the digit coding and TMT A assessments. Furthermore, animal models have demonstrated the therapeutic benefits of tauroursodeoxycholic acid, an endogenous bile acid, in both AD and HD pathologies [41,42]. In humans, altered bile acid profiles have also been reported in AD [43], with our findings further adding evidence of its potentially important role in the earlier regulation of cognition.
The current study has several strengths. To our knowledge, this is the largest untargeted metabolomics study of cognition conducted to date. The large sample size enabled analyses stratified by both ethnicity and sex, allowing us to report 6 metabolites that may be relevant to diverse populations. Furthermore, metabolomics profiling, covariable measurement, and cognition phenotyping was conducted using a stringent study protocol with rigorous quality assurance and quality control procedures employed. Certain limitations should also be mentioned. As a cross-sectional study, this analysis cannot establish a temporal relationship between the identified metabolites and cognition phenotypes. Thus, prospective studies of these metabolites are needed to assess the etiologic relevance of our findings. To minimize false positive findings, only metabolites with consistency in effect direction across the mutually exclusive ethnic and sex groups were considered robustly significant in the current analysis. However, this rigorous control of type 1 error may have limited our ability to detect metabolites with effects that are relevant to specific populations. The eight metabolites that achieved Bonferroni corrected significance but lacked consistency in effect directions across ethnic- or sex-groups warrant confirmation by future studies.
The current study identified novel associations of five metabolites of known biochemical structure and two metabolite modules with cognition. Although we are the first to describe these metabolite-cognition signals, the biological pathways represented by the identified metabolites generally demonstrated clear relevance to cognition, providing additional qualitative support of our findings. In aggregate, this study offers new insights into the molecular mechanisms regulating cognitive function. Furthermore, the metabolites reported here should be evaluated for their longitudinal relationships with cognitive decline and development of MCI and dementia.
Materials and Methods
Study population
The BHS is a community-based long-term study investigating the natural history of cardiovascular disease among a biracial sample (65% white and 35% African-American) of residents from Bogalusa, Louisiana, begun in 1973 by Dr. Gerald Berenson. From 1973 to today, 7 surveys were conducted in children and adolescents aged 4 to 17 years, and 11 surveys were conducted among adults aged 18 to 51 years who had been examined previously as children. The current BHS cohort includes 1,298 participants born between 1959 and 1979 who were screened at least 2 times during childhood and 2 times during adulthood for cardiovascular disease risk factors. Data and specimens collected in the 2013 to 2016 follow-up visit were used in cross-sectional analysis of these participants. Among the 1,298 eligible participants, those missing metabolomics (n = 37), covariable (n=80), or cognition test data (n=20) were excluded, leaving 1,177 participants for the study.
Informed consents were obtained from all the Bogalusa Heart Study participants after detailed explanation of the study. The study was approved by the Institutional Review Board at Tulane University.
Metabolite profiling
Untargeted, ultrahigh performance liquid chromatography-tandem mass spectroscopy (UPLC-MS/MS) was conducted by Metabolon© using BHS serum samples that had been stored at -80°C since the 2013 to 2016 visit [44]. Rigorous quality assurance was conducted during metabolomics profiling which included the use of blanks, blind duplicates (5% of the BHS samples), and standard biochemical compounds which were integrated into every analyzed sample. Untargeted metabolomics profiling resulted in the detection and quantification of 1,466 metabolites. These included 956 known biochemical compounds in pathways related to amino acids (n=184), carbohydrates (n=25), cofactors and vitamins (n=34), energy (n=9), lipids (n=408), nucleotides (n=41), peptides (n=35), and xenobiotics (n=220). An additional 510 unnamed compounds currently lacking chemical standards were also quantified. These metabolites were labeled with an “X” followed by numbers (e.g., X-12345) and may be identified upon the eventual acquisition of a matching purified standard (or via classical structural analysis).
Prior to the statistical analysis, additional quality control and manipulation of the metabolite data was undertaken. Batch effects were assessed using principal components analysis, which revealed no evidence of clustering of metabolite data by run-days. Data filtering removed 213 metabolites that were missing or below the detection threshold in more than 80% of samples and 51 metabolites with a reliability coefficient <0.3 based on blind duplicate analysis. Among the 1,202 metabolites passing quality control, 167 were missing or below the detection threshold in 50% to 80% of the samples. Similar to previous analyses [45], these metabolites were analyzed as ordinal variables after categorization into one of three mutually exclusive groups: 1) missing or below-the-detection-limit; 2) below the median of detectable values; or 3) greater than or equal to the median of detectable values. The remaining 1,035 metabolites were analyzed as continuous variables, where the minimum observed value was imputed for metabolites with missing or below-the-detection-limit values.
Measurement of study covariables
Covariable data were collected following stringent protocols that have been employed consistently at each clinical study visit [46]. Questionnaires were administered to obtain information on demographic characteristics (including age, gender, ethnicity, and education) and lifestyle risk factors (including cigarette smoking and alcohol consumption). Depression was assessed using the CES-D instrument [47], which has been validated previously and used extensively for research purposes [48,49]. Anthropometric measures were obtained by trained staff with participants in light clothing without shoes. During each visit, body weight and height were measured twice to the nearest 0.1 kg and 0.1 cm, respectively. The mean values of height and weight were used to estimate body mass index (BMI), which was calculated as weight in kilograms divided by height in square meters. Blood pressure (BP) was measured in the morning in triplicate by each of two trained observers using a mercury sphygmomanometer with the participant in a relaxed, sitting position. Systolic and diastolic BP levels were measured as the first and fifth Korotkoff sounds, respectively. The mean of the six BP values were used to estimate BP at each study visit.
Participants were instructed to fast for 12 hours prior to the blood sample collection. Serum total cholesterol (TC), high density lipoprotein cholesterol (HDL-C), and triglyceride (TG) levels were assayed using an enzymatic procedure as part of a lipid panel (Laboratory Corporation of America, Burlington, NC, USA) [50,51]. Low-density lipoprotein cholesterol (LDL-C) was calculated using the Friedewald equation (LDL-C = TC - HDL-C - TG/5) for those with TG less than 400 mg/dl [52]. Glucose was measured in adults using a multichemistry (SMA20) profile by enzymatic procedures using the multichannel Olympus Au-5000 Analyzer (Olympus, Lake Success, New York) [53].
Measurement of cognition phenotypes
Global cognitive function and specific cognitive domains were assessed during the 2013-2016 visit using a battery of eight standard tests (Supplementary Figure 1). Tests were conducted by trained technicians and included the following: 1) Logical Memory I (WMS-IV), assessing narrative memory under a free recall condition; 2) Logical Memory II (WMS-IV), assessing long-term narrative memory with free recall; 3) Recognition (WMS-IV), assessing long-term narrative memory with recognition tasks; 4) Digit Span (WAIS-IV), assessing attention, working memory and executive function via two tasks (Digit Span Forward and Digit Span Backward); 5) Word and Letter Reading (WRAT-4), assessing decoding capability; 6) Vocabulary (WAIS-IV), assessing word knowledge and verbal concept formation; 7) Digit Symbol Coding (WAIS-IV), assessing processing speed and working memory; and 8) Trail Making Test (TMT), assessing visual search, scanning, speed of processing, mental flexibility, and executive function via two tasks (TMT forms A and B). For all tests except for the TMT, higher scores reflect better cognitive function. For the TMT, the opposite is true, with lower scores indicating better cognitive function.
To estimate global cognition, crude scores from the eight tests were Z-score transformed to a mean of 0 and standard deviation of 1. After flipping the sign of the TMT test, scores were summed for each study participant.
To normalize the distributions of the cognitive function phenotypes, crude scores were normalized using a rank-based inverse normal transformation. The transformed values were then rescaled to reflect the original trait distribution (multiplying by the original standard deviation), which should provide meaningful effect estimates in association analyses [54].
Statistical analysis
Characteristics of study participants were presented as means and standard deviations (SDs) or median and interquartile range (IQRs) for continuous variables and as percentages for categorical variables.
Association of single metabolites with cognition phenotypes
Multiple linear regression models were used to analyze the associations between each metabolite and cognition phenotype after adjustment for age, gender, ethnicity, cigarette smoking, drinking, education, depression, vocabulary, BMI, systolic BP, LDL-C, and glucose. Analyses were performed in the overall sample and according to both ethnicity and sex. A stringent Bonferroni correction for testing 1,202 metabolites was employed, corresponding to an α-threshold of 4.16×10⁻⁵ (0.05/1202). To minimize false positive findings, only metabolites achieving this p-value in any of the overall or ethnicity-sex specific analyses, and displaying consistent effect directions across all analyses, were considered statistically significant. Pairwise correlations of identified metabolites were assessed using Pearson correlation. All statistical analyses were performed in SAS (version 9.4; SAS Institute, Cary, NC) and in R (version 3.3.3).
Associations of metabolite modules with cognition phenotype
To identify networks of highly correlated serum metabolites among BHS participants, weighted correlation network analysis (WGCNA) was utilized [55]. Unlike principal component analysis, this unsupervised data reduction technique allows for dependency between components, which may more accurately represent the related biological pathways of identified metabolites [55,56]. A description of WGCNA and its application to metabolomics studies has been reported previously [55,57]. Briefly, the metabolite network was constructed as an adjacency matrix based on the weighted pairwise-correlations of all metabolites [58]. Modules, defined as densely interconnected metabolites, were then identified from the network using an unsupervised hierarchical clustering approach [59]. For each module, an eigenmetabolite was generated. This measure represents the module’s first principal component and can be interpreted as its weighted average metabolite value. Because preliminary analyses revealed similar metabolite clustering across ethnic groups, metabolite modules were constructed using metabolite data for the 1,202 metabolites passing quality control among all study participants. To determine which biological pathways were best represented by each module, the metabolites most strongly correlated with each module’s eigenmetabolite (r>0.70) were identified, and the sub-pathways representing those metabolites were used to label each module.
Adjusted cognition phenotype measures were created using the residual values generated by regressing each raw cognition phenotype on age, gender, ethnicity, cigarette smoking, drinking, education, depression, vocabulary, BMI, SBP, LDL-C and glucose. The correlations between each module (eigenmetabolite) and the adjusted cognition phenotypes were then estimated in the overall sample and according to both ethnicity and sex. To correct for testing 9 serum metabolite modules (eigenmetabolites), a Bonferroni corrected α-threshold of 5.56×10⁻³ (0.05/9) was employed. Similar to the single metabolite study, modules achieving this p-value in any of the overall or ethnicity-sex specific analyses and demonstrating consistent effect directions across all analyses, were considered significant. These analyses were performed using the WGCNA package in R (version 3.3.3).
Author Contributions
M.S., T.N.K., L.A.B., J.H., and S.L. designed the study; M.S., X.G., C.L., K.Y., P.S., A.R.C., and X.M. analyzed the data; J.M.K. contributed to the logistics and optimization of the untargeted metabolomics; M.S. and T.N.K. drafted and revised the paper. All authors read and approved the manuscript.
Acknowledgements
We are grateful for the contribution of all staff members who were involved in conducting the Bogalusa Heart Study. We extend our gratitude to the participants of Bogalusa Heart Study, many of whom have diligently participated since they were children.
Conflicts of Interest
J.M.K. is employed by Metabolon, Inc. He contributed to the logistics, optimization, and interpretation of the untargeted metabolomics. Metabolon, Inc. was not involved in the study design, statistical analysis, or interpretation of the results.
Funding
This research was supported by the National Institute on Aging of the NIH under award numbers R01AG041200 and R21AG051914. Research reported in this publication was partially supported by the National Institute of General Medical Sciences of the NIH under award number P20GM109036.
References
- 1. Dorsey ER, Elbaz A, Nichols E, Abd-Allah F, Abdelalim A, Adsuar JC, Ansha MG, Brayne C, Choi JY, Collado-Mateo D, Dahodwala N, Do HP, Edessa D, et al, and GBD 2016 Parkinson’s Disease Collaborators. Global, regional, and national burden of Parkinson’s disease, 1990-2016: a systematic analysis for the Global Burden of Disease Study 2016. Lancet Neurol. 2018; 17:939–53. https://doi.org/10.1016/S1474-4422(18)30295-3 [PubMed]
- 2. Livingston G, Sommerlad A, Orgeta V, Costafreda SG, Huntley J, Ames D, Ballard C, Banerjee S, Burns A, Cohen-Mansfield J, Cooper C, Fox N, Gitlin LN, et al. Dementia prevention, intervention, and care. Lancet. 2017; 390:2673–734. https://doi.org/10.1016/S0140-6736(17)31363-6 [PubMed]
- 3. Hebert LE, Weuve J, Scherr PA, Evans DA. Alzheimer disease in the United States (2010-2050) estimated using the 2010 census. Neurology. 2013; 80:1778–83. https://doi.org/10.1212/WNL.0b013e31828726f5 [PubMed]
- 4. Matthews KA, Xu W, Gaglioti AH, Holt JB, Croft JB, Mack D, McGuire LC. Racial and ethnic estimates of Alzheimer’s disease and related dementias in the United States (2015-2060) in adults aged ≥65 years. Alzheimers Dement. 2019; 15:17–24. https://doi.org/10.1016/j.jalz.2018.06.3063 [PubMed]
- 5. Wilson RS, Leurgans SE, Boyle PA, Bennett DA. Cognitive decline in prodromal Alzheimer disease and mild cognitive impairment. Arch Neurol. 2011; 68:351–56. https://doi.org/10.1001/archneurol.2011.31 [PubMed]
- 6. Petersen RC, Doody R, Kurz A, Mohs RC, Morris JC, Rabins PV, Ritchie K, Rossor M, Thal L, Winblad B. Current concepts in mild cognitive impairment. Arch Neurol. 2001; 58:1985–92. https://doi.org/10.1001/archneur.58.12.1985 [PubMed]
- 7. Klavins K, Koal T, Dallmann G, Marksteiner J, Kemmler G, Humpel C. The ratio of phosphatidylcholines to lysophosphatidylcholines in plasma differentiates healthy controls from patients with Alzheimer’s disease and mild cognitive impairment. Alzheimers Dement (Amst). 2015; 1:295–302. https://doi.org/10.1016/j.dadm.2015.05.003 [PubMed]
- 8. Wang G, Zhou Y, Huang FJ, Tang HD, Xu XH, Liu JJ, Wang Y, Deng YL, Ren RJ, Xu W, Ma JF, Zhang YN, Zhao AH, et al. Plasma metabolite profiles of Alzheimer’s disease and mild cognitive impairment. J Proteome Res. 2014; 13:2649–58. https://doi.org/10.1021/pr5000895 [PubMed]
- 9. Mapstone M, Cheema AK, Fiandaca MS, Zhong X, Mhyre TR, MacArthur LH, Hall WJ, Fisher SG, Peterson DR, Haley JM, Nazar MD, Rich SA, Berlau DJ, et al. Plasma phospholipids identify antecedent memory impairment in older adults. Nat Med. 2014; 20:415–18. https://doi.org/10.1038/nm.3466 [PubMed]
- 10. Czech C, Berndt P, Busch K, Schmitz O, Wiemer J, Most V, Hampel H, Kastler J, Senn H. Metabolite profiling of Alzheimer’s disease cerebrospinal fluid. PLoS One. 2012; 7:e31501. https://doi.org/10.1371/journal.pone.0031501 [PubMed]
- 11. Han X, Rozen S, Boyle SH, Hellegers C, Cheng H, Burke JR, Welsh-Bohmer KA, Doraiswamy PM, Kaddurah-Daouk R. Metabolomics in early Alzheimer’s disease: identification of altered plasma sphingolipidome using shotgun lipidomics. PLoS One. 2011; 6:e21643. https://doi.org/10.1371/journal.pone.0021643 [PubMed]
- 12. Bressler J, Yu B, Mosley TH, Knopman DS, Gottesman RF, Alonso A, Sharrett AR, Wruck LM, Boerwinkle E. Metabolomics and cognition in African American adults in midlife: the atherosclerosis risk in communities study. Transl Psychiatry. 2017; 7:e1173. https://doi.org/10.1038/tp.2017.118 [PubMed]
- 13. Macdonald IA. A review of recent evidence relating to sugars, insulin resistance and diabetes. Eur J Nutr. 2016 (Suppl 2); 55:17–23. https://doi.org/10.1007/s00394-016-1340-8 [PubMed]
- 14. Young JM, Weser E. The metabolism of circulating maltose in man. J Clin Invest. 1971; 50:986–91. https://doi.org/10.1172/JCI106592 [PubMed]
- 15. Young EA, Weser E. The metabolism of maltose after intravenous injection in normal and diabetic subjects. J Clin Endocrinol Metab. 1974; 38:181–88. https://doi.org/10.1210/jcem-38-2-181 [PubMed]
- 16. Young JM, Weser E. Effect of insulin on the metabolism of circulating maltose. Endocrinology. 1970; 86:426–29. https://doi.org/10.1210/endo-86-2-426 [PubMed]
- 17. Yaffe K, Kanaya A, Lindquist K, Simonsick EM, Harris T, Shorr RI, Tylavsky FA, Newman AB. The metabolic syndrome, inflammation, and risk of cognitive decline. JAMA. 2004; 292:2237–42. https://doi.org/10.1001/jama.292.18.2237 [PubMed]
- 18. Yates KF, Sweat V, Yau PL, Turchiano MM, Convit A. Impact of metabolic syndrome on cognition and brain: a selected review of the literature. Arterioscler Thromb Vasc Biol. 2012; 32:2060–67. https://doi.org/10.1161/ATVBAHA.112.252759 [PubMed]
- 19. Erdmann K, Schaal NK, Meinlschmidt G, Tegethoff M, Fröhlich S, Kozlowski P, Rivet N, Jamey C, Reix N, Kintz P, Raul JS, Heil M. Sex specific relationships between infants’ mental rotation ability and amiotic sex hormones. Neurosci Lett. 2019; 707:e134298. https://doi.org/10.1016/j.neulet.2019.134298 [PubMed]
- 20. Hamson DK, Roes MM, Galea LA. Sex Hormones and Cognition: Neuroendocrine Influences on Memory and Learning. Compr Physiol. 2016; 6:1295–337. https://doi.org/10.1002/cphy.c150031 [PubMed]
- 21. Mouton A, Blanc F, Gros A, Manera V, Fabre R, Sauleau E, Gomez-Luporsi I, Tifratene K, Friedman L, Thümmler S, Pradier C, Robert PH, David R. Sex ratio in dementia with Lewy bodies balanced between Alzheimer’s disease and Parkinson’s disease dementia: a cross-sectional study. Alzheimers Res Ther. 2018; 10:92. https://doi.org/10.1186/s13195-018-0417-4 [PubMed]
- 22. Hampson E. Regulation of cognitive function by androgens and estrogens. Curr Opin Behav Sci. 2018; 23:49–57. https://doi.org/10.1016/j.cobeha.2018.03.002
- 23. Seiler N. Polyamine metabolism. Digestion. 1990 (Suppl 2); 46:319–30. https://doi.org/10.1159/000200405 [PubMed]
- 24. Grünblatt E, Riederer P. Aldehyde dehydrogenase (ALDH) in Alzheimer’s and Parkinson’s disease. J Neural Transm (Vienna). 2016; 123:83–90. https://doi.org/10.1007/s00702-014-1320-1 [PubMed]
- 25. Yu RL, Tan CH, Lu YC, Wu RM. Aldehyde dehydrogenase 2 is associated with cognitive functions in patients with Parkinson’s disease. Sci Rep. 2016; 6:30424. https://doi.org/10.1038/srep30424 [PubMed]
- 26. Crabb DW, Matsumoto M, Chang D, You M. Overview of the role of alcohol dehydrogenase and aldehyde dehydrogenase and their variants in the genesis of alcohol-related pathology. Proc Nutr Soc. 2004; 63:49–63. https://doi.org/10.1079/PNS2003327 [PubMed]
- 27. Fitzgerald BL, Mahapatra S, Farmer DK, McNeil MR, Casero RA
Jr , Belisle JT. Elucidating the Structure of N1-Acetylisoputreanine: A Novel Polyamine Catabolite in Human Urine. ACS Omega. 2017; 2:3921–30. https://doi.org/10.1021/acsomega.7b00872 [PubMed] - 28. Gomes GM, Dalmolin GD, Bär J, Karpova A, Mello CF, Kreutz MR, Rubin MA. Inhibition of the polyamine system counteracts β-amyloid peptide-induced memory impairment in mice: involvement of extrasynaptic NMDA receptors. PLoS One. 2014; 9:e99184. https://doi.org/10.1371/journal.pone.0099184 [PubMed]
- 29. Pegg AE, McCann PP. Polyamine metabolism and function. Am J Physiol. 1982; 243:C212–21. https://doi.org/10.1152/ajpcell.1982.243.5.C212 [PubMed]
- 30. Graham SF, Chevallier OP, Elliott CT, Hölscher C, Johnston J, McGuinness B, Kehoe PG, Passmore AP, Green BD. Untargeted metabolomic analysis of human plasma indicates differentially affected polyamine and L-arginine metabolism in mild cognitive impairment subjects converting to Alzheimer’s disease. PLoS One. 2015; 10:e0119452. https://doi.org/10.1371/journal.pone.0119452 [PubMed]
- 31. Calonghi N, Cappadone C, Pagnotta E, Boga C, Bertucci C, Fiori J, Tasco G, Casadio R, Masotti L. Histone deacetylase 1: a target of 9-hydroxystearic acid in the inhibition of cell growth in human colon cancer. J Lipid Res. 2005; 46:1596–603. https://doi.org/10.1194/jlr.M400424-JLR200 [PubMed]
- 32. Boanini E, Torricelli P, Boga C, Micheletti G, Cassani MC, Fini M, Bigi A. (9R)-9-Hydroxystearate-Functionalized Hydroxyapatite as Antiproliferative and Cytotoxic Agent toward Osteosarcoma Cells. Langmuir. 2016; 32:188–94. https://doi.org/10.1021/acs.langmuir.5b03754 [PubMed]
- 33. Schmauss C. The roles of class I histone deacetylases (HDACs) in memory, learning, and executive cognitive functions: A review. Neurosci Biobehav Rev. 2017; 83:63–71. https://doi.org/10.1016/j.neubiorev.2017.10.004 [PubMed]
- 34. Sharma S, Taliyan R. Transcriptional dysregulation in Huntington’s disease: the role of histone deacetylases. Pharmacol Res. 2015; 100:157–69. https://doi.org/10.1016/j.phrs.2015.08.002 [PubMed]
- 35. Valor LM. Understanding histone deacetylation in Huntington’s disease. Oncotarget. 2017; 8:5660–61. https://doi.org/10.18632/oncotarget.13924 [PubMed]
- 36. Mustonen R, Hemminki K. 7-Methylguanine levels in DNA of smokers’ and non-smokers’ total white blood cells, granulocytes and lymphocytes. Carcinogenesis. 1992; 13:1951–55. https://doi.org/10.1093/carcin/13.11.1951 [PubMed]
- 37. Kalmijn S, van Boxtel MP, Verschuren MW, Jolles J, Launer LJ. Cigarette smoking and alcohol consumption in relation to cognitive performance in middle age. Am J Epidemiol. 2002; 156:936–44. https://doi.org/10.1093/aje/kwf135 [PubMed]
- 38. Mustonen R, Schoket B, Hemminki K. Smoking-related DNA adducts: 32P-postlabeling analysis of 7-methylguanine in human bronchial and lymphocyte DNA. Carcinogenesis. 1993; 14:151–54. https://doi.org/10.1093/carcin/14.1.151 [PubMed]
- 39. Richards M, Jarvis MJ, Thompson N, Wadsworth ME. Cigarette smoking and cognitive decline in midlife: evidence from a prospective birth cohort study. Am J Public Health. 2003; 93:994–98. https://doi.org/10.2105/AJPH.93.6.994 [PubMed]
- 40. Chiang JY. Bile acid metabolism and signaling. Compr Physiol. 2013; 3:1191–212. https://doi.org/10.1002/cphy.c120023 [PubMed]
- 41. Keene CD, Rodrigues CM, Eich T, Linehan-Stieers C, Abt A, Kren BT, Steer CJ, Low WC. A bile acid protects against motor and cognitive deficits and reduces striatal degeneration in the 3-nitropropionic acid model of Huntington’s disease. Exp Neurol. 2001; 171:351–60. https://doi.org/10.1006/exnr.2001.7755 [PubMed]
- 42. Nunes AF, Amaral JD, Lo AC, Fonseca MB, Viana RJ, Callaerts-Vegh Z, D’Hooge R, Rodrigues CM. TUDCA, a bile acid, attenuates amyloid precursor protein processing and amyloid-β deposition in APP/PS1 mice. Mol Neurobiol. 2012; 45:440–54. https://doi.org/10.1007/s12035-012-8256-y [PubMed]
- 43. MahmoudianDehkordi S, Arnold M, Nho K, Ahmad S, Jia W, Xie G, Louie G, Kueider-Paisley A, Moseley MA, Thompson JW, St John Williams L, Tenenbaum JD, Blach C, et al, and Alzheimer’s Disease Neuroimaging Initiative and the Alzheimer Disease Metabolomics Consortium. Altered bile acid profile associates with cognitive impairment in Alzheimer’s disease-An emerging role for gut microbiome. Alzheimers Dement. 2019; 15:76–92. https://doi.org/10.1016/j.jalz.2018.07.217 [PubMed]
- 44. Evans AM, DeHaven CD, Barrett T, Mitchell M, Milgram E. Integrated, nontargeted ultrahigh performance liquid chromatography/electrospray ionization tandem mass spectrometry platform for the identification and relative quantification of the small-molecule complement of biological systems. Anal Chem. 2009; 81:6656–67. https://doi.org/10.1021/ac901536h [PubMed]
- 45. Zheng Y, Yu B, Alexander D, Mosley TH, Heiss G, Nettleton JA, Boerwinkle E. Metabolomics and incident hypertension among blacks: the atherosclerosis risk in communities study. Hypertension. 2013; 62:398–403. https://doi.org/10.1161/HYPERTENSIONAHA.113.01166 [PubMed]
- 46. Foster TA, Berenson GS. Measurement error and reliability in four pediatric cross-sectional surveys of cardiovascular disease risk factor variables--the Bogalusa Heart Study. J Chronic Dis. 1987; 40:13–21. https://doi.org/10.1016/0021-9681(87)90092-0 [PubMed]
- 47. Lewinsohn PM, Seeley JR, Roberts RE, Allen NB. Center for Epidemiologic Studies Depression Scale (CES-D) as a screening instrument for depression among community-residing older adults. Psychol Aging. 1997; 12:277–87. https://doi.org/10.1037/0882-7974.12.2.277 [PubMed]
- 48. Herniman SE, Allott KA, Killackey E, Hester R, Cotton SM. The psychometric validity of the Center for Epidemiological Studies - Depression Scale (CES-D) in first episode schizophrenia spectrum. Psychiatry Res. 2017; 252:16–22. https://doi.org/10.1016/j.psychres.2017.02.023 [PubMed]
- 49. Umegaki Y, Todo N. Psychometric properties of the Japanese CES-D, SDS, and PHQ-9 depression scales in university students. Psychol Assess. 2017; 29:354–59. https://doi.org/10.1037/pas0000351 [PubMed]
- 50. Allain CC, Poon LS, Chan CS, Richmond W, Fu PC. Enzymatic determination of total serum cholesterol. Clin Chem. 1974; 20:470–75. [PubMed]
- 51. Bucolo G, David H. Quantitative determination of serum triglycerides by the use of enzymes. Clin Chem. 1973; 19:476–82. [PubMed]
- 52. Friedewald WT, Levy RI, Fredrickson DS. Estimation of the concentration of low-density lipoprotein cholesterol in plasma, without use of the preparative ultracentrifuge. Clin Chem. 1972; 18:499–502. [PubMed]
- 53. Kelly TN, Bazzano LA, Ajami NJ, He H, Zhao J, Petrosino JF, Correa A, He J. Gut Microbiome Associates With Lifetime Cardiovascular Disease Risk Profile Among Bogalusa Heart Study Participants. Circ Res. 2016; 119:956–64. https://doi.org/10.1161/CIRCRESAHA.116.309219 [PubMed]
- 54. Tang ZZ, Lin DY. Meta-analysis for Discovering Rare-Variant Associations: Statistical Methods and Software Programs. Am J Hum Genet. 2015; 97:35–53. https://doi.org/10.1016/j.ajhg.2015.05.001 [PubMed]
- 55. Langfelder P, Horvath S. WGCNA: an R package for weighted correlation network analysis. BMC Bioinformatics. 2008; 9:559. https://doi.org/10.1186/1471-2105-9-559 [PubMed]
- 56. Worley B, Powers R. Multivariate Analysis in Metabolomics. Curr Metabolomics. 2013; 1:92–107. https://doi.org/10.2174/2213235X11301010092 [PubMed]
- 57. Pedersen HK, Gudmundsdottir V, Nielsen HB, Hyotylainen T, Nielsen T, Jensen BA, Forslund K, Hildebrand F, Prifti E, Falony G, Le Chatelier E, Levenez F, Doré J, et al, and MetaHIT Consortium. Human gut microbes impact host serum metabolome and insulin sensitivity. Nature. 2016; 535:376–81. https://doi.org/10.1038/nature18646 [PubMed]
- 58. Yip AM, Horvath S. Gene network interconnectedness and the generalized topological overlap measure. BMC Bioinformatics. 2007; 8:22. https://doi.org/10.1186/1471-2105-8-22 [PubMed]
- 59. Langfelder P, Zhang B, Horvath S. Defining clusters from a hierarchical cluster tree: the Dynamic Tree Cut package for R. Bioinformatics. 2008; 24:719–20. https://doi.org/10.1093/bioinformatics/btm563 [PubMed]