Submit an Article
Navigate
Home
Editorial Board
Editorial Policies
Current Volume
Archive
Scientific Integrity
Publication Ethics Statements
Interviews with Outstanding Authors
Newsroom
Sponsored Conferences
Podcast
Contact
Special Collections
Submit an Article
Online ISSN: 1945-4589
Research Paper
|
Volume 11, Issue 14
|
pp. 5124–5139
Novel serum metabolites associate with cognition phenotypes among Bogalusa Heart Study participants
Back to article
Figure 5
(7 of 7)
−
100%
+
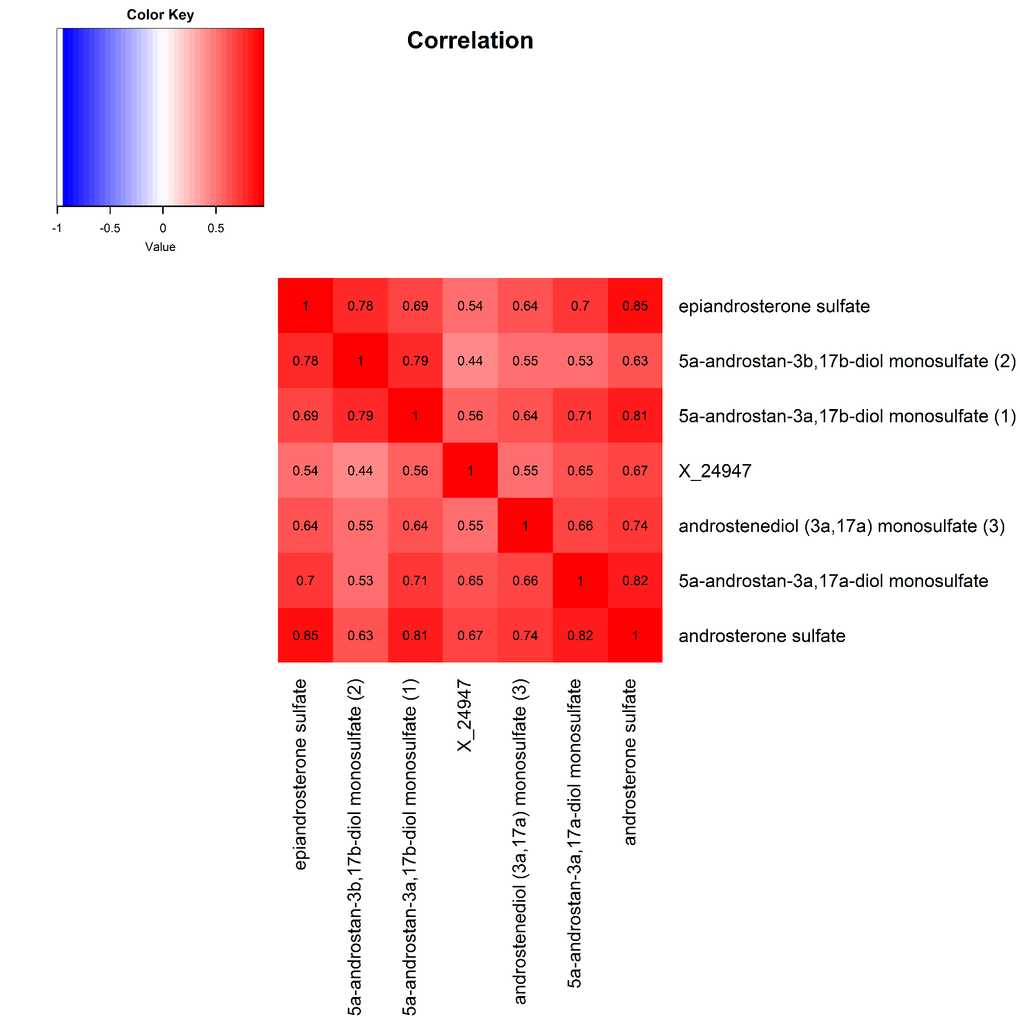
Figure 5.
Heat map displaying pairwise correlation coefficients for the network of metabolites representing the significant androgenic steroids pathway.