


Introduction
Prostate cancer (PCa) is the second most frequent cancer and the fifth leading cause of death in males worldwide [1]. Nowadays, prostate specific antigen (PSA) is the only circulating biomarker routinely used for early diagnosis of PCa [2]. However, PSA screening has some limitations. In some cases, prostatitis and benign prostatic hyperplasia (BPH), which frequently affect men, can also result in increments of serum PSA [3]. In addition, since the optimal PSA expression threshold for clinical samples has not been determined [4], routine PSA screening sometimes leads to over-diagnosis and over-treatment of indolent PCa [5, 6]. In the past decade, a growing number of microarray and next-generation sequencing technologies have been used to explore novel biomarkers and therapeutic targets for PCa [7]. However, small sample sizes in individual studies and use of different technological platforms create substantial inter-study variability and difficult statistical analyses. To solve this problem, integrated bioinformatics methods such as Robust Rank Aggregation (RRA) have been utilized in various cancer studies [8–10].
In the present study, 10 microarray datasets from Gene Expression Omnibus (GEO, http://www.ncbi.nlm.nih.gov/geo/) were analyzed with RRA to identify robust and stable differentially expressed genes (DEGs) between PCa tissues and matched controls [11]. These DEGs were then adopted to find key modules associated with clinical features through weighted gene co-expression network analysis (WGCNA). Gene Ontology (GO) and Kyoto Encyclopedia of Genes and Genomes (KEGG) analyses were further conducted to assess potential functions of the genes within the key module. Four seldomly reported hub genes, LMNB1, TK1, and RACGAP1, and ZWINT, were selected to validate their diagnostic and prognostic value for PCa. In addition, two online tools, DiseaseMeth 2.0 and MEXPRESS, were used to assess the methylation status of those four hub genes, while Tumor Immune Estimation Resource (TIMER), Gene Set Enrichment Analysis (GSEA), and Gene Set Variation Analysis (GSVA) were utilized to investigate potential biological functions.
Results
Identification of robust DEGs by the RRA method
Figure 1 shows the workflow for identification, validation, and functional analysis of DEGs. In accordance with the selection criteria, 10 eligible PCa datasets were included and used in the subsequent RRA analysis. Main characteristics of datasets, such as GEO accession ID, study country, sample information, platform ID, and number of genes for each platform, are shown in Table 1. Based on the results of RRA analysis, a total of 808 up-regulated and 930 down-regulated significant DEGs were identified (Supplementary file 1). OR51E2 was the most significant up-regulated gene (P = 4.93E-23, adjusted P = 1.94E-18), followed by GDF15 (P = 9.01E-20, adjusted P = 3.55E-15). Meanwhile, KRT15 (P = 9.07E-22, adjusted P = 3.57E-17) and CCK (P = 6.59E-20, adjusted P = 2.60E-15) were the most significant down-regulated genes in PCa samples. The top 20 up-regulated and down-regulated DEGs are shown in heatmap (Figure 2).
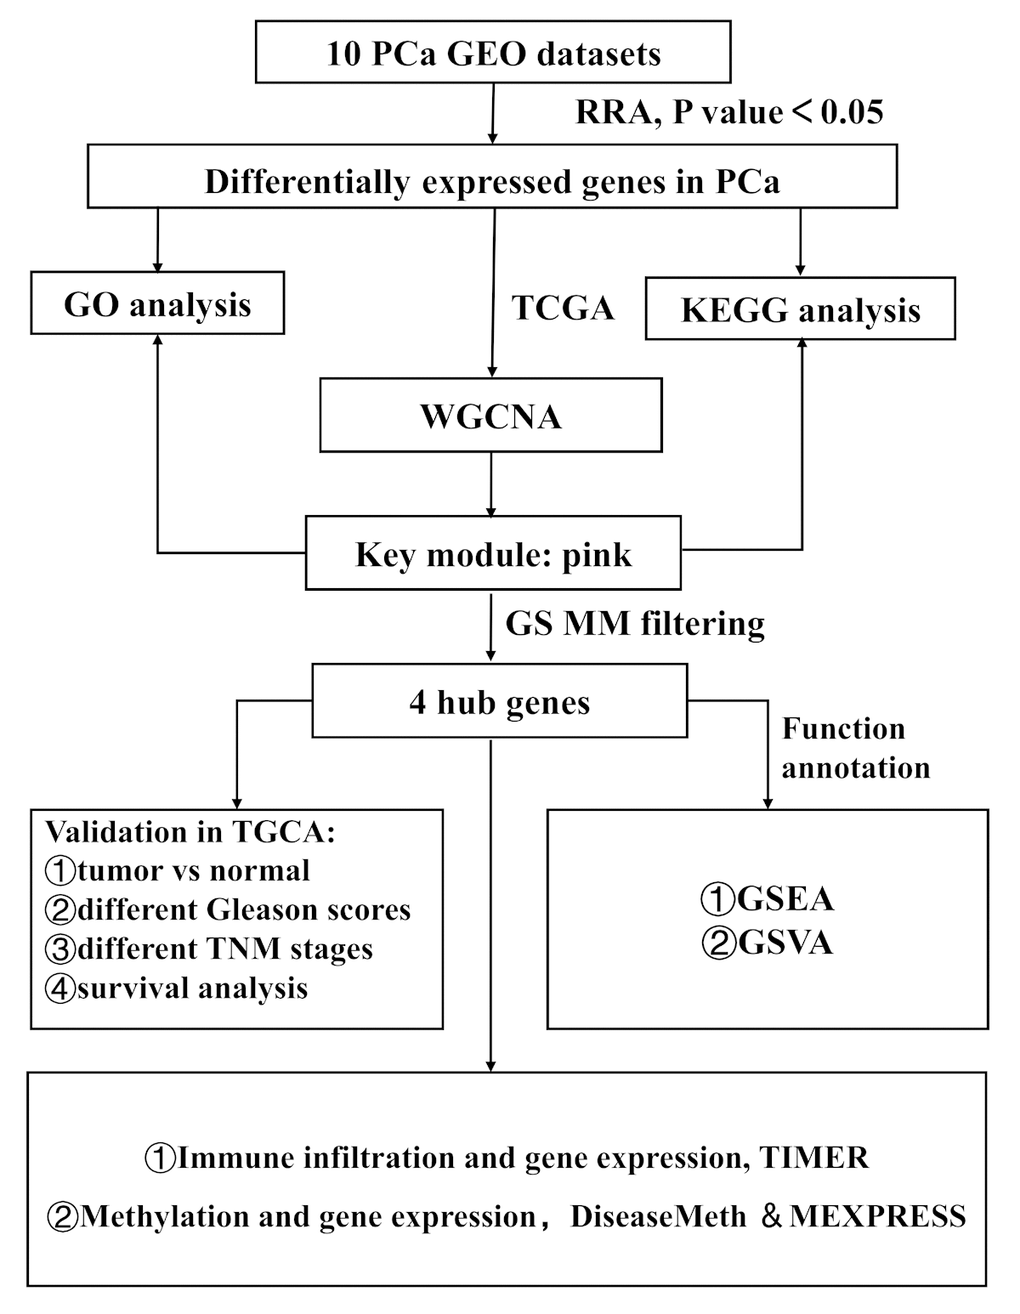
Figure 1. Study workflow. GEO, Gene Expression Omnibus; TCGA, The Cancer Genome Atlas; GO, Gene Ontology; KEGG, Kyoto Encyclopedia of Genes and Genomes; WGCNA, Weighted Gene Co-expression Network Analysis; GS, gene significance; MM, module membership; TNM, Tumor Node Metastasis; GSEA, Gene Set Enrichment Analysis; GSVA, Gene Set Variation Analysis.
Table 1. Characteristics of the included datasets.
| Dataset ID | Country | Number of samples | GPL ID | Number of rows per platform | |||||||||||||||||||||||||||||||||||||||||||||||||||||||||||||||||||||||||||||||||||||||||||||||
| GSE6919 | USA | 65T 63N | GPL8300 | 12625 | |||||||||||||||||||||||||||||||||||||||||||||||||||||||||||||||||||||||||||||||||||||||||||||||
| GSE6956 | USA | 69T 18N | GPL571 | 22277 | |||||||||||||||||||||||||||||||||||||||||||||||||||||||||||||||||||||||||||||||||||||||||||||||
| GSE32448 | USA | 40T 40N | GPL570 | 54675 | |||||||||||||||||||||||||||||||||||||||||||||||||||||||||||||||||||||||||||||||||||||||||||||||
| GSE32571 | Germany | 59T 39N | GPL6947 | 48652 | |||||||||||||||||||||||||||||||||||||||||||||||||||||||||||||||||||||||||||||||||||||||||||||||
| GSE35988 | USA | 59T 28N | GPL6480 | 41008 | |||||||||||||||||||||||||||||||||||||||||||||||||||||||||||||||||||||||||||||||||||||||||||||||
| GSE46602 | Denmark | 36T 14N | GPL570 | 54675 | |||||||||||||||||||||||||||||||||||||||||||||||||||||||||||||||||||||||||||||||||||||||||||||||
| GSE68555 | USA | 64T 63N | GPL8300 | 12558 | |||||||||||||||||||||||||||||||||||||||||||||||||||||||||||||||||||||||||||||||||||||||||||||||
| GSE69223 | Germany | 15T 15N | GPL570 | 54675 | |||||||||||||||||||||||||||||||||||||||||||||||||||||||||||||||||||||||||||||||||||||||||||||||
| GSE70768 | UK | 113T 73N | GPL10558 | 48107 | |||||||||||||||||||||||||||||||||||||||||||||||||||||||||||||||||||||||||||||||||||||||||||||||
| GSE88808 | USA | 49T 49N | GPL22571 | 20261 | |||||||||||||||||||||||||||||||||||||||||||||||||||||||||||||||||||||||||||||||||||||||||||||||
| Note: GSE, Gene Expression Omnibus Series; GPL, Gene Expression Omnibus Platform; T, tumor samples; N, paracancerous normal samples. | |||||||||||||||||||||||||||||||||||||||||||||||||||||||||||||||||||||||||||||||||||||||||||||||||||
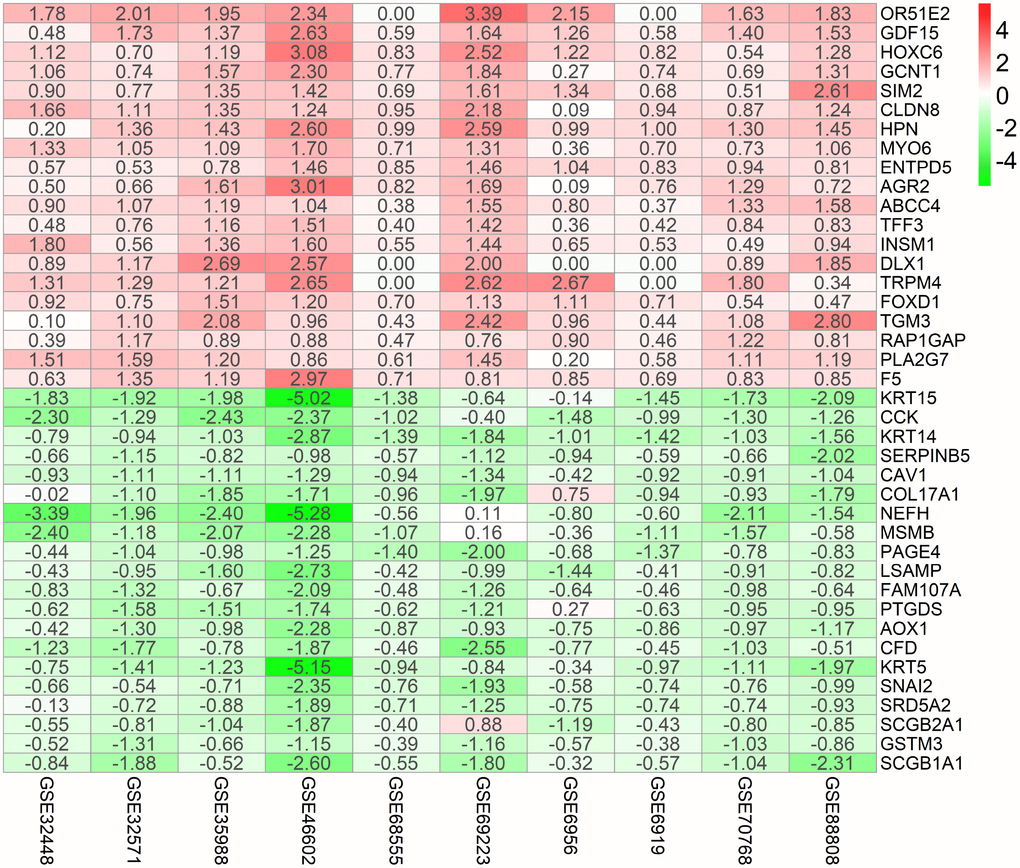
Figure 2. Identification of robust DEGs by RRA analysis. Heatmap showing the top 20 up-regulated genes and top 20 down-regulated genes according to P value. Each row represents one gene and each column indicates one dataset. Red indicates up-regulation and blue represents down-regulation. The numbers in the heatmap indicate logarithmic fold change in each dataset calculated by the “limma” R package. DEG, differentially expressed gene; GEO: Gene Expression Omnibus; RRA: robust rank aggregation.
Visualization of gene expression patterns and chromosome locations
We selected the top 100 DEGs from RRA analysis to visualize their expression patterns across the 10 datasets included in this study, as well as their chromosomal locations (Figure 3). Chromosome 3 contained most DEGs. These DEGs were distributed in all chromosomes except for chromosome Y, which showed no alterations. The top 5 upregulated genes according to adjusted P, i.e. OR51E2, GDF15, HOXC6, GCNT1, SIM2, were distributed in chromosomes 11, 19, 12, 9, and 21. The top 5 downregulated genes (KRT15, CCK, KRT14, SERPINB5, and CAV1) were located in chromosomes 17, 3, 17, 18, and 7.
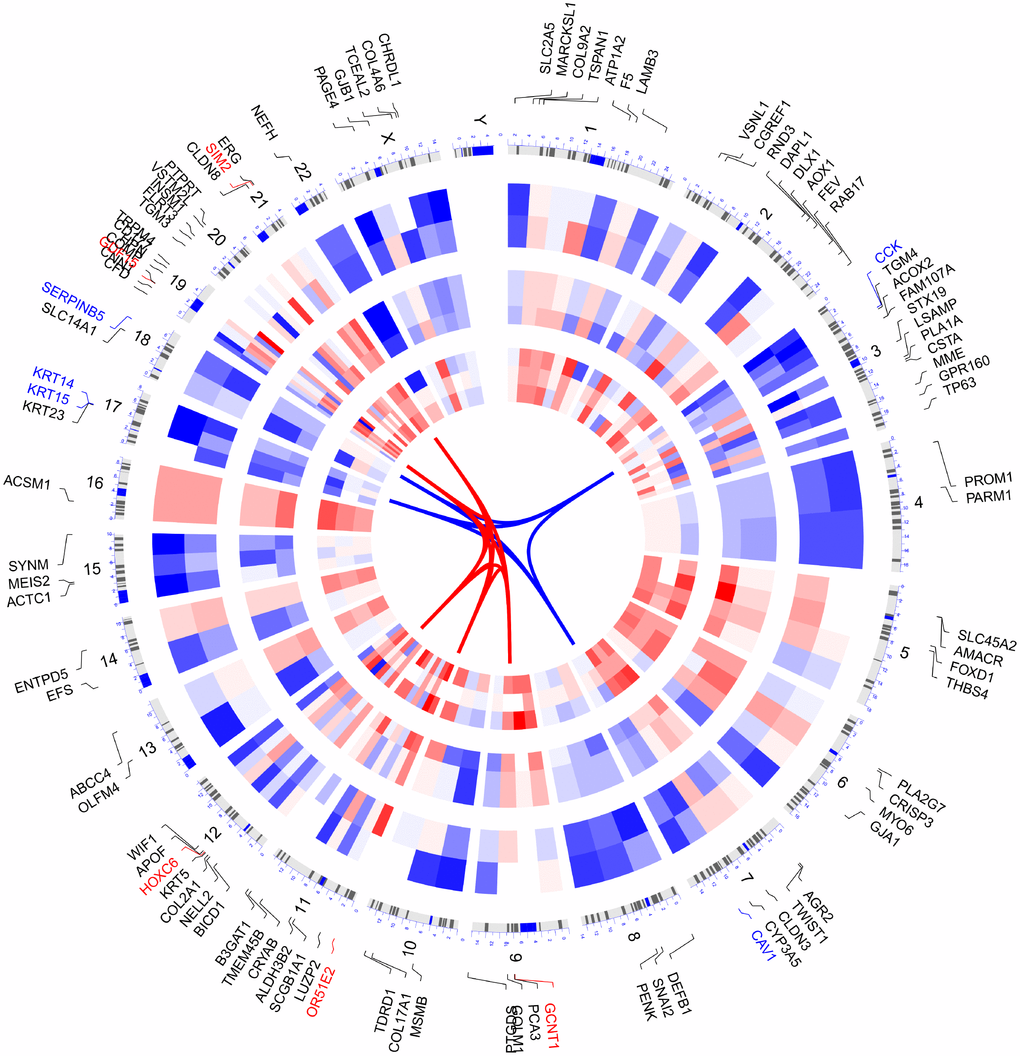
Figure 3. Circular visualization of connectivity, expression patterns, and chromosomal positions of top 100 DEGs. The 10 PCa microarray datasets from GEO are represented in the inner circular heatmaps. Red indicates gene up-regulation, blue represents downregulation, and white denotes genes not present in a given dataset. The outer circle represents chromosomes; lines coming from each gene point to their specific chromosomal locations. The top 5 up-regulated and down-regulated genes according to adjusted P are shown in red and blue and connected with red and blue lines in the center of circles.
Functional enrichment analysis of DEGs
The top 300 DEGs were chosen to perform GO and KEGG analyses. We detected enrichment in several biological process GO terms such as cell junction organization, regulation of blood vessel diameter, extracellular structure organization, response to hypoxia, and epithelial to mesenchymal transition (Figure 4A). In terms of cellular component, extracellular matrix was the most significantly enriched GO term (Figure 4B). What’s more, some molecular component GO terms, such as glutathione binding, extracellular matrix structural constituent, were enriched (Figure 4C). As to KEGG pathway analysis, drug metabolism-cytochrome P450, protein digestion and absorption, glutathione metabolism, focal adhesion, and ECM-receptor interaction, were mostly associated with these genes (Figure 4D).

Figure 4. GO and KEGG analysis of top 300 DEGs. (A) Chord plot depicting the relationship between genes and GO terms of biological process. (B) Chord plot depicting the relationship between genes and GO terms of cellular component. (C) Chord plot depicting the relationship between genes and GO terms of molecular function. (D) Chord plot indicates the relationship between genes and KEGG pathways. GO, Gene Ontology; KEGG, Kyoto Encyclopedia of Genes and Genomes.
WGCNA and identification of the key module
To find the key modules most associated with PCa clinical traits, we performed WGCNA on the TCGA-PRAD dataset incorporating the DEGs derived from the RRA analysis (Figure 5). Clinical PCa sample information such as age, Gleason score, biochemical recurrence, and TNM grades was retrieved from TCGA (Figure 5A). By setting soft-thresholding power as 6 (scale free R2 = 0.85) and cut height as 0.25, we eventually identified 15 modules (Figure 5B–5D; non-clustering DEGs shown in gray). From the heatmap of module–trait correlations, we identified that the pink module was the most highly correlated with clinical traits (Figure 5E), especially the Gleason score (correlation coefficient = 0.45, P = 3E-26; Figure 5F). The pink module contained a total of 120 genes, shown in Figure 6A. By setting module membership (MM) >0.8 and gene significance (GS) >0.3, we selected 20 hub genes from the pink module: RRM2, KIFC1, TACC3, PRC1, BIRC5, CDK1, ASF1B, E2F1, RACGAP1, MYBL2, TPX2, CDC20, TOP2A, NUSAP1, UBE2T, LMNB1, CCNB1, ZWINT, STMN1, and TK1. These genes, as shown in Figure 6B, were also closely related to each other. To reveal potential biological functions of the genes within the pink module, we conducted GO and KEGG analyses. The most significant GO terms for biological process, cellular component, and molecular function, as well as KEGG pathways, were shown in Figure 6C–6F. This analysis indicated that genes within the pink module were mainly involved in DNA replication and nuclear division.

Figure 5. Identification of key modules correlated with clinical traits in the TCGA-PRAD dataset through WGCNA. (A) Clustering dendrograms of genes. The clustering was based on the TCGA-PRAD RNA-seq data of robust DEGs from RRA analysis. Color intensity varies positively with age, Gleason score, and pathological stage. In terms of biochemical recurrence, red means recurrence and white indicates no recurrence. (B) Analysis of the scale-free fit index (left) and the mean connectivity (right) for various soft-thresholding powers. (C) Clustering of module eigengenes. The red line indicates cut height (0.25). (D) Dendrogram of all DEGs clustered based on a dissimilarity measure (1-TOM). (E) Heatmap of the correlation between module eigengenes and clinical traits of PCa. Each cell contains the correlation coefficient and P value. (F) Distribution of average gene significance and errors in the modules associated with Gleason score of PCa.

Figure 6. Identification of hub genes and functional annotation of the WGCNA module highly correlated with clinical traits. (A) Scatter plot of module eigengenes in the pink module. (B) Hub genes show strong associations with each other. (C) Biological process GO terms for genes in the pink module. (D) Cellular component GO terms for genes in the pink module. (E) Molecular function GO terms for genes in the pink module. (F) KEGG analysis for genes in the pink module. GO, Gene Ontology; KEGG, Kyoto Encyclopedia of Genes and Genomes.
Validation of hub genes in the TCGA-PRAD dataset.
Among the 20 hub genes screened above, we selected four (TK1, RACGAP1, LMNB1, and ZWINT), seldomly reported before in PCa, to validate their diagnostic and prognostic value and their correlations with clinical features. It was noted that all of them were significantly up-regulated (P < 0.001) in PCa samples compared with adjacent, normal controls (Figure 7A). Furthermore, ROC curves showed their high diagnostic value as biomarkers for PCa (Supplementary Figure 1; TK1 AUC: 0.831, LMNB1 AUC: 0.786, ZWINT AUC: 0.759, RACGAP1 AUC: 0.699). In addition, LMNB1, TK1, RACGAP1, and ZWINT were significantly differentially expressed in PCa samples with different Gleason scores, T grades, and N grades, with higher expression levels indicating higher Gleason score, advanced T grades, and lymph node metastasis (Figure 7B–7D). Regarding prognosis, Kaplan-Meier curves showed that higher expression of these genes correlated significantly with poor disease-free survival (Figure 7E). Notably, all 20 hub genes in the pink module had good prognostic values (Supplementary Figure 2).

Figure 7. Validation of hub genes in the TCGA-PRAD dataset. (A) LMNB1, TK1, RACGAP1, and ZWINT gene expression differences between PCa and adjacent normal tissues. (B) Expression of LMNB1, TK1, RACGAP1, and ZWINT in PCa samples with different Gleason scores. (C) Expression of LMNB1, TK1, RACGAP1, and ZWINT in PCa samples with different T stages. (D) Expression of LMNB1, TK1, RACGAP1, and ZWINT in PCa samples with different N stages. (E) Association between LMNB1, TK1, RACGAP1, and ZWINT expression and disease-free survival time in the TCGA-PRAD dataset. The yellow line indicates samples with highly expressed genes (above best-separation value), and the green line designates the samples with lowly expressed genes (below best-separation value). T, Tumor; N, Node.
Association between methylation and expression of hub genes
We explored the association between these four hub genes’ expression levels and their methylation status to elucidate potential mechanisms of abnormal up-regulation in PCa tissues. DiseaseMeth version 2.0 analysis showed that the mean methylation levels of LMNB1, TK1, RACGAP1, and ZWINT were all significantly lower in PCa compared with paracancerous normal tissues (Figure 8A–8D). Additionally, we found many methylation sites in the DNA sequences of LMNB1, TK1, RACGAP1, and ZWINT that were negatively associated with their expression levels using MEXPRESS (Supplementary Figure 3).

Figure 8. Methylation analyses of PCa hub genes. The methylation levels of (A) LMNB1, (B) ZWINT, (C) RACGAP1, and (D) TK1 in PCa and peri-tumoral normal tissues were examined using DiseaseMeth 2.0.
Association of hub genes’ expression with tumor purity and immune infiltration
The tumor microenvironment consists of tumor cells, stromal cells, and infiltrating immune cells. We utilized TIMER to explore potential associations between the expression of PCa hub genes and both tumor purity and infiltration of immune cells. Interestingly, LMNB1, RACGAP1, TK1, and ZWINT were all positively associated with tumor purity. Conversely, no or weak associations were observed between these four genes and infiltration of B cells, CD4+ T cells, CD8+ T cells, neutrophils, macrophages, and dendritic cells (Figure 9A–9D).

Figure 9. Association of hub genes’ expression with immune infiltration in PCa. (A) LMNB. (B) RACGAP1. (C) TK1. (D) ZWINT. P<0.05 denotes significance. Each dot represents a sample in the TCGA-PRAD dataset.
GSEA and GSVA reveal a close relationship between hub genes and tumor proliferation
To further investigate the potential functions of LMNB1, RACGAP1, TK1, and ZWINT in PCa, we performed GSEA and GSVA on the TCGA-PRAD RNA-seq data. As shown in Figure 10A–10D, genes in high expression groups of LMNB1, RACGAP1, TK1, and ZWINT were all enriched in “Homologous recombination” and “Mismatch repair” pathways. Meanwhile, the “cell cycle” gene set was enriched in high-expression groups of LMNB1 and RACGAP1, whereas “pentose and glucuronate interconversions” and “DNA replication” were enriched in the TK1 and ZWINT high-expression groups, respectively. These gene sets with the highest enrichment scores were all closely associated with tumor proliferation. Furthermore, GSVA confirmed that these gene sets were significantly up-regulated in the high-expression groups of LMNB1, RACGAP1, TK1, and ZWINT, further suggesting their relationship with activation of proliferative processes (Figure 10E–10H).

Figure 10. Gene set enrichment analysis (GSEA) and gene set variation analysis (GSVA) of hub genes in the TCGA-PRAD dataset. (A–D) Top 3 gene sets (according to GSEA enrichment score) enriched in the high-expression group of single hub genes. (A) LMNB1; (B) TK1; (C) ZWINT; (D) RACGAP1. (E–H) GSVA-derived clustering heatmaps of differentially expressed pathways for single hub genes. (E) LMNB1; (F) TK1; (G) ZWINT; (H) RACGAP1. Only signaling pathways with log(foldchange) > 0.2 are shown.
Discussion
The pathogenesis of PCa, a complex and heterogeneous disease, remains unclear. Although numerous investigations using microarray and RNA-seq were conducted to discover novel biomarkers and therapeutic targets for PCa, inconsistencies were seen between the DEGs found in different studies [7]. To our knowledge, our work is the first to use RRA combined with WGCNA to explore novel hub genes associated with PCa. A recent study compared gene expression profiles between PCa and control samples (either para-tumoral, normal matched tissue, or normal prostate tissue from donors) for each dataset, and integrated microarray data to obtain DEGs using the RankProd method [9]. However, Chandran et al. discovered marked differences in gene expression profiles between normal prostate samples from donors and tumor-adjacent normal tissues from PCa patients [12]. To minimize variability, we only enrolled datasets containing tumor and adjacent normal samples. We integrated 10 qualified PCa datasets from GEO into the RRA method and identified many robust DEGs, some of which, such as OR51E2 [13] and GDF15 [14], have been reported to be biomarkers of PCa or play a vital role in its pathogenesis. Chromosome mapping of the top 100 DEGs showed chromosomes 3 contained most DEGs. A study reported that the androgen-driven TMPRSS2-ERG fusion was associated with deletion at chromosome 3p14, which is specific to prostate cancer [15]. Moreover, 3p13 deletion defines a subgroup of ERG+ prostate cancers characterized by aggressive clinical features and tumor recurrence [16]. All evidence suggest chromosome 3 harbor some key genes capable of influencing the pathogenesis of PCa.
Consistent with published data, the enrichment of these DEGs in several GO terms, such as cell junction organization, glutathione binding, extracellular matrix, response to hypoxia, and epithelial to mesenchymal transition, confirms their involvement in the development of PCa [17–20]. In addition, enrichment of the identified DEGs in some KEGG pathways, such as drug metabolism-cytochrome P450 and glutathione metabolism also suggests their relevance in PCa pathogenesis. Cytochrome P450 17A1 catalyzes the biosynthesis of androgens in humans [21]. Glutathione, the most abundant antioxidant in humans, plays a pivotal role in the development of cancer and drug resistance [22], and many enzymes involved in glutathione metabolism have been reported to influence the proliferation and metastasis of PCa [23, 24]. Based on the results of GO and KEGG analyses, we suggest that these DEGs are closely associated with dysregulated androgen signaling and PCa development.
Co-expression network construction and identification of hub genes through WGCNA showed that genes within the co-expression module most correlated with clinical traits of PCa samples in TCGA (pink module) were also enriched in DNA replication and nuclear division pathways through GO and KEGG analyses. After filtering for GS and MM value, we eventually obtained 20 hub genes (RRM2, KIFC1, TACC3, PRC1, BIRC5, CDK1, ASF1B, E2F1, RACGAP1, MYBL2, TPX2, CDC20, TOP2A, NUSAP1, UBE2T, LMNB1, CCNB1, ZWINT, STMN1, and TK1). A majority of them were demonstrated to exert essential roles in the pathogenesis of PCa [25–27]. Among these hub genes, we chose four seldomly reported in PCa, namely TK1, RACGAP1, ZWINT, and LMNB1, to explore their diagnostic and prognostic value. Thymidine kinase 1 (TK1), a cell cycle-dependent protein, has been extensively reported as a tumor biomarker [28], but its role in PCa remained unclear. RACGAP1 encodes a GTPase-activating protein (GAP) that plays a regulatory role in cytokinesis, cell growth, and differentiation. RACGAP1 has been widely reported to take part in the pathogenesis of various cancers, such as colorectal cancer [29], hepatocellular carcinoma [30], and others, but its role in the development of PCa was also unclear. Similarly, the diagnostic and prognostic roles of ZWINT and LMNB1 in PCa remained so far obscure. We determined that TK1, RACGAP1, ZWINT, and LMNB1 were not only significantly up-regulated in PCa tissues, but correlated positively as well with higher Gleason score and TNM stage, suggesting important contributions to the pathogenesis of PCa. Furthermore, ROC curves showed that all four genes could serve as biomarkers to distinguish tumors from normal prostate tissue sensitively and accurately. Indeed, all these genes appeared as promising candidates as therapeutic targets and prognosis predictors.
We also referred to DiseaseMeth 2.0 and MEXPRESS to explore DNA methylation patterns that could account for the abnormal expression of the above hub genes in PCa. We found that TK1, RACGAP1, ZWINT, and LMNB1 were hypomethylated in PCa samples compared with adjacent normal ones, which is consistent with the observed up-regulation of these four hub genes in PCa.
To further explore hub genes’ biological functions, we referred to TIMER and conducted GSEA and GSVA for each hub gene. The expression of LMNB1, TK1, ZWINT, and RACGAP1 was positively associated with tumor purity, while no or weak associations were observed for hub genes and infiltrating immune cells in PCa tissue samples. Based on the findings from TIMER, we proposed that LMNB1, TK1, ZWINT, and RACGAP1 are mainly expressed in PCa cells rather than immune cells, and their functions do not relate to immunological regulation of the tumor microenvironment. The results of GSEA and GSVA were in accordance with this speculation. Also, many cell cycle-related KEGG pathways, such as homologous recombination, mismatch repair, and DNA replication, were enriched in the high-expression groups of these hub genes, suggesting their contribution to PCa proliferation.
In conclusion, by combining RRA, WGCNA, and other bioinformatics tools we identified and characterized several robust DEGs and significant gene modules in PCa. Four hub genes (RACGAP1, ZWINT, TK1, and LMNB1) were strongly upregulated in PCa tissues, an expression pattern likely associated with hypomethylation. GSEA and GSVA further suggested that these genes highly influenced the development of PCa. More work needs to be done to fully reveal their contribution to the pathogenesis of PCa, and to validate their usefulness as diagnostic and/or prognostic markers.
Materials and Methods
Selection of PCa gene expression datasets
All eligible microarray datasets were downloaded from GEO. The selection criteria were as follows: 1) Inclusion of gene expression data of PCa and adjacent normal tissue samples; normal prostate tissue samples from donors and benign prostatic hyperplasia tissue samples were excluded; 2) Arrays contained a minimum of 10 tumor and adjacent normal tissue samples; 3) Inclusion of >5,000 genes in the GEO platform. According to the above screening criteria, 10 datasets were finally included in this study: GSE6919 [31], GSE6956 [32], GSE32448 [33], GSE32571 [34], GSE35988 [35], GSE46602 [36], GSE68555 [37], GSE69223 [38], GSE70768 [39], and GSE88808 [40] (Table 1). In addition, PCa RNA-sequencing and clinical data were downloaded from the TCGA database (https://cancergenome.nih.gov/) and utilized in the study.
Identification of robust DEGs
We downloaded the series matrix files of datasets from GEO. The R package “limma” [41] was utilized to normalize the data and find DEGs. We then used RRA to integrate the results of those 10 datasets to find the most significant DEGs [11]. The P value of each gene indicated its ranking in the final gene list, and genes with adjusted P < 0.05 were considered as significant DEGs in the RRA analysis.
Visualization of gene expression patterns and chromosome locations
“OmicCircos” (R package) was utilized to visualize the expression patterns and chromosomal locations of the top 100 DEGs (top 50 up-regulated genes and top 50 down-regulated genes according to adjusted P) from RRA analysis.
Function enrichment analyses
We conducted Gene Ontology (GO) enrichment and Kyoto Encyclopedia of Genes and Genomes (KEGG) pathway analyses using the R package “clusterprofiler” [42]. GO terms or KEGG pathways with adjusted P < 0.05 were considered statistically significant and visualized by “GOplot” (R package) [43].
WGCNA
We extracted the top 5,000 up-regulated DEGs (according to P) from RRA analysis to perform WGCNA with expression data retrieved from TCGA. The R package “WGCNA” was applied to find clinical traits-related modules and hub genes among them [44]. The adjacency matrix was transformed into topological overlap matrix (TOM). According to the TOM-based dissimilarity measure, genes were divided into different gene modules. Here, we set soft-thresholding power as 6 (scale free R2 = 0.85), cut height as 0.25, and minimal module size as 10 to identify key modules. The module with the highest correlation with clinical traits was selected to explore its biological function through GO and KEGG analyses and to screen hub genes. Hub genes were defined as those with gene significance (GS) > 0.3 and module membership (MM) > 0.8.
Validation and survival analysis of hub genes
We utilized “ggstatsplot” (R package, https://cran.r-project.org/web/packages/ggstatsplot/) to validate the hub genes’ expression levels between PCa and adjacent normal tissue samples as well as their correlations with clinical features in The Cancer Genome Atlas Prostate Adenocarcinoma (TCGA-PRAD) dataset. Independent samples T test or one-way analysis of variance (ANOVA) was used as appropriate. To assess hub genes’ diagnostic values, we plotted receiver operating characteristic (ROC) curves and calculated area under the ROC curve (AUC) with “pROC” R package [45]. Survival analysis was also conducted for hub genes using “survminer” (R package, https://CRAN.R-project.org/package=survminer) and “survival” (R package, https://CRAN.R-project.org/package=survival). Tumor samples within the TCGA-PRAD dataset were divided into two groups based on each hub gene’s best-separation cut-off value to plot the Kaplan-Meier (K-M) survival curves.
Methylation and gene expression analyses
The human disease methylation database version 2.0 (DiseaseMeth 2.0, http://bioinfo.hrbmu.edu.cn/diseasemeth/) incorporates methylome data from microarray and sequencing technology and annotates DNA methylation status in human diseases [46, 47]. We utilized this website to compare methylation levels of hub genes between the PCa and paracancerous normal tissues. Furthermore, we investigated the association between hub genes’ expression and their DNA methylation status using MEXPRESS (http://mexpress.be) [48], a web tool for integrating and visualizing clinical data from TCGA, gene expression, and DNA methylation.
Analysis of gene expression and tumor-infiltrating immune cells
To investigate the correlation between the expression of selected hub genes and tumor infiltrating immune cells (B cells, CD4+ T cells, CD8+ T cells, neutrophils, macrophages, and dendritic cells), we applied the online tool TIMER (https://cistrome.shinyapps.io/timer/) [49, 50] which contains 10,897 samples from diverse cancer types available in the TCGA database.
Gene Set Enrichment Analysis (GSEA) and Gene Set Variation Analysis (GSVA)
We utilized the R package “clusterprofiler” [42] to perform GSEA analysis of hub genes with TCGA-PRAD RNA-seq data. In addition, the “GSVA” R package was used to find the pathways most associated with hub genes [51]. Based on the median expression of each hub gene, 498 PCa samples were divided into two groups (high expression vs low expression). P < 0.01 was regarded as statistically significant. The gene set “c2.cp.kegg.v6.2.symbols.gmt”, downloaded from the Molecular Signature Database (MSigDB, http://software.broadinstitute.org/gsea/msigdb/index.jsp), was selected as the reference gene set.
Supplementary Materials
Author Contributions
Zhenyu Song designed the study and performed data analysis; Chao Fan revised the images; Zhiyuan Zhuo and Zhe Ma performed literature search and data collection; Gang Chen and Wenzhi Li revised the manuscript. All authors reviewed and approved the manuscript.
Acknowledgments
We would like to thank Bin Wang and Yingying Zhang for their outstanding help.
Conflicts of Interest
The authors declare no conflicts of interests.
Funding
The present study was supported by a grant from the Natural Science Foundation of Shanghai (no. 18ZR1405800).
References
- 1. Bray F, Ferlay J, Soerjomataram I, Siegel RL, Torre LA, Jemal A. Global cancer statistics 2018: GLOBOCAN estimates of incidence and mortality worldwide for 36 cancers in 185 countries. CA Cancer J Clin. 2018; 68:394–424. https://doi.org/10.3322/caac.21492 [PubMed]
- 2. Cava C, Bertoli G, Colaprico A, Bontempi G, Mauri G, Castiglioni I. In-Silico Integration Approach to Identify a Key miRNA Regulating a Gene Network in Aggressive Prostate Cancer. Int J Mol Sci. 2018; 19:19. https://doi.org/10.3390/ijms19030910 [PubMed]
- 3. McDonald AC, Vira MA, Vidal AC, Gan W, Freedland SJ, Taioli E. Association between systemic inflammatory markers and serum prostate-specific antigen in men without prostatic disease - the 2001-2008 National Health and Nutrition Examination Survey. Prostate. 2014; 74:561–67. https://doi.org/10.1002/pros.22782 [PubMed]
- 4. Chiam K, Ricciardelli C, Bianco-Miotto T. Epigenetic biomarkers in prostate cancer: current and future uses. Cancer Lett. 2014; 342:248–56. https://doi.org/10.1016/j.canlet.2012.02.011 [PubMed]
- 5. Ciatto S, Zappa M, Bonardi R, Gervasi G. Prostate cancer screening: the problem of overdiagnosis and lessons to be learned from breast cancer screening. Eur J Cancer. 2000; 36:1347–50. https://doi.org/10.1016/S0959-8049(00)00119-2 [PubMed]
- 6. Dall’Era MA, Cooperberg MR, Chan JM, Davies BJ, Albertsen PC, Klotz LH, Warlick CA, Holmberg L, Bailey DE
Jr , Wallace ME, Kantoff PW, Carroll PR. Active surveillance for early-stage prostate cancer: review of the current literature. Cancer. 2008; 112:1650–59. https://doi.org/10.1002/cncr.23373 [PubMed] - 7. Barbieri CE, Chinnaiyan AM, Lerner SP, Swanton C, Rubin MA. The Emergence of Precision Urologic Oncology: A Collaborative Review on Biomarker-driven Therapeutics. Eur Urol. 2017; 71:237–46. https://doi.org/10.1016/j.eururo.2016.08.024 [PubMed]
- 8. Ni M, Liu X, Wu J, Zhang D, Tian J, Wang T, Liu S, Meng Z, Wang K, Duan X, Zhou W, Zhang X. Identification of Candidate Biomarkers Correlated With the Pathogenesis and Prognosis of Non-small Cell Lung Cancer via Integrated Bioinformatics Analysis. Front Genet. 2018; 9:469. https://doi.org/10.3389/fgene.2018.00469 [PubMed]
- 9. Hou Q, Bing ZT, Hu C, Li MY, Yang KH, Mo Z, Xie XW, Liao JL, Lu Y, Horie S, Lou MW. RankProd Combined with Genetic Algorithm Optimized Artificial Neural Network Establishes a Diagnostic and Prognostic Prediction Model that Revealed C1QTNF3 as a Biomarker for Prostate Cancer. EBioMedicine. 2018; 32:234–44. https://doi.org/10.1016/j.ebiom.2018.05.010 [PubMed]
- 10. Yang Y, Lu Q, Shao X, Mo B, Nie X, Liu W, Chen X, Tang Y, Deng Y, Yan J. Development Of A Three-Gene Prognostic Signature For Hepatitis B Virus Associated Hepatocellular Carcinoma Based On Integrated Transcriptomic Analysis. J Cancer. 2018; 9:1989–2002. https://doi.org/10.7150/jca.23762 [PubMed]
- 11. Kolde R, Laur S, Adler P, Vilo J. Robust rank aggregation for gene list integration and meta-analysis. Bioinformatics. 2012; 28:573–80. https://doi.org/10.1093/bioinformatics/btr709 [PubMed]
- 12. Chandran UR, Dhir R, Ma C, Michalopoulos G, Becich M, Gilbertson J. Differences in gene expression in prostate cancer, normal appearing prostate tissue adjacent to cancer and prostate tissue from cancer free organ donors. BMC Cancer. 2005; 5:45. https://doi.org/10.1186/1471-2407-5-45 [PubMed]
- 13. Neuhaus EM, Zhang W, Gelis L, Deng Y, Noldus J, Hatt H. Activation of an olfactory receptor inhibits proliferation of prostate cancer cells. J Biol Chem. 2009; 284:16218–25. https://doi.org/10.1074/jbc.M109.012096 [PubMed]
- 14. Wang W, Yang X, Dai J, Lu Y, Zhang J, Keller ET. Prostate cancer promotes a vicious cycle of bone metastasis progression through inducing osteocytes to secrete GDF15 that stimulates prostate cancer growth and invasion. Oncogene. 2019; 38:4540–59. https://doi.org/10.1038/s41388-019-0736-3 [PubMed]
- 15. Taylor BS, Schultz N, Hieronymus H, Gopalan A, Xiao Y, Carver BS, Arora VK, Kaushik P, Cerami E, Reva B, Antipin Y, Mitsiades N, Landers T, et al. Integrative genomic profiling of human prostate cancer. Cancer Cell. 2010; 18:11–22. https://doi.org/10.1016/j.ccr.2010.05.026 [PubMed]
- 16. Krohn A, Seidel A, Burkhardt L, Bachmann F, Mader M, Grupp K, Eichenauer T, Becker A, Adam M, Graefen M, Huland H, Kurtz S, Steurer S, et al. Recurrent deletion of 3p13 targets multiple tumour suppressor genes and defines a distinct subgroup of aggressive ERG fusion-positive prostate cancers. J Pathol. 2013; 231:130–41. https://doi.org/10.1002/path.4223 [PubMed]
- 17. Marignol L, Coffey M, Lawler M, Hollywood D. Hypoxia in prostate cancer: a powerful shield against tumour destruction? Cancer Treat Rev. 2008; 34:313–27. https://doi.org/10.1016/j.ctrv.2008.01.006 [PubMed]
- 18. Martin TA, Jiang WG. Loss of tight junction barrier function and its role in cancer metastasis. Biochim Biophys Acta. 2009; 1788:872–91. https://doi.org/10.1016/j.bbamem.2008.11.005 [PubMed]
- 19. Montanari M, Rossetti S, Cavaliere C, D’Aniello C, Malzone MG, Vanacore D, Di Franco R, La Mantia E, Iovane G, Piscitelli R, Muscariello R, Berretta M, Perdonà S, et al. Epithelial-mesenchymal transition in prostate cancer: an overview. Oncotarget. 2017; 8:35376–89. https://doi.org/10.18632/oncotarget.15686 [PubMed]
- 20. Walker C, Mojares E, Del Río Hernández A. Role of Extracellular Matrix in Development and Cancer Progression. Int J Mol Sci. 2018; 19:19. https://doi.org/10.3390/ijms19103028 [PubMed]
- 21. Miller WL, Auchus RJ. The molecular biology, biochemistry, and physiology of human steroidogenesis and its disorders. Endocr Rev. 2011; 32:81–151. https://doi.org/10.1210/er.2010-0013 [PubMed]
- 22. Bansal A, Simon MC. Glutathione metabolism in cancer progression and treatment resistance. J Cell Biol. 2018; 217:2291–98. https://doi.org/10.1083/jcb.201804161 [PubMed]
- 23. Freitas M, Baldeiras I, Proença T, Alves V, Mota-Pinto A, Sarmento-Ribeiro A. Oxidative stress adaptation in aggressive prostate cancer may be counteracted by the reduction of glutathione reductase. FEBS Open Bio. 2012; 2:119–28. https://doi.org/10.1016/j.fob.2012.05.001 [PubMed]
- 24. Yu YP, Yu G, Tseng G, Cieply K, Nelson J, Defrances M, Zarnegar R, Michalopoulos G, Luo JH. Glutathione peroxidase 3, deleted or methylated in prostate cancer, suppresses prostate cancer growth and metastasis. Cancer Res. 2007; 67:8043–50. https://doi.org/10.1158/0008-5472.CAN-07-0648 [PubMed]
- 25. Garrido-Rodríguez M, Ortea I, Calzado MA, Muñoz E, García V. SWATH proteomic profiling of prostate cancer cells identifies NUSAP1 as a potential molecular target for Galiellalactone. J Proteomics. 2019; 193:217–29. https://doi.org/10.1016/j.jprot.2018.10.012 [PubMed]
- 26. Liang YX, Lu JM, Mo RJ, He HC, Xie J, Jiang FN, Lin ZY, Chen YR, Wu YD, Luo HW, Luo Z, Zhong WD. E2F1 promotes tumor cell invasion and migration through regulating CD147 in prostate cancer. Int J Oncol. 2016; 48:1650–58. https://doi.org/10.3892/ijo.2016.3364 [PubMed]
- 27. Vainio P, Mpindi JP, Kohonen P, Fey V, Mirtti T, Alanen KA, Perälä M, Kallioniemi O, Iljin K. High-throughput transcriptomic and RNAi analysis identifies AIM1, ERGIC1, TMED3 and TPX2 as potential drug targets in prostate cancer. PLoS One. 2012; 7:e39801. https://doi.org/10.1371/journal.pone.0039801 [PubMed]
- 28. Zhou J, He E, Skog S. The proliferation marker thymidine kinase 1 in clinical use. Mol Clin Oncol. 2013; 1:18–28. https://doi.org/10.3892/mco.2012.19 [PubMed]
- 29. Imaoka H, Toiyama Y, Saigusa S, Kawamura M, Kawamoto A, Okugawa Y, Hiro J, Tanaka K, Inoue Y, Mohri Y, Kusunoki M. RacGAP1 expression, increasing tumor malignant potential, as a predictive biomarker for lymph node metastasis and poor prognosis in colorectal cancer. Carcinogenesis. 2015; 36:346–54. https://doi.org/10.1093/carcin/bgu327 [PubMed]
- 30. Wang SM, Ooi LL, Hui KM. Upregulation of Rac GTPase-activating protein 1 is significantly associated with the early recurrence of human hepatocellular carcinoma. Clin Cancer Res. 2011; 17:6040–51. https://doi.org/10.1158/1078-0432.CCR-11-0557 [PubMed]
- 31. Chandran UR, Ma C, Dhir R, Bisceglia M, Lyons-Weiler M, Liang W, Michalopoulos G, Becich M, Monzon FA. Gene expression profiles of prostate cancer reveal involvement of multiple molecular pathways in the metastatic process. BMC Cancer. 2007; 7:64. https://doi.org/10.1186/1471-2407-7-64 [PubMed]
- 32. Wallace TA, Prueitt RL, Yi M, Howe TM, Gillespie JW, Yfantis HG, Stephens RM, Caporaso NE, Loffredo CA, Ambs S. Tumor immunobiological differences in prostate cancer between African-American and European-American men. Cancer Res. 2008; 68:927–36. https://doi.org/10.1158/0008-5472.CAN-07-2608 [PubMed]
- 33. Derosa CA, Furusato B, Shaheduzzaman S, Srikantan V, Wang Z, Chen Y, Seifert M, Ravindranath L, Young D, Nau M, Dobi A, Werner T, McLeod DG, et al. Elevated osteonectin/SPARC expression in primary prostate cancer predicts metastatic progression. Prostate Cancer Prostatic Dis. 2012; 15:150–56. https://doi.org/10.1038/pcan.2011.61 [PubMed]
- 34. Kuner R, Fälth M, Pressinotti NC, Brase JC, Puig SB, Metzger J, Gade S, Schäfer G, Bartsch G, Steiner E, Klocker H, Sültmann H. The maternal embryonic leucine zipper kinase (MELK) is upregulated in high-grade prostate cancer. J Mol Med (Berl). 2013; 91:237–48. https://doi.org/10.1007/s00109-012-0949-1 [PubMed]
- 35. Grasso CS, Wu YM, Robinson DR, Cao X, Dhanasekaran SM, Khan AP, Quist MJ, Jing X, Lonigro RJ, Brenner JC, Asangani IA, Ateeq B, Chun SY, et al. The mutational landscape of lethal castration-resistant prostate cancer. Nature. 2012; 487:239–43. https://doi.org/10.1038/nature11125 [PubMed]
- 36. Mortensen MM, Høyer S, Lynnerup AS, Ørntoft TF, Sørensen KD, Borre M, Dyrskjøt L. Expression profiling of prostate cancer tissue delineates genes associated with recurrence after prostatectomy. Sci Rep. 2015; 5:16018. https://doi.org/10.1038/srep16018 [PubMed]
- 37. Yu YP, Landsittel D, Jing L, Nelson J, Ren B, Liu L, McDonald C, Thomas R, Dhir R, Finkelstein S, Michalopoulos G, Becich M, Luo JH. Gene expression alterations in prostate cancer predicting tumor aggression and preceding development of malignancy. J Clin Oncol. 2004; 22:2790–99. https://doi.org/10.1200/JCO.2004.05.158 [PubMed]
- 38. Meller S, Meyer HA, Bethan B, Dietrich D, Maldonado SG, Lein M, Montani M, Reszka R, Schatz P, Peter E, Stephan C, Jung K, Kamlage B, Kristiansen G. Integration of tissue metabolomics, transcriptomics and immunohistochemistry reveals ERG- and gleason score-specific metabolomic alterations in prostate cancer. Oncotarget. 2016; 7:1421–38. https://doi.org/10.18632/oncotarget.6370 [PubMed]
- 39. Ross-Adams H, Lamb AD, Dunning MJ, Halim S, Lindberg J, Massie CM, Egevad LA, Russell R, Ramos-Montoya A, Vowler SL, Sharma NL, Kay J, Whitaker H, et al, and CamCaP Study Group. Integration of copy number and transcriptomics provides risk stratification in prostate cancer: A discovery and validation cohort study. EBioMedicine. 2015; 2:1133–44. https://doi.org/10.1016/j.ebiom.2015.07.017 [PubMed]
- 40. Ding Y, Wu H, Warden C, Steele L, Liu X, Iterson MV, Wu X, Nelson R, Liu Z, Yuan YC, Neuhausen SL. Gene Expression Differences in Prostate Cancers between Young and Old Men. PLoS Genet. 2016; 12:e1006477. https://doi.org/10.1371/journal.pgen.1006477 [PubMed]
- 41. Ritchie ME, Phipson B, Wu D, Hu Y, Law CW, Shi W, Smyth GK. limma powers differential expression analyses for RNA-sequencing and microarray studies. Nucleic Acids Res. 2015; 43:e47. https://doi.org/10.1093/nar/gkv007 [PubMed]
- 42. Yu G, Wang LG, Han Y, He QY. clusterProfiler: an R package for comparing biological themes among gene clusters. OMICS. 2012; 16:284–87. https://doi.org/10.1089/omi.2011.0118 [PubMed]
- 43. Walter W, Sánchez-Cabo F, Ricote M. GOplot: an R package for visually combining expression data with functional analysis. Bioinformatics. 2015; 31:2912–14. https://doi.org/10.1093/bioinformatics/btv300 [PubMed]
- 44. Langfelder P, Horvath S. WGCNA: an R package for weighted correlation network analysis. BMC Bioinformatics. 2008; 9:559. https://doi.org/10.1186/1471-2105-9-559 [PubMed]
- 45. Robin X, Turck N, Hainard A, Tiberti N, Lisacek F, Sanchez JC, Müller M. pROC: an open-source package for R and S+ to analyze and compare ROC curves. BMC Bioinformatics. 2011; 12:77. https://doi.org/10.1186/1471-2105-12-77 [PubMed]
- 46. Lv J, Liu H, Su J, Wu X, Liu H, Li B, Xiao X, Wang F, Wu Q, Zhang Y. DiseaseMeth: a human disease methylation database. Nucleic Acids Res. 2012; 40:D1030–35. https://doi.org/10.1093/nar/gkr1169 [PubMed]
- 47. Xiong Y, Wei Y, Gu Y, Zhang S, Lyu J, Zhang B, Chen C, Zhu J, Wang Y, Liu H, Zhang Y. DiseaseMeth version 2.0: a major expansion and update of the human disease methylation database. Nucleic Acids Res. 2017; 45:D888–95. https://doi.org/10.1093/nar/gkw1123 [PubMed]
- 48. Koch A, De Meyer T, Jeschke J, Van Criekinge W. MEXPRESS: visualizing expression, DNA methylation and clinical TCGA data. BMC Genomics. 2015; 16:636. https://doi.org/10.1186/s12864-015-1847-z [PubMed]
- 49. Li B, Severson E, Pignon JC, Zhao H, Li T, Novak J, Jiang P, Shen H, Aster JC, Rodig S, Signoretti S, Liu JS, Liu XS. Comprehensive analyses of tumor immunity: implications for cancer immunotherapy. Genome Biol. 2016; 17:174. https://doi.org/10.1186/s13059-016-1028-7 [PubMed]
- 50. Li T, Fan J, Wang B, Traugh N, Chen Q, Liu JS, Li B, Liu XS. TIMER: A Web Server for Comprehensive Analysis of Tumor-Infiltrating Immune Cells. Cancer Res. 2017; 77:e108–10. https://doi.org/10.1158/0008-5472.CAN-17-0307 [PubMed]
- 51. Hänzelmann S, Castelo R, Guinney J. GSVA: gene set variation analysis for microarray and RNA-seq data. BMC Bioinformatics. 2013; 14:7. https://doi.org/10.1186/1471-2105-14-7 [PubMed]