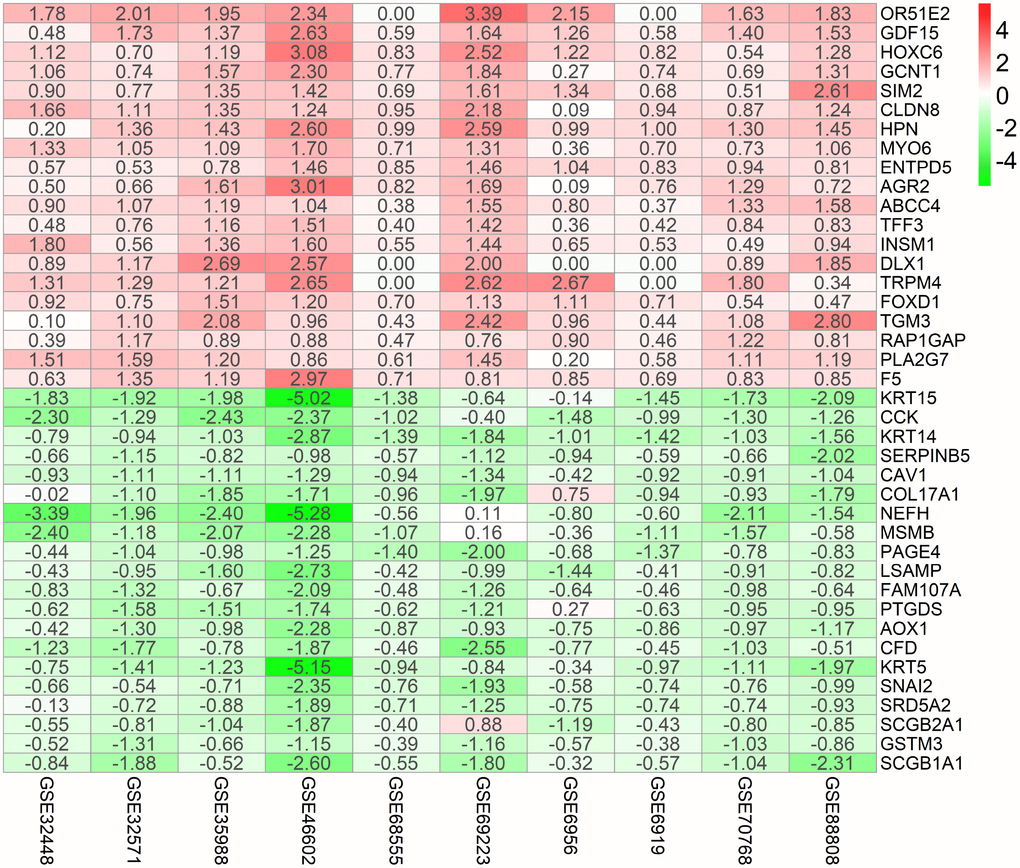
Figure 2.Identification of robust DEGs by RRA analysis. Heatmap showing the top 20 up-regulated genes and top 20 down-regulated genes according to P value. Each row represents one gene and each column indicates one dataset. Red indicates up-regulation and blue represents down-regulation. The numbers in the heatmap indicate logarithmic fold change in each dataset calculated by the “limma” R package. DEG, differentially expressed gene; GEO: Gene Expression Omnibus; RRA: robust rank aggregation.