


Introduction
Gestational age (GA) of the fetus is used to forecast the date of delivery, optimize prenatal care, and monitor the growth and development of the fetus relative to other pregnancies. Short GA at delivery impacts neonatal morbidity and mortality [1–3], as well as brain development [4–6]. Thus, accurate classification of the fetus may help predict neonatal risk. In this regard, the World Health Organization defined extremely preterm (<28 weeks of gestation), very preterm (28-32 weeks of gestation) and moderate or late preterm (32-37 weeks of gestation) birth to reflect the newborn’s developmental stage [7].
Traditional methods for estimating GA include early obstetric ultrasound measures or calculations based on the last menstrual period (LMP) [8]. The early ultrasound method estimates GA based on the visible fetal size (e.g., crown-rump length during the first trimester [9–11] or biparietal diameter after the second trimester [12–15]). The LMP method calculates GA based on the time elapsed since the known first day of the LMP. The early ultrasound method is widely accepted as the gold standard due to its higher accuracy [16] but is not routinely available in low and middle-income countries. More accurate classification of GA at birth may help predict neonatal risk for adverse outcomes and measure GA more accurately than through the assessment of physical and neurological features of the newborn, especially when early ultrasound measures are lacking, or the infant is growth-restricted but not preterm.
Here, we aim to develop a new molecular estimator of GA based on placental tissue samples that is more accurate than the previous clock [17]. Earlier studies have revealed profound molecular changes in placental chorionic villi, the placental structures that project into maternal decidua and are bathed in maternal blood, during gestation [18–22]. We focus on placental DNA methylation (DNAm) data, because prior work demonstrated that accurate estimators of chronological age (epigenetic clocks) can be developed based on DNAm levels from a variety of tissues [23], that one can estimate GA based on DNAm data derived from umbilical cord blood samples [24,25], and most pertinently that one can estimate GA based on placental methylation data (Mayne et al. 2017) [17]. Our study provides more accurate placenta-based GA estimators (i.e. placental epigenetic clocks) than those developed previously, because we use a substantially larger sample for our training set (more than six times larger than that of Mayne et al. 2017). We aim to develop three different placental epigenetic clocks: 1) a “robust placental clock” (RPC) that is largely unaffected by pregnancy conditions (e.g., preeclampsia, gestational diabetes, and trisomy), 2) a “control placental clock” (CPC), tailor-made for measuring GA in normal pregnancies, and 3) a “refined RPC”, trained for uncomplicated term (GA>36) pregnancies. For the RPC, we purposely included placental samples from a variety of pregnancy complications in the training data (e.g., hypertension or diabetes) as well as congenital abnormalities (e.g., trisomy 13, 18 and 21).
Results
Placental DNA methylation data
We downloaded publicly available DNAm data from Gene Expression Omnibus (GEO, https://www.ncbi.nlm.nih.gov/geo/; Table 1) that assessed DNAm levels in placental tissues. Eighteen datasets used the Illumina HumanMethylation 450K BeadChip (450K) platform and one used the more recent Illumina MethylationEPIC BeadChip (EPIC) array. Our analyses focused on the 441,870 autosomal CpG probes that are shared between the two Illumina platforms such that the resulting GA estimators (RPC and CPC) would be applicable to data from both platforms.
Table 1. Description of the publicly available placental DNAm data.
| GEO Number | Placental tissue type | GEO submitter | N | Platform | Normalization method | Probe exclusion criteria11 | GA range (weeks) | ||||||||||||||||||||||||||||||||||||||||||||||||||||||||||||||||||||||||||||||||||||||||||||
| Training data | |||||||||||||||||||||||||||||||||||||||||||||||||||||||||||||||||||||||||||||||||||||||||||||||||||
| GSE71678 | Fetal side, near the cord insertion | Marsit et al. | 343 | 450K2 | funNorm4 | SC, CH, SNP, DP | 30-42 | ||||||||||||||||||||||||||||||||||||||||||||||||||||||||||||||||||||||||||||||||||||||||||||
| GSE75248 | Fetal side | Marsit et al. | 334 | 450K2 | funNorm4 | SC, CH, SNP, DP | 37-42 | ||||||||||||||||||||||||||||||||||||||||||||||||||||||||||||||||||||||||||||||||||||||||||||
| GSE71719 | Fetal side, near the cord insertion | Marsit et al. | 44 | 450K2 | noob5 | SC, CH, SNP, DP | 37-41 | ||||||||||||||||||||||||||||||||||||||||||||||||||||||||||||||||||||||||||||||||||||||||||||
| RL1 | Fetal side, chorionic villi | - | 121 | 450K2 | funNorm4 | SC | 14-42 | ||||||||||||||||||||||||||||||||||||||||||||||||||||||||||||||||||||||||||||||||||||||||||||
| GSE100197 | Fetal side, chorionic villi | Robinson et al. | 16 | 450K2 | SWAN6 | SC, SNP, DP, MB | 26-39 | ||||||||||||||||||||||||||||||||||||||||||||||||||||||||||||||||||||||||||||||||||||||||||||
| GSE108567 | Fetal side, chorionic villi | Robinson et al. | 7 | 450K2 | SWAN6 | SC, CH, SNP, DP, BR | 29-38 | ||||||||||||||||||||||||||||||||||||||||||||||||||||||||||||||||||||||||||||||||||||||||||||
| GSE69502 | Fetal side, chorionic villi | Robinson et al. | 7 | 450K2 | SWAN6 | SC, CH, SNP, DP, BR | 16-24 | ||||||||||||||||||||||||||||||||||||||||||||||||||||||||||||||||||||||||||||||||||||||||||||
| GSE74738 | Fetal side, chorionic villi | Robinson et al. | 8 | 450K2 | SWAN6 | SC, CH, SNP, DP, BR | 6-13 | ||||||||||||||||||||||||||||||||||||||||||||||||||||||||||||||||||||||||||||||||||||||||||||
| GSE115508 | Fetal side, chorionic villi | Robinson et al. | 44 | EPIC3 | funNorm4 | SC, CH, SNP, DP, BR | 28-37 | ||||||||||||||||||||||||||||||||||||||||||||||||||||||||||||||||||||||||||||||||||||||||||||
| GSE44667 | Fetal side, chorionic villi | Robinson et al. | 27 | 450K2 | SWAN6 | SC, SNP, DP, MB | 25-37 | ||||||||||||||||||||||||||||||||||||||||||||||||||||||||||||||||||||||||||||||||||||||||||||
| GSE49343 | Fetal side, chorionic villi | Robinson et al. | 13 | 450K2 | SWAN6 | SC, SNP, DP | 5-39 | ||||||||||||||||||||||||||||||||||||||||||||||||||||||||||||||||||||||||||||||||||||||||||||
| GSE42409 | Fetal side, chorionic villi | Robinson et al. | 4 | 450K2 | SWAN6 | SC, SNP, DP | 26-33 | ||||||||||||||||||||||||||||||||||||||||||||||||||||||||||||||||||||||||||||||||||||||||||||
| GSE120250 | Fetal side, near the cord insertion | Weksberg et al. | 86 | 450K2 | GenomeStudioNorm7 | SC, SNP, DP | 35-41 | ||||||||||||||||||||||||||||||||||||||||||||||||||||||||||||||||||||||||||||||||||||||||||||
| GSE98224 | Fetal side | Cox et al. | 48 | 450K2 | SWAN6 | SC, SNP, DP, MB | 27-41 | ||||||||||||||||||||||||||||||||||||||||||||||||||||||||||||||||||||||||||||||||||||||||||||
| Test data | |||||||||||||||||||||||||||||||||||||||||||||||||||||||||||||||||||||||||||||||||||||||||||||||||||
| GSE70453 | Maternal side, decidua near the cord | Binder et al. | 82 | 450K2 | BMIQ8 | SC, CR, SNP | 35-42 | ||||||||||||||||||||||||||||||||||||||||||||||||||||||||||||||||||||||||||||||||||||||||||||
| GSE73375 | Fetal side | Fry et al. | 36 | 450K2 | quanNorm9 | DP | 22-41 | ||||||||||||||||||||||||||||||||||||||||||||||||||||||||||||||||||||||||||||||||||||||||||||
| GSE75196 | Fetal side | Chiu et al. | 24 | 450K2 | dasen10 | SC, SNP, DP, BR | 32-40 | ||||||||||||||||||||||||||||||||||||||||||||||||||||||||||||||||||||||||||||||||||||||||||||
| GSE76641 | Fetal side, chorionic villi | Slieker et al. | 4 | 450K2 | funNorm4 | SC, SNP, DP, BR | 9-22 | ||||||||||||||||||||||||||||||||||||||||||||||||||||||||||||||||||||||||||||||||||||||||||||
| GSE66210 | Fetal side, chorionic villi | Bojesen et al. | 41 | 450K2 | GenomeStudioNorm7 | - | 11-15 | ||||||||||||||||||||||||||||||||||||||||||||||||||||||||||||||||||||||||||||||||||||||||||||
| 1 Placental DNAm data generated from the Robinson laboratory at the University of British Columbia (Vancouver, BC, Canada); The data for which is publicly available as part of the GEO data sets listed below. | |||||||||||||||||||||||||||||||||||||||||||||||||||||||||||||||||||||||||||||||||||||||||||||||||||
| 2 450K: Illumina Infinium HumanMethylation450 BeadChip | |||||||||||||||||||||||||||||||||||||||||||||||||||||||||||||||||||||||||||||||||||||||||||||||||||
| 3 EPIC: Infinium MethylationEPIC BeadChip | |||||||||||||||||||||||||||||||||||||||||||||||||||||||||||||||||||||||||||||||||||||||||||||||||||
| 4 funNorm: Functional normalization [27] | |||||||||||||||||||||||||||||||||||||||||||||||||||||||||||||||||||||||||||||||||||||||||||||||||||
| 5 noob: Normal-exponential out-of-band [29] | |||||||||||||||||||||||||||||||||||||||||||||||||||||||||||||||||||||||||||||||||||||||||||||||||||
| 6 SWAN: Subset-quantile within array normalization [28] | |||||||||||||||||||||||||||||||||||||||||||||||||||||||||||||||||||||||||||||||||||||||||||||||||||
| 7 GenomeStudioNorm: Genome Studio normalization | |||||||||||||||||||||||||||||||||||||||||||||||||||||||||||||||||||||||||||||||||||||||||||||||||||
| (details available in the GenomeStudio Methylation Module v1.8 User Guide, https://www.illumina.com/content/dam/illumina-support/documents/documentation/software_documentation/genomestudio/genomestudio-2011-1/genomestudio-methylation-v1-8-user-guide-11319130-b.pdf) | |||||||||||||||||||||||||||||||||||||||||||||||||||||||||||||||||||||||||||||||||||||||||||||||||||
| 8 BMIQ: Beta-mixture quantile dilation [30] | |||||||||||||||||||||||||||||||||||||||||||||||||||||||||||||||||||||||||||||||||||||||||||||||||||
| 9 quanNorm: Quantile normalization [31,32] | |||||||||||||||||||||||||||||||||||||||||||||||||||||||||||||||||||||||||||||||||||||||||||||||||||
| 10 dasen: Data-driven separate normalization [33] | |||||||||||||||||||||||||||||||||||||||||||||||||||||||||||||||||||||||||||||||||||||||||||||||||||
| 11 Probe exclusion criteria | |||||||||||||||||||||||||||||||||||||||||||||||||||||||||||||||||||||||||||||||||||||||||||||||||||
| SC: Sex chromosome, CH: Cross-hybridizing, SNP: Single nucleotide polymorphism, DP: Detection P-value < 0.01, MB: Missing beta > 5%, and BR: Bead replicates < 3. | |||||||||||||||||||||||||||||||||||||||||||||||||||||||||||||||||||||||||||||||||||||||||||||||||||
Robust placental clock (RPC)
An overview of our analysis is presented in Figure 1. We developed the RPC using several placental DNAm datasets (training n=1,102, Table 1, Figure 1). We regressed GA (dependent variable) on DNAm levels of CpG sites using a penalized regression model (elastic net regression [26]). The elastic net regression model automatically selected 558 CpG sites for the RPC model (Supplementary File 1). Predicted GA is a weighted average of DNAm levels at these 558 CpGs, where the weights are the regression coefficients.
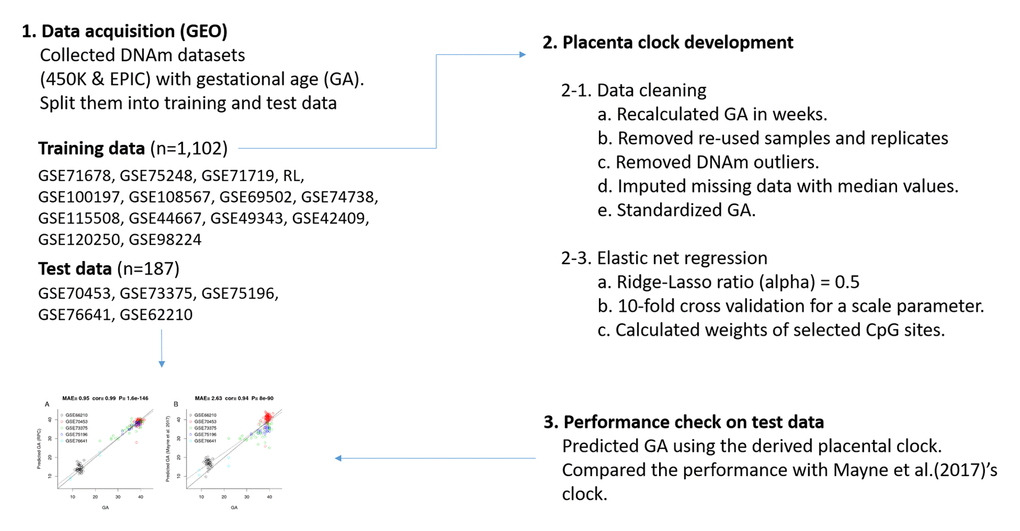
Figure 1. Flow chart of the RPC development.
Figure 2 shows the results of a comparison between the RPC and the placental clock from Mayne et al. (2017) in independent test data (test n=187, Table 1). The predictive accuracy of the placental clocks was quantified using the median absolute error (MAE, defined as the median absolute deviation between predicted GA and observed GA), and the degree of the linear association between predicted GA and observed GA was measured using the Pearson correlation coefficient (r). According to both measures, the RPC (MAE=0.96 weeks; 95% confidence interval (CI) [0.88, 1.19], r=0.99; 95% CI [0.98, 0.99]) outperformed Mayne’s placental clock (MAE=2.63 weeks; 95% CI [2.17, 3.01], r=0.94; 95% CI [0.92, 0.96]). Note that Mayne’s placental clock underestimated GA in two data sets: GSE73375 (green dots) and GSE75196 (blue dots), and overestimated GA in two other data sets: GSE66210 (black) and GSE70453 (red).
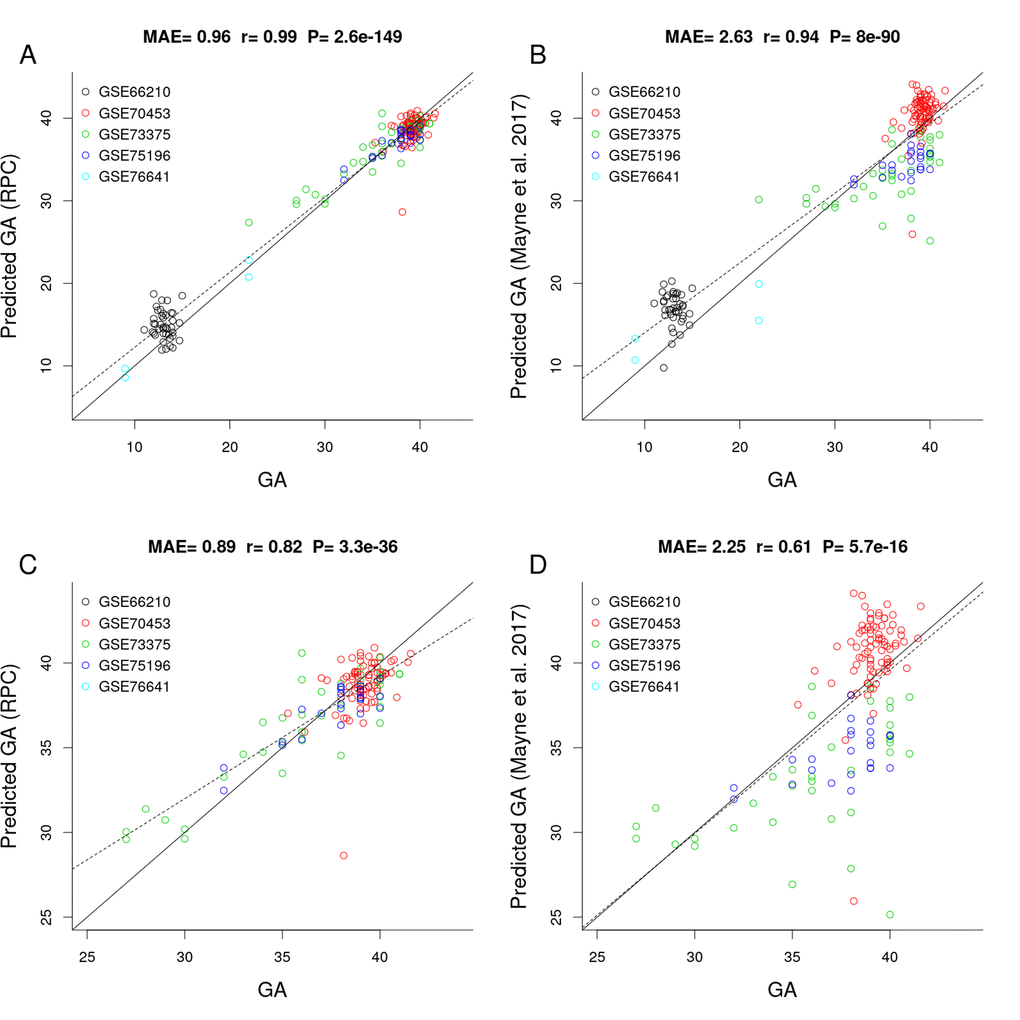
Figure 2. Gestational age estimation of the RPC and Mayne et al. (2017)’s placental clock. (A) Scatter plot between observed GA and DNAm-predicted GA (RPC) across all trimesters. (B) Scatter plot between observed GA and DNAm-predicted GA (Mayne et al. 2017) across all trimesters. (C) Zoom-in on panel A restricting GA > 25 weeks. (D) Zoom-in on panel B restricting GA > 25 weeks.
The advantage of the RPC is particularly pronounced in later gestation, e.g., when restricting the analysis to placental samples with GA > 25 weeks, the RPC (MAE=0.89 [0.73, 1.02], r=0.82 [0.76, 0.87]) greatly outperforms Mayne's clock (MAE=2.25 [1.9, 2.63], r=0.61 [0.05,0.71], Figure 2C and 2D).
As expected by its construction, the RPC predicted GA accurately even in placental samples with adverse pregnancy conditions such as preeclampsia, gestational diabetes, and trisomy 13, 18 or 21 (Supplementary Figure S1). However, Mayne’s placental clock underestimated GA in placental samples from preeclampsia cases and overestimated GA in cases of gestational diabetes and trisomy (Supplementary Figure S1). In case of trisomy, the RPC (MAE=2.26 [1.63, 2.88], r=0.12 [-0.25, 0.46]) was more accurate than Mayne’s clock (MAE=3.99 [3.35, 5.4], r=0.02 [-0.34, 0.39]) but still showed a slight overestimation. The RPC's GA estimate was not associated with fetal sex (Supplementary Figure S2). We could not evaluate the effect of ethnicity because our test data did not include ethnic information except for GSE73375 (n=36, Supplementary Figure S3).
The training data used in the construction of the RPC employed several different normalization methods: functional normalization (funNorm [27],), subset-quantiles within arrays (SWAN [28],) and the normal-exponential out-of-band (noob [29],) approach. This lack of uniformity in normalization methods in the training data has a statistical advantage: it makes it more likely that the RPC will be robust with respect to different normalization methods. In support of this, we found that the RPC validated in test data that were normalized using various methods: beta-mixture quantile dilation (BMIQ [30],), quantile normalization (quanNorm [31,32],), data-driven separate normalization (dasen [33],) as detailed in Table 1.
Control placental clock (CPC)
We trained the CPC on placental samples (training n=963, Table 1) that had been designated as "control" samples. Hence, placental samples with higher GA were probably from relatively normal pregnancies. However, placental samples with lower GA might contain samples that would be considered abnormal (i.e. premature rupture of membranes, spontaneous premature labor) but minimal placental pathology relative to preeclampsia cases. The analysis flow was identical as for the RPC, except for the composition of the training and test sets (Supplementary Figure S4). The elastic net regression model used for the CPC automatically selected 546 CpG sites (Supplementary File 1).
To assess whether adverse pregnancy conditions influence the epigenetic GA estimate, we applied the CPC to placental samples associated with chromosomal abnormalities (confined placental mosaicism, diandric triploidy, trisomy 13, 16, 18 and 21), neural tube defects (anencephaly and spinal bifida), intrauterine growth restriction, maternal complications (gestational diabetes and preeclampsia), and chorioamnionitis (test, n=326). Interestingly, the CPC accurately predicted the GA of fetuses with the above-mentioned conditions (MAE=1.02, r=0.98, Figure 3A) even though the CPC was constructed using unaffected control samples only.
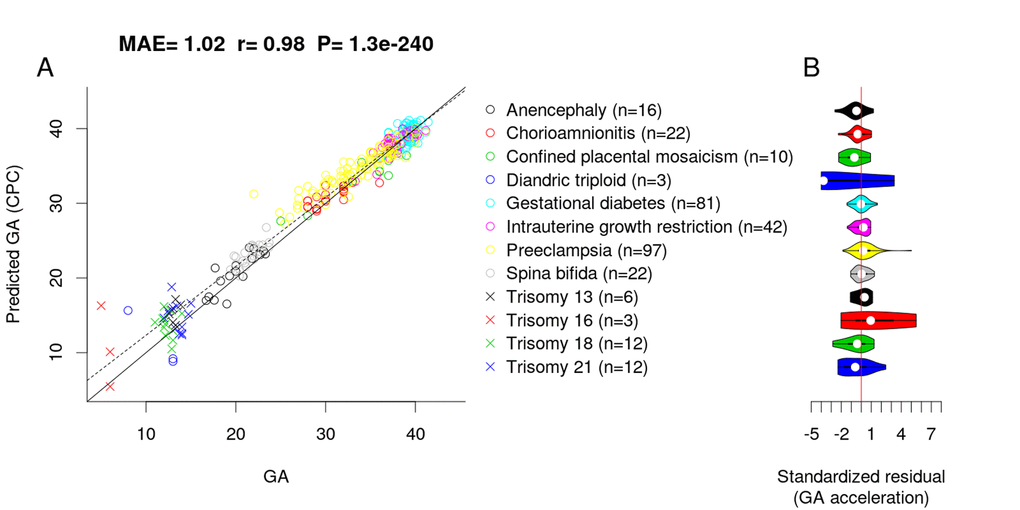
Figure 3. Effect of pregnancy condition on the GA estimate by CPC. (A) Scatter plot between GA and DNAm-predicted GA (CPC) across all trimesters. (B) Violin plot of GA acceleration (standardized residual) for each pregnancy condition.
To test whether pregnancy conditions are associated with faster/slower epigenetic aging, we used epigenetic measures of GA acceleration that were formally defined as raw residuals resulting from regressing the DNAm GA estimate on observed GA. By definition, this residual-based measure of GA acceleration is not correlated with true GA (r=0). GA acceleration did not significantly deviate from zero for any pregnancy conditions mentioned above (Figure 3B), but we acknowledge the small sample sizes for diandric triploidy (n=3) and trisomy 16 (n=3). When restricting the analysis to placental samples from the first trimester (weeks 1 to 12), we found the CPC’s GA estimates to be slightly inaccurate, which was due to the small training set (only n=7 fetuses with GA < 12 weeks).
Refined robust placental clock for uncomplicated term pregnancies
For researchers who are particularly interested in uncomplicated term pregnancies, we also developed a second version of the RPC using placental samples from "uncomplicated term” pregnancies (defined as GA > 36 weeks) without any known pregnancy condition.
Toward this end, we selected "uncomplicated" term placental samples (n=733) from the training set used for the original RPC. Further, we restricted the penalized regression model analysis to the 558 CpGs that make up the original RPC. The penalized regression model automatically selected 395 CpG sites out of the 558 sites (Supplementary File 1). We find that the "refined" RPC for uncomplicated term pregnancies leads to highly accurate GA estimates (MAE=1.49, r=0.98, Figure 4A) in the RPC’s test set (n=187).
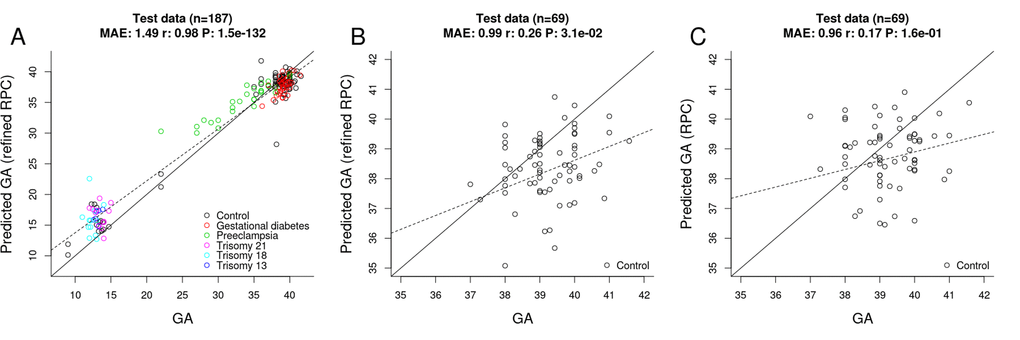
Figure 4. Gestational age estimation by the refined RPC and the RPC. (A) Scatter plot between observed GA and DNAm-predicted GA (by the refined RPC) – all samples from the RPC’s test data (n=187). (B) Scatter plot between observed GA and DNAm-predicted GA (by the refined RPC) - uncomplicated term samples from the RPC’s test data (n=69). (C) Scatter plot between observed GA and DNAm-predicted GA (by the RPC) - uncomplicated term samples from the RPC’s test data (n=69).
Evaluating other epigenetic clocks
Using RPC’s test data (n=187), we found that previously published epigenetic clocks derived from cord blood samples or other tissues do not apply to the estimation of GA based on placental samples.
No significant correlation between GA and predicted DNAm age could be observed for clocks by Hannum (2013) [34], Horvath (2013) [23], Levine (2018) [35], and Horvath (2018) [36] (Supplementary Figure S5). However, the DNAm age estimate is close to zero for Horvath’s pan-tissue clock and the more recently developed Skin & Blood clock. Similarly, GA estimators for cord blood (Bohlin's cord blood clock [24], Knight’s cord blood clock [25]) failed to accurately predict GA in placental samples (Supplementary Figure S6). Overall, these studies demonstrate that the placenta is quite distinct from other tissues regarding the development and application of DNAm based age estimators.
Fetal sex-classifier based on DNAm
Several GEO datasets did not report fetal sex (e.g., GSE70453, GSE73375 and GSE76641) and CpGs present on sex chromosomes. Therefore, we developed a fetal sex-classifier based RPC’s training data (n=1,102) using CpGs that are present on autosomes. Toward this end, we regressed fetal sex (binary outcome) on 441,870 autosomal CpG sites using an elastic net implemented in the glmnet R package [37]. The elastic net automatically selected 220 autosomal CpG sites. The classification accuracy was 100% for the placental test data from GSE75196 (n=24). Interestingly, the placental sex classifier turns out to be highly accurate, when applied to blood-based DNAm data from adults (e.g., an accuracy of 96% in the data from the Framingham Heart Study, n=2,356). As the sex of the fetus is typically identical to the sex of its placenta (except for rare cases of chimerism or sex-chromosome mosaicism), the sex-classifier was used to impute fetal sex in GSE66210, GSE70453, GSE73375 and GSE76641.
Epigenome-wide association studies of gestational age
We briefly report the results from an epigenome wide association study (EWAS) of GA to demonstrate the profound effect of GA on placental DNAm levels. To protect against confounding by preeclampsia, we conducted EWAS in two separate strata: first, for placental samples from control pregnancies (n=831); second, for placental samples from pregnancies with preeclampsia (n=70). We combined the summary statistics from the two EWAS using Stouffer's method for meta-analysis [38]. The two EWAS summary statistics presented consistent DNAm-GA correlations across 441,870 autosomal CpGs (Figure 5A).
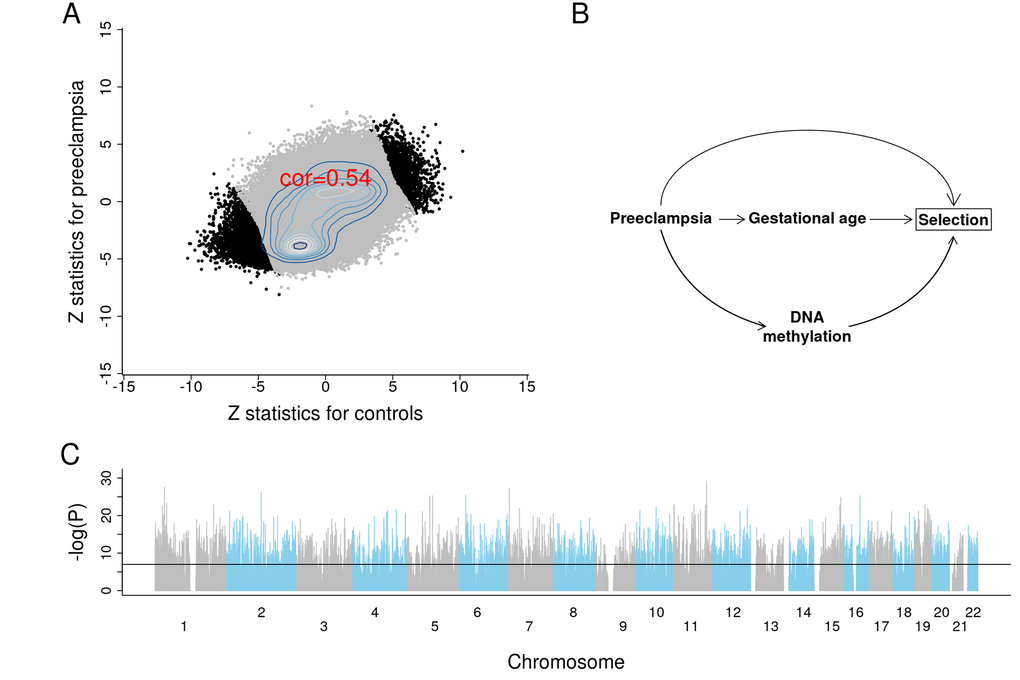
Figure 5. Results of EWAS and potential confounding between DNA methylation and gestational age due to selection bias. (A) Scatter plots between Z scores from controls and Z scores from preeclampsia. (B) The depicted minimal causal diagram under the null hypothesis of no effect of GA on DNAm. Here, the pregnancy condition (preeclampsia) would induce a spurious association between DNAm and GA, because preeclampsia could prompt earlier delivery (shorter GA) and influence DNAm. Note that the association between GA and DNAm is not due to a direct causal relationship between DNAm and GA. Rather, the association is confounded by preeclampsia. If the selection criteria differ substantially across studies, the placental clock models may not perform well. (C) EWAS Manhattan plot of GA.
Strikingly, 10,827 CpG sites exhibit a genome-wide significant correlation with GA (P<1E-07; Figure 5C, Supplementary File 2). Among these sites, 5,940 were in CpGs islands, 262 were in the north shelf, 1,165 in the north shore, 241 in the south shelf, and 902 in the south shore. The top four genes with the largest number of significant CpG sites were MAD1L1 (17 CpGs), BRD2 (13 CpGs), INPP5A (12 CpGs) and RPTOR (9 CpGs). The top 25 CpG sites and their nearest gene(s) are reported in Table 2.
Table 2. The top 25 CpG sites associated with GA.
| CpG | Gene | Chr | Relation to UCSC CpG Island | UCSC RefGene Group | Meta Z (P) (n=901) | Z (P) of Control (n=831) | Z (P) of Preeclampsia (n=70) |
| cg23034799 | CADM1 | 11 | Island | TSS200 | -11.4 (7E-30) | -10.3 (6E-23) | -4.9 (2E-06) |
| cg03418552 | CADM1 | 11 | Island | TSS200 | -10.1 (6E-24) | -9.4 (8E-20) | -3.9 (2E-04) |
| cg21155609 | FAM167B | 1 | N_Shore | 1stExon | 11. (3E-28) | 10.2 (1E-22) | 4.4 (2E-05) |
| cg27339550 | ZNF853 | 7 | Island | TSS1500 | -10.9 (7E-28) | -9.2 (4E-19) | -5.9 (1E-08) |
| cg20025003 | TFCP2L1 | 2 | Island | TSS200 | -10.8 (4E-27) | -9.5 (6E-20) | -5.2 (6E-07) |
| cg02215898 | 6 | Island | -10.6 (3E-26) | -10.1 (2E-22) | -3.7 (3E-04) | ||
| cg11544721 | CETN3 | 5 | Island | Body | -10.5 (5E-26) | -10. (4E-22) | -3.7 (3E-04) |
| cg01152986 | SETD6;SETD6 | 16 | Island | TSS200 | -10.5 (5E-26) | -9.7 (7E-21) | -4.2 (4E-05) |
| cg08757742 | RASGRF2 | 5 | Island | TSS200 | -10.5 (6E-26) | -9.2 (6E-19) | -5.2 (6E-07) |
| cg26662656 | 15 | N_Shelf | 10.5 (1E-25) | 8.2 (1E-15) | 6.7 (2E-10) | ||
| cg13458335 | BMP8B | 1 | Island | TSS1500 | -10.1 (6E-24) | -9. (2E-18) | -4.6 (8E-06) |
| cg20630277 | MRPL23 | 11 | Island | Body | -10. (1E-23) | -9. (2E-18) | -4.4 (2E-05) |
| cg21908248 | PPP1R15B | 1 | Island | 1stExon | -10. (1E-23) | -9. (4E-18) | -4.5 (1E-05) |
| cg26940573 | ZNF566 | 19 | Island | 1stExon;5'UTR;TSS200 | -10. (1E-23) | -8.8 (9E-18) | -4.7 (5E-06) |
| cg13242525 | FAM86C | 11 | Island | TSS1500 | -10. (1E-23) | -8.2 (2E-15) | -5.9 (2E-08) |
| cg13512138 | CHID1 | 11 | Island | 5'UTR | -10. (2E-23) | -8.8 (1E-17) | -4.7 (4E-06) |
| cg05569874 | SEMA4B | 15 | Island | 5'UTR;1stExon | -10. (2E-23) | -9.3 (2E-19) | -3.8 (2E-04) |
| cg21060796 | LAYN | 11 | Island | Body | -10. (2E-23) | -8.5 (1E-16) | -5.2 (6E-07) |
| cg01103597 | RUNX3 | 1 | Body | 9.9 (3E-23) | 8.5 (1E-16) | 5.1 (7E-07) | |
| cg12799981 | ASCC1;C10orf104 | 10 | N_Shore | 1stExon;5'UTR;TSS1500 | -9.9 (7E-23) | -9.4 (1E-19) | -3.4 (7E-04) |
| cg12888127 | KNTC1;RSRC2 | 12 | Island | TSS1500;TSS200 | -9.9 (7E-23) | -9.2 (4E-19) | -3.7 (3E-04) |
| cg03366925 | GLI3 | 7 | Island | TSS1500 | -9.8 (1E-22) | -8.5 (1E-16) | -4.9 (2E-06) |
| cg19599862 | ZNF226 | 19 | 1stExon;5'UTR | -9.8 (1E-22) | -8.2 (1E-15) | -5.4 (2E-07) | |
| cg16449659 | TIGD4;ARFIP1 | 4 | S_Shore | TSS1500;5'UTR | -9.7 (2E-22) | -9.1 (1E-18) | -3.7 (3E-04) |
| cg27006129 | ZNF114 | 19 | N_Shore | TSS1500 | -9.7 (3E-22) | -7.9 (1E-14) | -5.7 (3E-08) |
The RPC had 36 epigenome-wide significant (P<1E-07) CpG sites, the CPC had 39, and the refined RPC had 32.
Discussion
Using the largest placental training set to date (n=1,102), we developed highly robust molecular estimators of GA. The robust placental epigenetic clock (RPC) is expected to perform well, even when applied to cases with adverse fetal outcomes or pregnancy complications. We developed this clock using a placenta-based training set that included several adverse conditions, including chromosomal abnormalities (trisomy and triploidy), neural tube defects (anencephaly and spinal bifida), intrauterine growth restriction, maternal complications (gestational diabetes and preeclampsia), and chorioamnionitis.
In contrast, the only other published placental clock by Mayne and colleagues was trained on a small training set (n=170). In our independent test set (n=187), Mayne’s clock under/overestimated GA according to pregnancy conditions. (Supplementary Figure S1). These systematic deviations from Mayne's clock might reflect interesting biological effects or technical artifacts (batch effects, normalization methods). Another potential limitation of Mayne’s clock is that the authors limited the eligible CpG sites to the approximately 18,437 autosomal sites on the 27K and 450K bead chips. This might explain why the Mayne’s clock uses only 62 CpG sites, whereas our RPC uses 558.
To infer biological processes under the 558 and 546 CpG sites, we conducted functional gene enrichment analyses using the Genomic Regions Enrichment of Annotation Tool (GREAT, v.3.0 [39],). However, we did not find any significant biological annotations associated with fetal aging. Elastic net regressions automatically select predictive CpG sites of gestational age (GA), but these CpG sites are not always biologically meaningful.
Our study had several limitations. First, the "observed" GA used for building these epigenetic clocks were estimated either by early pregnancy ultrasound or the LMP method. Although early pregnancy ultrasound based on fetal growth is the gold standard in a clinical setting, it is susceptible to variations in fetal size and leads to a systematic underestimation of GA in smaller fetuses [40–42].
There is also a concern that some of the training sets might be subject to systematic confounding due to adverse pregnancy conditions, as is the case for preeclampsia (Figure 5B). GA tends to be overestimated for placentas linked to preeclampsia, which is consistent with the associated pathology of advanced villous maturation, as well as previous reports of molecular signs of advanced aging [17,43]. In this hypothetical example, preeclampsia confounds the association between placental DNAm and GA (Figure 5B [44–46],). However, this type of confounding probably does not affect our placental clocks for the following reasons. First, the CPC for control samples and the refined RPC for uncomplicated term samples also accurately predicted GA even in pregnancies with known complications. Second, our EWAS of GA reveals profound associations between GA and DNA methylation levels even after stratifying the analysis by preeclampsia.
Moreover, it is possible that the RPC and the CPC might not perform well in case of non-live births was because the proportion of non-live births was extremely small amongst the third trimester samples in the training datasets, while unavoidably all first and second trimester samples are non-live births. In addition, it has been suggested that gravidity or parity may change placental physiology (e.g., higher placental weight associated with higher parity [47]) and therefore might modify the relationship between the placental epigenome and GA.
The clinical application of the RPC might be limited, because obtaining placental samples during pregnancy is highly invasive (e.g., chorionic villus sampling [48,49]). However, the existence of a predictive placental clock – the RPC – opens the possibility to develop another epigenetic clock based on cell-free fetal DNA (cffDNA). cffDNA is fragmented from placenta trophoblasts [50,51], and circulates in maternal blood during pregnancy [52]. If the development of a cffDNA clock is successful, clinicians readily estimate GA simply by collecting and analyzing maternal blood anytime during pregnancy.
Methods
Study population
We collected publicly available data from Gene Expression Omnibus (GEO) using the GEOparse Python package (Python 3.6.5: Anaconda, Inc.). Table 1 details each dataset. GSE71678 examined the correlation between placental DNAm and arsenic exposures in the New Hampshire Birth Cohort Study [53]. GSE75248 examined placental DNAm in relation to newborns’ neurobehavioral outcomes [54]. GSE71719 studied the association between DNA hydroxymethylation and gene expression using placental samples [55]. The Robinson laboratory (RL) at the University of British Columbia (Vancouver, BC, Canada) transferred placental DNAm data that are publicly available in the GEO database. GSE100197 and GSE98224 were studies that aimed to find placental DNAm profiles for preeclampsia and intrauterine growth restriction in women recruited at the University of British Columbia Women’s and Children’s Hospital (Vancouver, Canada) and at Mount Sinai Hospital (Toronto, Canada), respectively [56]. GSE108567 investigated batch effects in DNAm micro array data [57]. GSE69502 explored DNAm patterns in multi-tissue samples (placental chorionic villi, kidney, spinal cord, brain, and muscle) from fetuses that were aborted due to neural tube defects [58]. GSE74738 aimed to identify differentially-methylated imprinted regions using a genome-wide approach [59]. GSE115508 compared DNAm patterns in cases of placental inflammation (acute chorioamnionitis) with those in unaffected controls [60]. GSE44667 studied the association between placental DNAm in gene enhancer regions and early-onset preeclampsia [61]. GSE49343 investigated placental DNAm with trisomy and preeclampsia [62]. GSE42409 enhanced probe annotation of Illumina HumanMethylation 450K BeadChip to facilitate biologically meaningful data interpretation [63]. GSE120250 examined the impact of assisted reproductive technology on the placental DNA methylome [64]. GSE70453 conducted epigenome-wide and transcriptome-wide analyses of gestational diabetes [65]. GSE73375 examined DNAm in the preeclamptic placenta in relation to the transforming growth factor beta pathway [66]. GSE75196 studied different DNAm patterns in patients with preeclampsia and unaffected controls [67]. GSE76641 studied the transcriptional and DNAm trajectory of 21 organs during fetal development [68].
Measurement of DNA methylation
Either the Illumina Infinium HumanMethylation450 BeadChip or the Infinium MethylationEPIC BeadChip was used to measure DNAm level at each CpG site. The DNAm level (
Pre-processing of DNA methylation data
We ensured that all samples were included only one time in our training data. Some GEO datasets re-used the same samples or included technical replicates. For example, 154 samples were re-used in GSE100197, GSE108567, GSE69502, GSE74738, GSE44667, GSE49343 and RL data; and 15 technical replicates were found in GSE100197 and RL data. The sample size (N) in Table 1 refers to the counts after excluding the re-used samples and replicates.
We detected and removed outliers using the following steps: 1) we defined a gold standard DNAm profile as the inter-sample median value. For each CpG, we computed the median beta value across all placental samples. 2) The gold standard was correlated with each placental sample to calculate the Pearson correlation coefficient. 3) Placental samples were excluded if their correlation with the gold standard profile was lower than 0.9. Overall, only four putative outliers were removed from the analysis.
Missing DNAm levels were imputed with the gold standard DNAm levels. Thus, if the beta value of a CpG was missing, the missing value was imputed with the interpersonal median value across all samples. These imputations were only implemented in the training data.
Elastic net regression of gestational age
We fit a penalized regression model using the “glmnet” R package [37]. GA was regressed on 441,870 CpG sites that are shared between the 450K and the EPIC array. The glmnet mixing parameter alpha was set to 0.5 (specifying elastic net regression), and the shrinkage parameter, lambda resulting in the minimum mean square error, was chosen using 10-fold cross-validation in the training data. The RPC automatically selected 558 CpG sites (lambda=0.0936), the CPC did 546 CpG sites (lambda=0.0892), the refined RPC did 395 CpG sites (lambda=0.0116), and the fetal sex-classifier did 220 CpGs (lambda=0.0073). The number of overlapping CpGs between the RPC and CPC was 199. Supplementary File 1 includes CpG sites and their corresponding coefficients for the RPC, CPC, refined RPC and fetal sex-classifier.
Epigenome-wide association study of gestational age
We used the R function "standardScreeningNumericTrait" from the weighted gene co-expression network analysis R package (WGCNA [69];) to carry out a robust correlation test (based on the biweight midcorrelation) between each CpG and GA. We conducted two separate EWAS of GA: one in control placental samples (n=831) and the other in placental samples from preeclampsia cases (n=70). We computed biweight midcorrelations between DNAm levels and GA, and the corresponding Z statistics and p-values in each stratum. The Z statistics of the two sets of EWAS were combined using the weighted Stouffer’s method [38] as:
Software availability
The coefficient values of the placental clocks and the fetal sex classifier can be found in Supplementary File 1.
Abbreviations
GA: gestational age; DNAm: DNA methylation; LMP: last menstrual period; RPC: robust placental clock; CPC: control placental clock; GEO: Gene Expression Omnibus; 450K: Illumina HumanMethylation 450K BeadChip; EPIC: Illumina MethylationEPIC BeadChip; MAE: median absolute error; funNorm: functional normalization; SWAN: subset-quantiles within arrays; noob: normal-exponential out-of-band; BMIQ: beta-mixture quantile dilation; quanNorm: quantile normalization; dasen: data-driven separate normalization; WGCNA: weighted gene co-expression network analysis; EWAS: epigenome-wide association study; cffDNA: cell-free fetal DNA.
Author Contributions
YL and SH developed the placental clocks and wrote the manuscript. The remaining authors contributed data, edited the manuscript, and interpreted the results.
Acknowledgements
We appreciate all the placenta donors and GEO submitters for making their placental DNAm data publicly available.
Conflicts of Interest
The authors declare no conflicts of interest.
Funding
This work is partly supported by a grant from the Norwegian Research Council (NRC) to AJ (project number 262043) and additional funding to YL from the NRC through a Personal Overseas Research Grant (project number 262043/F20).
SH acknowledges support from the National Institutes of Health (NIH) (1U01AG060908 – 01).
Research reported in this publication was supported by the National Cancer Institute of the National Institutes of Health under Award Number K07CA225856 (to AMB). The content is solely the responsibility of the authors and does not necessarily represent the official views of the National Institutes of Health.
The work of JB, HKG, JRH, PM, AJ was supported by the Research Council of Norway Center of Excellence funding scheme (Grant 262700). The funding body played no role in the design of the study, analysis or interpretation of data, nor in writing the manuscript.
The work of VY and WPR was supported by the National Institutes of Health (to WPR; RFN 5R01HD089713-04).
References
- 1. Engle WA. Morbidity and mortality in late preterm and early term newborns: a continuum. Clin Perinatol. 2011; 38:493–516. https://doi.org/10.1016/j.clp.2011.06.009 [PubMed]
- 2. Hansen AK, Wisborg K, Uldbjerg N, Henriksen TB. Risk of respiratory morbidity in term infants delivered by elective caesarean section: cohort study. BMJ. 2008; 336:85–87. https://doi.org/10.1136/bmj.39405.539282.BE [PubMed]
- 3. Young PC, Glasgow TS, Li X, Guest-Warnick G, Stoddard G. Mortality of late-preterm (near-term) newborns in Utah. Pediatrics. 2007; 119:e659–65. https://doi.org/10.1542/peds.2006-2486 [PubMed]
- 4. Davis EP, Buss C, Muftuler LT, Head K, Hasso A, Wing DA, Hobel C, Sandman CA. Children’s Brain Development Benefits from Longer Gestation. Front Psychol. 2011; 2:1. https://doi.org/10.3389/fpsyg.2011.00001 [PubMed]
- 5. Parikh LI, Reddy UM, Männistö T, Mendola P, Sjaarda L, Hinkle S, Chen Z, Lu Z, Laughon SK. Neonatal outcomes in early term birth. Am J Obstet Gynecol. 2014; 211:265.e1–11. https://doi.org/10.1016/j.ajog.2014.03.021 [PubMed]
- 6. Yang S, Platt RW, Kramer MS. Variation in child cognitive ability by week of gestation among healthy term births. Am J Epidemiol. 2010; 171:399–406. https://doi.org/10.1093/aje/kwp413 [PubMed]
- 7. Organization WH. Born too soon: the global action report on preterm birth. 2012. .
- 8. Lynch CD, Zhang J. The research implications of the selection of a gestational age estimation method. Paediatr Perinat Epidemiol. 2007 (Suppl 2); 21:86–96. https://doi.org/10.1111/j.1365-3016.2007.00865.x [PubMed]
- 9. Robinson HP, Fleming JE. A critical evaluation of sonar “crown-rump length” measurements. Br J Obstet Gynaecol. 1975; 82:702–10. https://doi.org/10.1111/j.1471-0528.1975.tb00710.x [PubMed]
- 10. Papageorghiou AT, Kemp B, Stones W, Ohuma EO, Kennedy SH, Purwar M, Salomon LJ, Altman DG, Noble JA, Bertino E, Gravett MG, Pang R, Cheikh Ismail L, et al, and International Fetal and Newborn Growth Consortium for the 21st Century (INTERGROWTH-21st). Ultrasound-based gestational-age estimation in late pregnancy. Ultrasound Obstet Gynecol. 2016; 48:719–26. https://doi.org/10.1002/uog.15894 [PubMed]
- 11. Papageorghiou AT, Kennedy SH, Salomon LJ, Ohuma EO, Cheikh Ismail L, Barros FC, Lambert A, Carvalho M, Jaffer YA, Bertino E, Gravett MG, Altman DG, Purwar M, et al, and International Fetal and Newborn Growth Consortium for the 21st Century (INTERGROWTH-21st). International standards for early fetal size and pregnancy dating based on ultrasound measurement of crown-rump length in the first trimester of pregnancy. Ultrasound Obstet Gynecol. 2014; 44:641–48. https://doi.org/10.1002/uog.13448 [PubMed]
- 12. Campbell S, Newman GB. Growth of the fetal biparietal diameter during normal pregnancy. J Obstet Gynaecol Br Commonw. 1971; 78:513–19. https://doi.org/10.1111/j.1471-0528.1971.tb00309.x [PubMed]
- 13. Hadlock FP, Deter RL, Harrist RB, Park SK. Fetal biparietal diameter: a critical re-evaluation of the relation to menstrual age by means of real-time ultrasound. J Ultrasound Med. 1982; 1:97–104. https://doi.org/10.7863/jum.1982.1.3.97 [PubMed]
- 14. Kurtz AB, Wapner RJ, Kurtz RJ, Dershaw DD, Rubin CS, Cole-Beuglet C, Goldberg BB. Analysis of biparietal diameter as an accurate indicator of gestational age. J Clin Ultrasound. 1980; 8:319–26. https://doi.org/10.1002/jcu.1870080406 [PubMed]
- 15. Campbell S, Thoms A. Ultrasound measurement of the fetal head to abdomen circumference ratio in the assessment of growth retardation. Br J Obstet Gynaecol. 1977; 84:165–74. https://doi.org/10.1111/j.1471-0528.1977.tb12550.x [PubMed]
- 16. Mongelli M, Wilcox M, Gardosi J. Estimating the date of confinement: ultrasonographic biometry versus certain menstrual dates. Am J Obstet Gynecol. 1996; 174:278–81. https://doi.org/10.1016/S0002-9378(96)70408-8 [PubMed]
- 17. Mayne BT, Leemaqz SY, Smith AK, Breen J, Roberts CT, Bianco-Miotto T. Accelerated placental aging in early onset preeclampsia pregnancies identified by DNA methylation. Epigenomics. 2017; 9:279–89. https://doi.org/10.2217/epi-2016-0103 [PubMed]
- 18. Mikheev AM, Nabekura T, Kaddoumi A, Bammler TK, Govindarajan R, Hebert MF, Unadkat JD. Profiling gene expression in human placentae of different gestational ages: an OPRU Network and UW SCOR Study. Reprod Sci. 2008; 15:866–77. https://doi.org/10.1177/1933719108322425 [PubMed]
- 19. Sitras V, Fenton C, Paulssen R, Vårtun Å, Acharya G. Differences in gene expression between first and third trimester human placenta: a microarray study. PLoS One. 2012; 7:e33294. https://doi.org/10.1371/journal.pone.0033294 [PubMed]
- 20. Uusküla L, Männik J, Rull K, Minajeva A, Kõks S, Vaas P, Teesalu P, Reimand J, Laan M. Mid-gestational gene expression profile in placenta and link to pregnancy complications. PLoS One. 2012; 7:e49248. https://doi.org/10.1371/journal.pone.0049248 [PubMed]
- 21. Winn VD, Haimov-Kochman R, Paquet AC, Yang YJ, Madhusudhan MS, Gormley M, Feng KT, Bernlohr DA, McDonagh S, Pereira L, Sali A, Fisher SJ. Gene expression profiling of the human maternal-fetal interface reveals dramatic changes between midgestation and term. Endocrinology. 2007; 148:1059–79. https://doi.org/10.1210/en.2006-0683 [PubMed]
- 22. Novakovic B, Yuen RK, Gordon L, Penaherrera MS, Sharkey A, Moffett A, Craig JM, Robinson WP, Saffery R. Evidence for widespread changes in promoter methylation profile in human placenta in response to increasing gestational age and environmental/stochastic factors. BMC Genomics. 2011; 12:529. https://doi.org/10.1186/1471-2164-12-529 [PubMed]
- 23. Horvath S. DNA methylation age of human tissues and cell types. Genome Biol. 2013; 14:R115. https://doi.org/10.1186/gb-2013-14-10-r115 [PubMed]
- 24. Bohlin J, Håberg SE, Magnus P, Reese SE, Gjessing HK, Magnus MC, Parr CL, Page CM, London SJ, Nystad W. Prediction of gestational age based on genome-wide differentially methylated regions. Genome Biol. 2016; 17:207. https://doi.org/10.1186/s13059-016-1063-4 [PubMed]
- 25. Knight AK, Craig JM, Theda C, Bækvad-Hansen M, Bybjerg-Grauholm J, Hansen CS, Hollegaard MV, Hougaard DM, Mortensen PB, Weinsheimer SM, Werge TM, Brennan PA, Cubells JF, et al. An epigenetic clock for gestational age at birth based on blood methylation data. Genome Biol. 2016; 17:206. https://doi.org/10.1186/s13059-016-1068-z [PubMed]
- 26. Zou H, Hastie T. Regularization and variable selection via the elastic net. J R Stat Soc Series B Stat Methodol. 2005; 67:301–20. https://doi.org/10.1111/j.1467-9868.2005.00503.x
- 27. Fortin JP, Labbe A, Lemire M, Zanke BW, Hudson TJ, Fertig EJ, Greenwood CM, Hansen KD. Functional normalization of 450k methylation array data improves replication in large cancer studies. Genome Biol. 2014; 15:503. https://doi.org/10.1186/s13059-014-0503-2 [PubMed]
- 28. Maksimovic J, Gordon L, Oshlack A. SWAN: subset-quantile within array normalization for illumina infinium HumanMethylation450 BeadChips. Genome Biol. 2012; 13:R44. https://doi.org/10.1186/gb-2012-13-6-r44 [PubMed]
- 29. Triche TJ
Jr , Weisenberger DJ, Van Den Berg D, Laird PW, Siegmund KD. Low-level processing of Illumina Infinium DNA Methylation BeadArrays. Nucleic Acids Res. 2013; 41:e90. https://doi.org/10.1093/nar/gkt090 [PubMed] - 30. Teschendorff AE, Marabita F, Lechner M, Bartlett T, Tegner J, Gomez-Cabrero D, Beck S. A beta-mixture quantile normalization method for correcting probe design bias in Illumina Infinium 450 k DNA methylation data. Bioinformatics. 2013; 29:189–96. https://doi.org/10.1093/bioinformatics/bts680 [PubMed]
- 31. Aryee MJ, Jaffe AE, Corrada-Bravo H, Ladd-Acosta C, Feinberg AP, Hansen KD, Irizarry RA. Minfi: a flexible and comprehensive Bioconductor package for the analysis of Infinium DNA methylation microarrays. Bioinformatics. 2014; 30:1363–69. https://doi.org/10.1093/bioinformatics/btu049 [PubMed]
- 32. Touleimat N, Tost J. Complete pipeline for Infinium(®) Human Methylation 450K BeadChip data processing using subset quantile normalization for accurate DNA methylation estimation. Epigenomics. 2012; 4:325–41. https://doi.org/10.2217/epi.12.21 [PubMed]
- 33. Pidsley R, Y Wong CC, Volta M, Lunnon K, Mill J, Schalkwyk LC. A data-driven approach to preprocessing Illumina 450K methylation array data. BMC Genomics. 2013; 14:293. https://doi.org/10.1186/1471-2164-14-293 [PubMed]
- 34. Hannum G, Guinney J, Zhao L, Zhang L, Hughes G, Sadda S, Klotzle B, Bibikova M, Fan JB, Gao Y, Deconde R, Chen M, Rajapakse I, et al. Genome-wide methylation profiles reveal quantitative views of human aging rates. Mol Cell. 2013; 49:359–67. https://doi.org/10.1016/j.molcel.2012.10.016 [PubMed]
- 35. Levine ME, Lu AT, Quach A, Chen BH, Assimes TL, Bandinelli S, Hou L, Baccarelli AA, Stewart JD, Li Y, Whitsel EA, Wilson JG, Reiner AP, et al. An epigenetic biomarker of aging for lifespan and healthspan. Aging (Albany NY). 2018; 10:573–91. https://doi.org/10.18632/aging.101414 [PubMed]
- 36. Horvath S, Oshima J, Martin GM, Lu AT, Quach A, Cohen H, Felton S, Matsuyama M, Lowe D, Kabacik S, Wilson JG, Reiner AP, Maierhofer A, et al. Epigenetic clock for skin and blood cells applied to Hutchinson Gilford Progeria Syndrome and ex vivo studies. Aging (Albany NY). 2018; 10:1758–75. https://doi.org/10.18632/aging.101508 [PubMed]
- 37. Friedman J, Hastie T, Tibshirani R. Regularization Paths for Generalized Linear Models via Coordinate Descent. J Stat Softw. 2010; 33:1–22. https://doi.org/10.18637/jss.v033.i01 [PubMed]
- 38. Stouffer SA, Suchman EA, DeVinney LC, Star SA, Williams RM Jr. (1949). The American soldier: Adjustment during army life. (Studies in social psychology in World War II), Vol. 1.
- 39. McLean CY, Bristor D, Hiller M, Clarke SL, Schaar BT, Lowe CB, Wenger AM, Bejerano G. GREAT improves functional interpretation of cis-regulatory regions. Nat Biotechnol. 2010; 28:495–501. https://doi.org/10.1038/nbt.1630 [PubMed]
- 40. Dietz PM, England LJ, Callaghan WM, Pearl M, Wier ML, Kharrazi M. A comparison of LMP-based and ultrasound-based estimates of gestational age using linked California livebirth and prenatal screening records. Paediatr Perinat Epidemiol. 2007 (Suppl 2); 21:62–71. https://doi.org/10.1111/j.1365-3016.2007.00862.x [PubMed]
- 41. Henriksen TB, Wilcox AJ, Hedegaard M, Secher NJ. Bias in studies of preterm and postterm delivery due to ultrasound assessment of gestational age. Epidemiology. 1995; 6:533–37. https://doi.org/10.1097/00001648-199509000-00012 [PubMed]
- 42. Morin I, Morin L, Zhang X, Platt RW, Blondel B, Bréart G, Usher R, Kramer MS. Determinants and consequences of discrepancies in menstrual and ultrasonographic gestational age estimates. BJOG. 2005; 112:145–52. https://doi.org/10.1111/j.1471-0528.2004.00311.x [PubMed]
- 43. Leavey K, Benton SJ, Grynspan D, Bainbridge SA, Morgen EK, Cox BJ. Gene markers of normal villous maturation and their expression in placentas with maturational pathology. Placenta. 2017; 58:52–59. https://doi.org/10.1016/j.placenta.2017.08.005 [PubMed]
- 44. Jia RZ, Zhang X, Hu P, Liu XM, Hua XD, Wang X, Ding HJ. Screening for differential methylation status in human placenta in preeclampsia using a CpG island plus promoter microarray. Int J Mol Med. 2012; 30:133–41. https://doi.org/10.3892/ijmm.2012.983 [PubMed]
- 45. Kulkarni A, Chavan-Gautam P, Mehendale S, Yadav H, Joshi S. Global DNA methylation patterns in placenta and its association with maternal hypertension in pre-eclampsia. DNA Cell Biol. 2011; 30:79–84. https://doi.org/10.1089/dna.2010.1084 [PubMed]
- 46. Yuen RK, Peñaherrera MS, von Dadelszen P, McFadden DE, Robinson WP. DNA methylation profiling of human placentas reveals promoter hypomethylation of multiple genes in early-onset preeclampsia. Eur J Hum Genet. 2010; 18:1006–12. https://doi.org/10.1038/ejhg.2010.63 [PubMed]
- 47. Wallace JM, Bhattacharya S, Horgan GW. Gestational age, gender and parity specific centile charts for placental weight for singleton deliveries in Aberdeen, UK. Placenta. 2013; 34:269–74. https://doi.org/10.1016/j.placenta.2012.12.007 [PubMed]
- 48. Kazy Z, Rozovsky IS, Bakharev VA. Chorion biopsy in early pregnancy: A method of early prenatal diagnosis for inherited disorders. Prenat Diagn. 1982; 2:39–45. https://doi.org/10.1002/pd.1970020107
- 49. Ward RH, Modell B, Petrou M, Karagözlu F, Douratsos E. Method of sampling chorionic villi in first trimester of pregnancy under guidance of real time ultrasound. Br Med J (Clin Res Ed). 1983; 286:1542–44. https://doi.org/10.1136/bmj.286.6377.1542 [PubMed]
- 50. Alberry M, Maddocks D, Jones M, Abdel Hadi M, Abdel-Fattah S, Avent N, Soothill PW. Free fetal DNA in maternal plasma in anembryonic pregnancies: confirmation that the origin is the trophoblast. Prenat Diagn. 2007; 27:415–18. https://doi.org/10.1002/pd.1700 [PubMed]
- 51. Gupta AK, Holzgreve W, Huppertz B, Malek A, Schneider H, Hahn S. Detection of fetal DNA and RNA in placenta-derived syncytiotrophoblast microparticles generated in vitro. Clin Chem. 2004; 50:2187–90. https://doi.org/10.1373/clinchem.2004.040196 [PubMed]
- 52. Lo YM, Tein MS, Lau TK, Haines CJ, Leung TN, Poon PM, Wainscoat JS, Johnson PJ, Chang AM, Hjelm NM. Quantitative analysis of fetal DNA in maternal plasma and serum: implications for noninvasive prenatal diagnosis. Am J Hum Genet. 1998; 62:768–75. https://doi.org/10.1086/301800 [PubMed]
- 53. Green BB, Karagas MR, Punshon T, Jackson BP, Robbins DJ, Houseman EA, Marsit CJ. Epigenome-Wide Assessment of DNA Methylation in the Placenta and Arsenic Exposure in the New Hampshire Birth Cohort Study (USA). Environ Health Perspect. 2016; 124:1253–60. https://doi.org/10.1289/ehp.1510437 [PubMed]
- 54. Paquette AG, Houseman EA, Green BB, Lesseur C, Armstrong DA, Lester B, Marsit CJ. Regions of variable DNA methylation in human placenta associated with newborn neurobehavior. Epigenetics. 2016; 11:603–13. https://doi.org/10.1080/15592294.2016.1195534 [PubMed]
- 55. Green BB, Houseman EA, Johnson KC, Guerin DJ, Armstrong DA, Christensen BC, Marsit CJ. Hydroxymethylation is uniquely distributed within term placenta, and is associated with gene expression. FASEB J. 2016; 30:2874–84. https://doi.org/10.1096/fj.201600310R [PubMed]
- 56. Wilson SL, Leavey K, Cox BJ, Robinson WP. Mining DNA methylation alterations towards a classification of placental pathologies. Hum Mol Genet. 2018; 27:135–46. https://doi.org/10.1093/hmg/ddx391 [PubMed]
- 57. Price EM, Robinson WP. Adjusting for Batch Effects in DNA Methylation Microarray Data, a Lesson Learned. Front Genet. 2018; 9:83. https://doi.org/10.3389/fgene.2018.00083 [PubMed]
- 58. Price EM, Peñaherrera MS, Portales-Casamar E, Pavlidis P, Van Allen MI, McFadden DE, Robinson WP. Profiling placental and fetal DNA methylation in human neural tube defects. Epigenetics Chromatin. 2016; 9:6. https://doi.org/10.1186/s13072-016-0054-8 [PubMed]
- 59. Hanna CW, Peñaherrera MS, Saadeh H, Andrews S, McFadden DE, Kelsey G, Robinson WP. Pervasive polymorphic imprinted methylation in the human placenta. Genome Res. 2016; 26:756–67. https://doi.org/10.1101/gr.196139.115 [PubMed]
- 60. Konwar C, Price EM, Wang LQ, Wilson SL, Terry J, Robinson WP. DNA methylation profiling of acute chorioamnionitis-associated placentas and fetal membranes: insights into epigenetic variation in spontaneous preterm births. Epigenetics Chromatin. 2018; 11:63. https://doi.org/10.1186/s13072-018-0234-9 [PubMed]
- 61. Blair JD, Yuen RK, Lim BK, McFadden DE, von Dadelszen P, Robinson WP. Widespread DNA hypomethylation at gene enhancer regions in placentas associated with early-onset pre-eclampsia. Mol Hum Reprod. 2013; 19:697–708. https://doi.org/10.1093/molehr/gat044 [PubMed]
- 62. Blair JD, Langlois S, McFadden DE, Robinson WP. Overlapping DNA methylation profile between placentas with trisomy 16 and early-onset preeclampsia. Placenta. 2014; 35:216–22. https://doi.org/10.1016/j.placenta.2014.01.001 [PubMed]
- 63. Price ME, Cotton AM, Lam LL, Farré P, Emberly E, Brown CJ, Robinson WP, Kobor MS. Additional annotation enhances potential for biologically-relevant analysis of the Illumina Infinium HumanMethylation450 BeadChip array. Epigenetics Chromatin. 2013; 6:4. https://doi.org/10.1186/1756-8935-6-4 [PubMed]
- 64. Choufani S, Turinsky AL, Melamed N, Greenblatt E, Brudno M, Bérard A, Fraser WD, Weksberg R, Trasler J, Monnier P, Fraser WD, Audibert F, Dubois L, et al, and 3D cohort study group. Impact of assisted reproduction, infertility, sex and paternal factors on the placental DNA methylome. Hum Mol Genet. 2019; 28:372–85. https://doi.org/10.1093/hmg/ddy321 [PubMed]
- 65. Binder AM, LaRocca J, Lesseur C, Marsit CJ, Michels KB. Epigenome-wide and transcriptome-wide analyses reveal gestational diabetes is associated with alterations in the human leukocyte antigen complex. Clin Epigenetics. 2015; 7:79. https://doi.org/10.1186/s13148-015-0116-y [PubMed]
- 66. Martin E, Ray PD, Smeester L, Grace MR, Boggess K, Fry RC. Epigenetics and Preeclampsia: Defining Functional Epimutations in the Preeclamptic Placenta Related to the TGF-β Pathway. PLoS One. 2015; 10:e0141294. https://doi.org/10.1371/journal.pone.0141294 [PubMed]
- 67. Yeung KR, Chiu CL, Pidsley R, Makris A, Hennessy A, Lind JM. DNA methylation profiles in preeclampsia and healthy control placentas. Am J Physiol Heart Circ Physiol. 2016; 310:H1295–303. https://doi.org/10.1152/ajpheart.00958.2015 [PubMed]
- 68. Roost MS, Slieker RC, Bialecka M, van Iperen L, Gomes Fernandes MM, He N, Suchiman HE, Szuhai K, Carlotti F, de Koning EJ, Mummery CL, Heijmans BT, Chuva de Sousa Lopes SM. DNA methylation and transcriptional trajectories during human development and reprogramming of isogenic pluripotent stem cells. Nat Commun. 2017; 8:908. https://doi.org/10.1038/s41467-017-01077-3 [PubMed]
- 69. Langfelder P, Horvath S. WGCNA: an R package for weighted correlation network analysis. BMC Bioinformatics. 2008; 9:559. https://doi.org/10.1186/1471-2105-9-559 [PubMed]