


Introduction
Tumor heterogeneity often reduces the efficacy of both non-targeted and genome-driven targeted cancer therapies [1–4]. Deregulated cellular metabolism is a trait shared by virtually all tumor cells across multiple cancer types, and might be exploited to bypass this therapeutic limitation [5–8]. However, given the intrinsic metabolic flexibility of cancer cells, targeting specific metabolic pathways might be just as challenging as targeting somatic mutations, if not more so [9–13]. A higher anti-cancer potential might arise from combining standard treatments with specific dietary interventions which, by changing the levels of certain host metabolites, would restrict the usage of alternative signaling and metabolic nodes by cancer cells [14]. Although originally assumed not to be relevant, the possibility that specific dietary interventions can influence the outcome of some cancer treatments is beginning to be recognized in pre-clinical and clinical scenarios.
Restriction of the amino acids serine and glycine in the diet increases the survival of cancer-prone mice [15], and provides a plausible explanation for the recognized anti-cancer effects of low-protein diets or dietary restriction [16]. Furthermore, the high-fat low-protein/carbohydrate ketogenic diet (KD), which increases blood ketones such as β-hydroxybutyrate (BHBA) and decreases blood glucose by simulating the physiological response to fasting, greatly enhances the efficacy/toxicity ratios of PI3K inhibitors in animal models [17]. Finally, the efficacy of lower, non-toxic doses of the anti-folate methotrexate can be improved through a simple dietary supplementation of histidine [18]. Such experimental confirmation that harnessing dietary metabolic pathways can augment the effects of cancer drugs has received a high degree of social media attention as it highlights that a careful scientific examination of diet as (complementary) medicine is long overdue in oncology. Not surprisingly, combinations of dietary approaches including fasting or low-calorie fasting-mimicking diets (FMD) and KD with chemotherapy, immunotherapy or other cancer treatments are beginning to be viewed as potentially promising strategies to reduce treatment-related adverse effects and boost efficacy outcomes [14]. However, it should be acknowledged that an established indication of FMD or KD, which could decrease protein-calorie intake during oncology treatments, is not yet available and caution has been raised given the prevalence of malnutrition and sarcopenia in patients with cancer [19].
An alternative to this “drug plus diet” approach is the use of pharmacological interventions with low toxicity profiles that can reproduce the metabolic features associated with these diets (e.g., lowering glucose/insulin/IGF1 and increasing ketone bodies). One such pharmacological mimetic is metformin, a biguanide drug commonly used to treat type 2 diabetes and which was originally identified as a putative dietary restriction-mimetic that reproduced the hepatic gene expression profiles shaped by long-term calorie restriction in mice [20,21]. Global metabolomic profiling suggests that metformin might promote a KD-like signature of fatty acid oxidation involving significant increases of BHBA and also of tricarboxylic acid (TCA) cycle intermediates in patients with endometrial cancer [22] and in people with Li-Fraumeni syndrome, who are predisposed to various cancers [23]. Although a few studies have explored the metformin-related metabolic responses in ovarian cancer patients who were receiving metformin for diabetes [24], or in treatment-naïve preoperative window clinical trials in endometrial and breast cancer [22,25], there is no evidence of the impact of adding metformin to established treatment regimens on systemic metabolic markers in everyday oncology practice.
Here we explored the impact of metformin on serum metabolic profiles of patients participating in the METTEN study, a phase 2 clinical trial of HER2-positive breast cancer patients randomized to receive either metformin combined with anthracycline/taxane-based chemotherapy and trastuzumab or an equivalent regimen without metformin, before surgery [26]. A panel of 11 metabolites was selected based on the DR-mimetic [22] and one-carbon (1C) metabolism anti-folate-like activities of metformin [27–30], and included BHBA and the key TCA cycle intermediate α-ketoglutarate, and also intermediates or products of 1C metabolism (i.e., cystathionine, taurine, betaine, choline, dimethylglycine, homocysteine, methionine, s-adenosyl methionine [SAM], and s-adenosyl homocysteine [SAH]).
Results
Study participants
To investigate the metabolic changes associated with adding metformin to an anthracycline/taxane-based chemotherapy and trastuzumab regimen, we conducted the present study with paired baseline and post-treatment serum samples collected from 68 patients belonging to the intention-to-treat population of the METTEN trial, which included randomly assigned patients receiving at least one dose of study medication [26]. The baseline characteristics of these patients are shown in Table 1. The comparison of clinical-pathological variables of each cohort revealed no significant differences.
Table 1. Baseline patient demographic and tumor characteristics.
| Metformin arm (n=33) | Standard arm (n=35) | p-value | |||||||||||||||||||||||||||||||||||||||||||||||||||||||||||||||||||||||||||||||||||||||||||||||||
| Age (years) | 0.649 | ||||||||||||||||||||||||||||||||||||||||||||||||||||||||||||||||||||||||||||||||||||||||||||||||||
| <50 | 18 (54.5%) | 21 (60.0%) | |||||||||||||||||||||||||||||||||||||||||||||||||||||||||||||||||||||||||||||||||||||||||||||||||
| ≥50 | 15 (45.5%) | 14 (40.0%) | |||||||||||||||||||||||||||||||||||||||||||||||||||||||||||||||||||||||||||||||||||||||||||||||||
| Mean ± SD (range) | 48.6 ± 10.2 (32–75) | 49.1 ± 11.0 (30–72) | 0.843 | ||||||||||||||||||||||||||||||||||||||||||||||||||||||||||||||||||||||||||||||||||||||||||||||||
| Menopausal status | 0.772 | ||||||||||||||||||||||||||||||||||||||||||||||||||||||||||||||||||||||||||||||||||||||||||||||||||
| Post | 13 (39.4%) | 15 (42.9%) | |||||||||||||||||||||||||||||||||||||||||||||||||||||||||||||||||||||||||||||||||||||||||||||||||
| Pre | 20 (60.6%) | 20 (57.1%) | |||||||||||||||||||||||||||||||||||||||||||||||||||||||||||||||||||||||||||||||||||||||||||||||||
| Body weight (kg) | |||||||||||||||||||||||||||||||||||||||||||||||||||||||||||||||||||||||||||||||||||||||||||||||||||
| Mean ± SD (range) | 65.8 ± 7.8 (52–89) | 65.3 ± 9.6 (48–83) | 0.806 | ||||||||||||||||||||||||||||||||||||||||||||||||||||||||||||||||||||||||||||||||||||||||||||||||
| Body mass index | 0.467 | ||||||||||||||||||||||||||||||||||||||||||||||||||||||||||||||||||||||||||||||||||||||||||||||||||
| <25 | 18 (54.5%) | 16 (45.7%) | |||||||||||||||||||||||||||||||||||||||||||||||||||||||||||||||||||||||||||||||||||||||||||||||||
| ≥25 (overweight) | 15 (45.5%) | 19 (54.4%) | |||||||||||||||||||||||||||||||||||||||||||||||||||||||||||||||||||||||||||||||||||||||||||||||||
| Clinical tumor status | 0.7501 | ||||||||||||||||||||||||||||||||||||||||||||||||||||||||||||||||||||||||||||||||||||||||||||||||||
| cT2 | 21 (63.6%) | 21 (60.0%) | |||||||||||||||||||||||||||||||||||||||||||||||||||||||||||||||||||||||||||||||||||||||||||||||||
| cT3 | 11 (33.3%) | 10 (28.6%) | |||||||||||||||||||||||||||||||||||||||||||||||||||||||||||||||||||||||||||||||||||||||||||||||||
| cT4b | 1 (3.0%) | 3 (8.6%) | |||||||||||||||||||||||||||||||||||||||||||||||||||||||||||||||||||||||||||||||||||||||||||||||||
| cT4d | 0 (0.0%) | 1 (2.9%) | |||||||||||||||||||||||||||||||||||||||||||||||||||||||||||||||||||||||||||||||||||||||||||||||||
| Clinical nodal stage | 0.4141 | ||||||||||||||||||||||||||||||||||||||||||||||||||||||||||||||||||||||||||||||||||||||||||||||||||
| cN0 | 8 (24.2%) | 11 (31.4%) | |||||||||||||||||||||||||||||||||||||||||||||||||||||||||||||||||||||||||||||||||||||||||||||||||
| cN1 | 21 (63.6%) | 16 (45.7%) | |||||||||||||||||||||||||||||||||||||||||||||||||||||||||||||||||||||||||||||||||||||||||||||||||
| cN2 | 1 (3.0%) | 4 (11.4%) | |||||||||||||||||||||||||||||||||||||||||||||||||||||||||||||||||||||||||||||||||||||||||||||||||
| cN3 | 3 (9.1%) | 4 (11.4%) | |||||||||||||||||||||||||||||||||||||||||||||||||||||||||||||||||||||||||||||||||||||||||||||||||
| Hormone receptor status | 1.000 | ||||||||||||||||||||||||||||||||||||||||||||||||||||||||||||||||||||||||||||||||||||||||||||||||||
| ER and/or PgR positive | 18 (54.5%) | 19 (54.3%) | |||||||||||||||||||||||||||||||||||||||||||||||||||||||||||||||||||||||||||||||||||||||||||||||||
| ER and PR negative | 15 (45.5%) | 16 (45.7%) | |||||||||||||||||||||||||||||||||||||||||||||||||||||||||||||||||||||||||||||||||||||||||||||||||
| Tumor grade | 0.4671 | ||||||||||||||||||||||||||||||||||||||||||||||||||||||||||||||||||||||||||||||||||||||||||||||||||
| G1 | 2 (7.7%) | 0 (0.0%) | |||||||||||||||||||||||||||||||||||||||||||||||||||||||||||||||||||||||||||||||||||||||||||||||||
| G2 | 12 (46.2%) | 14 (48.3%) | |||||||||||||||||||||||||||||||||||||||||||||||||||||||||||||||||||||||||||||||||||||||||||||||||
| G3 | 12 (46.2%) | 15 (51.7%) | |||||||||||||||||||||||||||||||||||||||||||||||||||||||||||||||||||||||||||||||||||||||||||||||||
| 1 Fisher´s exact test | |||||||||||||||||||||||||||||||||||||||||||||||||||||||||||||||||||||||||||||||||||||||||||||||||||
Addition of metformin elevates circulating levels of β-hydroxybutyrate and α-ketoglutarate in breast cancer patients treated with a conventional neoadjuvant schedule
To probe the specific metabolic response associated with metformin, the serum profiles of BHBA, α-ketoglutarate, cystathionine, taurine, betaine, choline, dimethylglycine, homocysteine, methionine, SAM, and SAH were first evaluated within each arm of the study. An inspection of the metabolite profile by comparing the median fold-change (post-treatment vs pre-treatment) revealed that none of the measured metabolites showed differences in those patients receiving the standard neoadjuvant arm without metformin (Figure 1A). In the metformin-containing arm, however, we observed a statistically significant increase in the serum levels of BHBA (p=0.003), α-ketoglutarate (p=0.000), and SAM (p=0.037) post-treatment (Figure 1B). When we evaluated the differential impact on serum metabolic profiles between treatment arms, only BHBA (p=0.038), and α-ketoglutarate (p=0.029) reached statistical significance (Figure 1C).
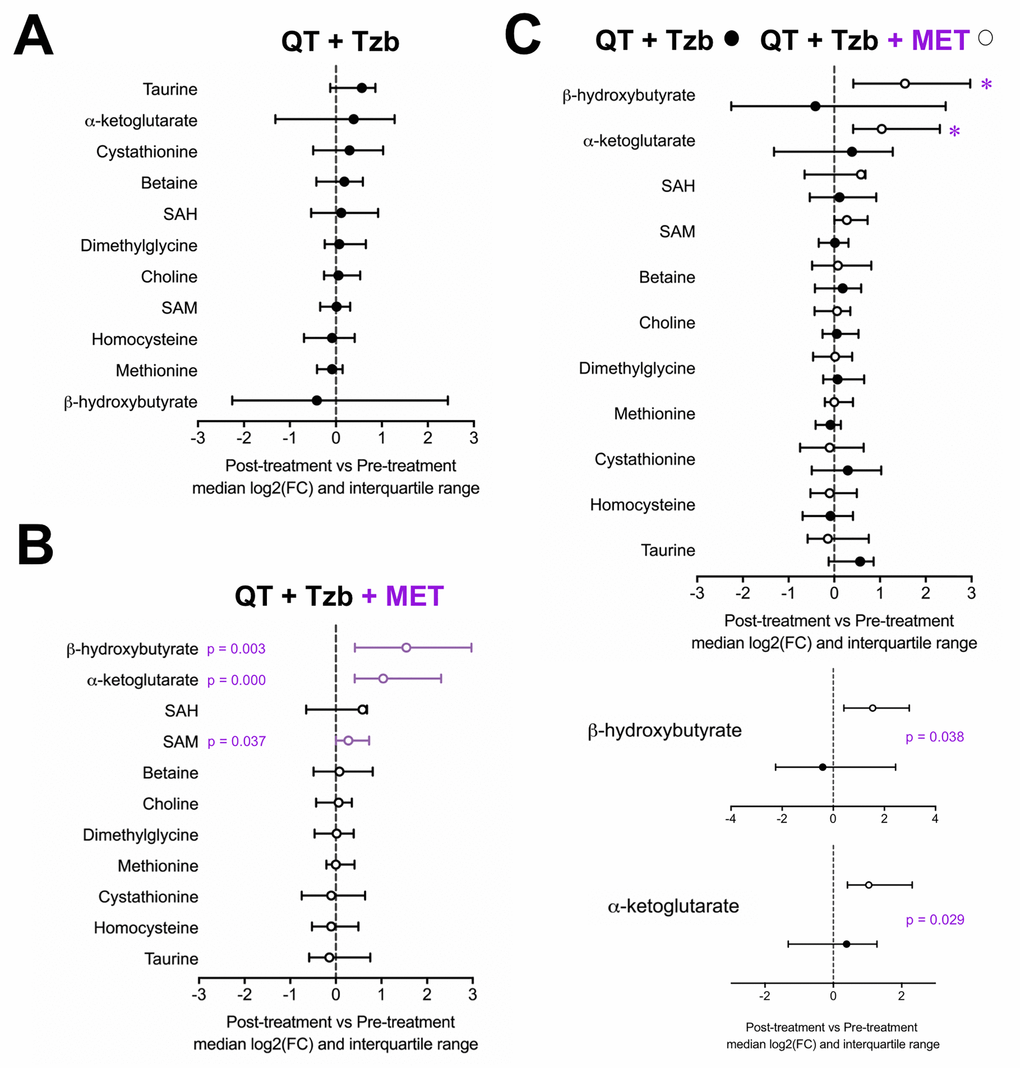
Figure 1. Median fold-change and interquartile range for circulating metabolites (post-treatment vs pre-treatment) in the standard neodjuvant regimen arm (A), the metformin plus standard regimen arm (B), and in patients on metformin compared with those not exposed to metformin (C). Metabolites with statistically significant absolute change on Wilcoxon signed rank test are shown with p-values.
Metformin-driven increase of BHBA is higher in breast cancer patients achieving pathological complete response.
The fold-changes in serum levels of BHBA, α-ketoglutarate, and homocysteine in patients achieving or not pCR in the two treatment arms are represented as waterfall and violin plots in Figures 2, 3, and 4 respectively. The fold-change increase of circulating BHBA reached statistical significance in metformin-treated patients achieving pCR, but not in non-pCR patients (Figure 2). By contrast, the fold-change increase of α-ketoglutarate reached statistical significance in metformin-treated patients irrespective of their pCR status (Figure 3). Finally, metformin-treated patients achieving pCR had significantly higher levels of circulating homocysteine than non-pCR patients (p=0.047; Figure 4).
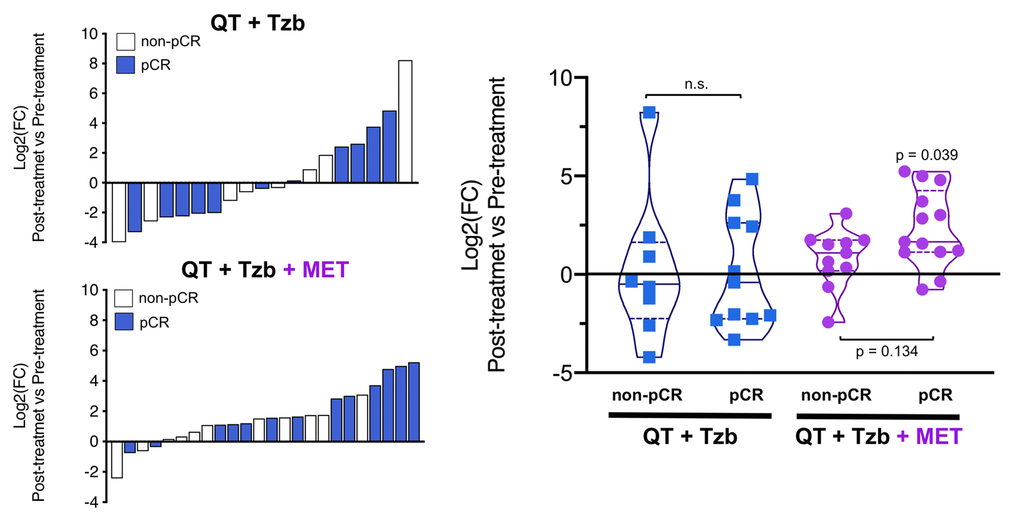
Figure 2. Left. Waterfall plots showing the log2 fold chance of circulating BHBA and correlation with treatment outcomes. Right. Violin plots depicting the log2 fold chance of circulating BHBA in each treatment arm categorized by treatment outcomes. (pCR: pathological complete response; QT: chemotherapy; Tzb: trastuzumab; MET: metformin; p-values by Wilcoxon signed-ranked test).
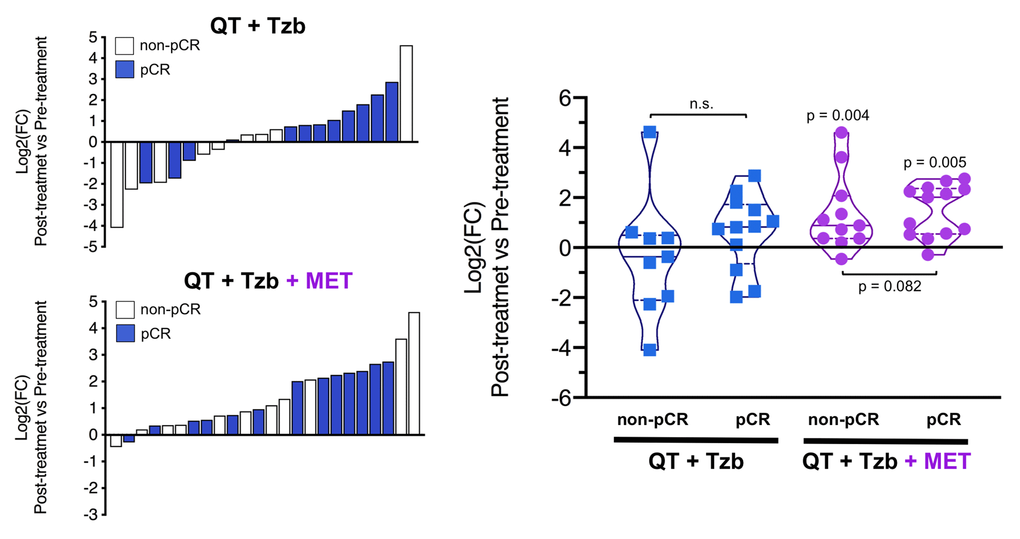
Figure 3. Left. Waterfall plots showing the log2 fold chance of circulating α-KG and correlation with treatment outcomes. Right. Violin plots depicting the log2 fold chance of circulating α-KG in each treatment arm categorized by treatment outcomes. (pCR: pathological complete response; QT: chemotherapy; Tzb: trastuzumab; MET: metformin; p-values by Wilcoxon signed-ranked test).
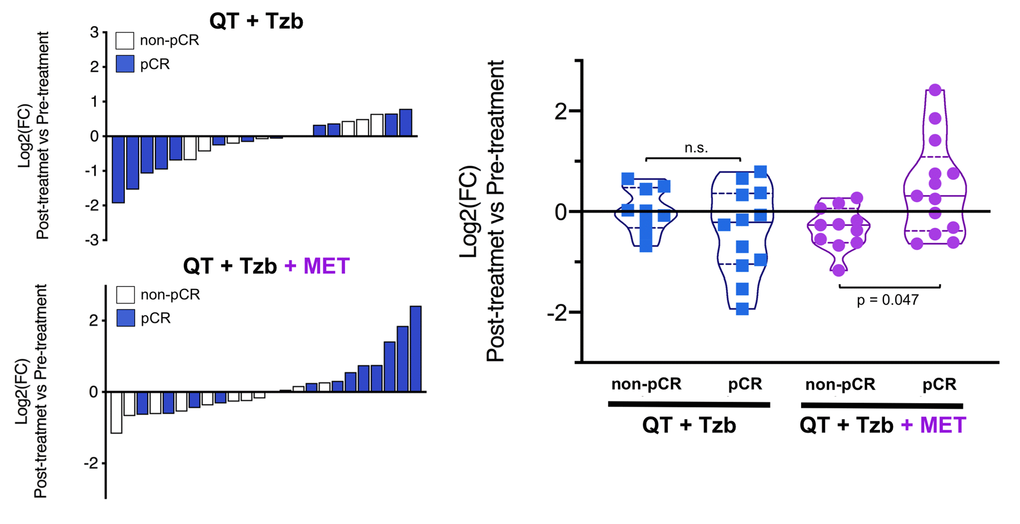
Figure 4. Left. Waterfall plots showing the log2 fold chance of circulating Hcy and correlation with treatment outcomes. Right. Violin plots depicting the log2 fold chance of circulating Hcy in each treatment arm categorized by treatment outcomes. (pCR: pathological complete response; QT: chemotherapy; Tzb: trastuzumab; MET: metformin; p-values by Wilcoxon signed-ranked test).
Follow-up homocysteine predicts the likelihood to benefit from adding pre-operative metformin
Baseline levels of serum homocysteine (week 0 [w0]) were not significantly associated with pCR in patients (Table 2, Figure 5). However, we observed a significant relationship between the follow-up levels of homocysteine (i.e., post-treatment [w24] minus pre-treatment [w0]) and the ability of the treatment arms to achieve pCR (odds ratio [OR]follow-up homocysteine × arm = 13.42, 95% confidence interval [CI]: 1.37–130.98, p=0.025; Table 2). Accordingly, those patients with higher levels of homocysteine in the metformin-containing arm tended to have a higher probability of pCR (OR = 5.47, 95%CI: 0.93–32.11, p=0.060; Figure 5).
Table 2. Association of the interaction between baseline and follow-up levels of circulating homocysteine and pathological complete response by treatment arm.
| Odds ratio (95%CI) | p-value | |
| Baseline homocysteine (w0) | 1.162 (0.340–3.965) | 0.811 |
| Treatment arm | 0.658 (0.241–1.792) | 0.412 |
| Homocysteine × treatment arm | 0.706 (0.110–4.516) | 0.713 |
| Homocysteine w0 standard arm | 1.162 (0.340–3.965) | 0.811 |
| Homocysteine w0 metformin arm | 0.820 (0.204–3.298) | 0.780 |
| Follow-up homocysteine (w24-w0) | 0.408 (0.097–1.714) | 0.221 |
| Treatment arm | 0.825 (0.226–3.009) | 0.771 |
| Homocysteine × treatment arm | 13.419 (1.375–130.982) | 0.025 |
| Homocysteine w24-w0 standard arm | 0.408 (0.097–1.714) | 0.221 |
| Homocysteine w24-w0 metformin arm | 5.474 (0.933–32.108) | 0.060 |
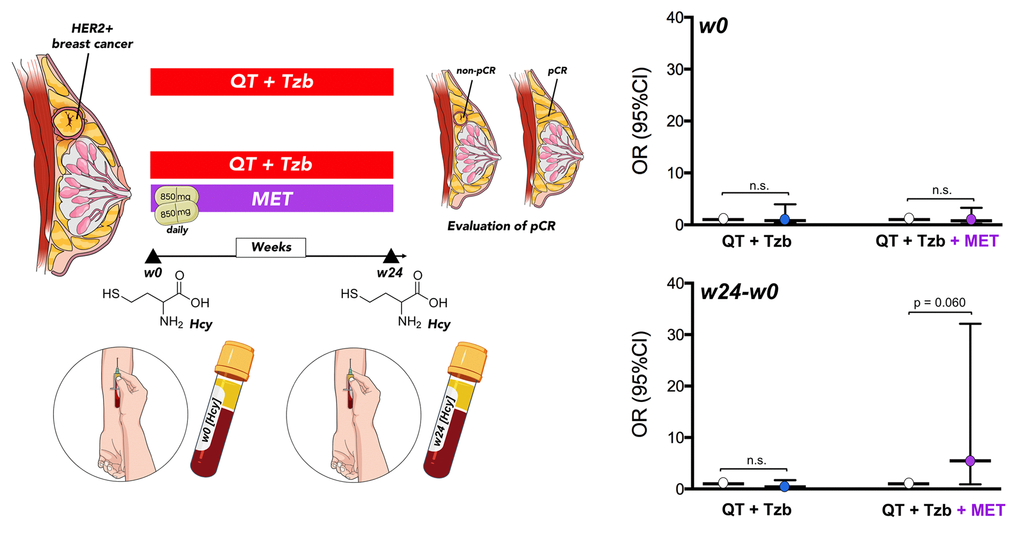
Figure 5. Relationship between the baseline (w0) and the follow-up (w24 minus w0) levels of circulating Hcy and the ability of treatment arms to achieve pCR. (w: week).
After additional adjustments for potential confounding tumor characteristics, such as tumor size and hormone receptor status, the relationship between the follow-up levels of homocysteine and the ability of treatment arms to achieve a pCR in patients remained significant (adjusted ORfollow-up homocysteine × arm = 47.58, 95%CI: 1.60–1411.93, p=0.026; Table 3). In the metformin-containing arm, the positive association between circulating follow-up homocysteine and pCR maintained a tendency towards significance (p=0.076) after accounting for tumor size and hormone receptor status (Table 3). The lack of association between circulating follow-up homocysteine and pCR in the (non-metformin) reference arm remained after adjusting for these factors (Table 3).
Table 3. Association of the interaction between baseline and follow-up levels of circulating homocysteine and pathological complete response by treatment arm adjusted by tumor size and hormone receptors status.
| Odds ratio (95%CI) | p-value | |
| Baseline homocysteine (w0) | 1.135 (0.323–3.984) | 0.843 |
| Treatment arm | 0.679 (0.234–1.967) | 0.475 |
| Homocysteine × treatment arm | 0.976 (0.147–6.506) | 0.980 |
| Homocysteine w0 standard arm | 0.950 (0.263–3.430) | 0.937 |
| Homocysteine w0 metformin arm | 1.193 (0.265–5.373) | 0.819 |
| Follow-up homocysteine (w24-w0) | 0.135 (0.009–1.983) | 0.144 |
| Treatment arm | 1.400 (0.302–6.494) | 0.668 |
| Homocysteine × treatment arm | 47.584 (1.604–1411.933) | 0.026 |
| Homocysteine w24-w0 standard arm | 0.144 (0.010–2.077) | 0.155 |
| Homocysteine w24-w0 metformin arm | 6.614 (0.822–53.189) | 0.076 |
Discussion
We are now beginning to recognize that the causes of therapeutic cancer resistance might involve alterations in the host rather than in the cancer cells themselves. Metabolomic analysis of peripheral blood provides a snapshot of the global physiological state of several organs and tissues. We used this approach in the present study to evaluate the impact of adding metformin to a well-established neoadjuvant regimen of chemotherapy and trastuzumab on the metabolism of HER2-positive breast cancer patients. Our findings should therefore be considered in terms of the complex interaction between host and tumor, as well as on systemic effects on several metformin-responsive organs including liver, fat, and muscle.
Our results identify a signature of significantly-altered circulating metabolites that exclusively associates with the combination of metformin, chemotherapy, and trastuzumab. Moreover, we confirm that metformin can provoke a fasting-mimicking modification of the systemic host metabolism involving a significant augmentation of both the ketone body BHBA, a marker of mitochondrial fatty acid β-oxidation, and α-ketoglutarate, a key intermediate of the TCA cycle.
AMP-activated protein kinase (AMPK) and mammalian target of rapamycin (mTOR) complex 1 (mTORC1), two key regulators of metabolism that are respectively activated and inhibited in acute response to cellular energy depletion, are known to inhibit β-oxidation and ketogenesis in the liver, adipose tissue and perhaps muscle, while also promoting the use and storage of glucose [31–33]. mTORC1 blockade activates β-oxidation (i.e., adipose tissue lipolysis), thereby inducing the release of acetyl-CoA that can either enter the TCA cycle or the ketogenesis pathway when the TCA cycle is shut down (e.g., in fasting conditions) [34,35]. Our data therefore imply that one of the physiological consequences of metformin-induced inhibition of mTORC1 [36] on systemic metabolism is the release of ketone bodies, here BHBA, in the circulating metabolome of cancer patients. Circulating levels of α-ketoglutarate, which are increased by starvation and mimic calorie restriction via inactivation of mTOR [37], also become significantly elevated in breast cancer patients co-treated with metformin but not in those treated only with a standard combination of chemo- and targeted therapy. Upregulation of ketone body metabolism and α-ketoglutarate, both key sensors of mitochondrial perturbations that involve the mTOR pathway, provides a rationale to suggest that the partial suppression of the mitochondrial electron transport chain [38,39] by adding metformin to an established therapeutic regimen leads to a systemic catabolic response mimicking fasting in breast cancer patients. Moreover, our data suggest that HER2-positive breast cancer patients who clinically benefited from neoadjuvant metformin were particularly sensitive to its metabolic effects on mitochondrial fatty acid β-oxidation. Because breast tumor tissues were not available for metabolomic analysis we cannot discard the possibility that, beyond an indirect effect of metformin on hepatic and adipose tissues and perhaps also on short-chain fatty acid (butyrate-producing gut microbiota [40,41], it could directly promote inhibition of the mTOR pathway and increase fatty acid oxidation in the breast cancer tumor cells themselves, altogether contributing to the apparent release of BHBA into the serum of HER2-positive breast cancer patients co-treated with metformin.
Our findings also highlight the positive correlation between metformin-driven alterations in specific metabolites, here homocysteine, and the likelihood of HER2-positive breast cancer patients achieving clinical benefit from the pre-operative treatment in terms of pCR rate. We observed a significant relationship between the follow-up circulating levels of homocysteine and the ability of treatment arms to achieve pCR, suggesting that the direction and/or intensity of the relationship between the elevation of circulating homocysteine and pCR significantly varied in each treatment arm. Accordingly, those patients with significant elevations of homocysteine, a metabolic checkpoint of 1C metabolism, tended to have a significantly higher probability of pCR, but only in the metformin-containing arm. Antifolates, a group of anti-cancer agents targeting various enzymatic steps in folate-dependent 1C metabolism, are known to exert an indirect influence on the rate of appearance/disappearance of homocysteine from cellular and plasma/serum compartments [42–46]. The ability of homocysteine to behave as a shared marker of the pharmacodynamic effect of metformin and antifolate drugs strongly supports the increasing recognition that anti-diabetic biguanides may exhibit folate mimicry and antifolate-like activity [27–29,46]. Homocysteine levels are known to increase in non-cancer patients undergoing biguanide treatment [47,48], and metabolomic parallelisms have been noted between the responses of cancer cells to biguanides and anti-folate drugs such as methotrexate [27,49]. Dihydrofolate reductase, the best-understood target through which methotrexate blocks the synthesis of tetrahydrofolate methyl donors and indirectly promotes the accumulation of homocysteine [50,51], has been proposed as a putative target of metformin not only in the gut microbiota, but also in intestinal cells [28–30]. Because pre-clinical and clinical studies have shown that well-recognized detrimental effects of homocysteine such as cellular hypomethylation do not accompany the antifolate-like activity of metformin [30,52], it remains an open question whether the increase in circulating homocysteine levels, a classic marker of 1C deficiency, is secondary to reduced vitamin B12 levels, folate levels (or a combination of both), or results from direct targeting of folate-dependent enzymes in the gut microbiota, gut mucosal cells, or the tumor cells themselves. In this regard, we are currently exploring whether the ability of metformin to promote a build-up of homocysteine in those patients more likely to achieve a clinical response might be explained in terms of a non-classic disruption of 1C metabolism involving the flux of 1C units generated from serine metabolism [30,53].
Three previous clinical studies have employed metabolomic approaches to assess the pharmacodynamic effects of metformin in endometrial, ovarian, and breast cancer types. The first study involved obese, nondiabetic endometrial cancer patients (n=20) treated with metformin (850 mg) daily for up to 4 weeks prior to surgical staging in a preoperative window clinical trial for endometrial cancer. In agreement with our findings, BHBA showed the most profound change in metabolite concentration in response to metformin, and more pronounced effects were reported in the serum of responder patients [22]. The second study assayed tissue and serum samples from patients with ovarian cancer (n=10) who were receiving metformin for diabetes, while using control samples from non-diabetic patients with lower mean body-mass index [24]. The authors found that the predominant mechanism of action by metformin in cancer is to target tumor-cell intrinsic mitochondrial metabolism, as suggested by our findings of metformin-driven elevation of circulating α-ketoglutarate. The third study recruited female patients with treatment-naïve primary breast cancer (n=40) who received 13–21 days of slow release metformin at escalating dose levels (500 mg for days 1–3, 1,000 mg for days 4–6, and 1,500 mg thereafter) and lacked a control arm [25]. In agreement with our suggestion of metformin-driven β-oxidation in tumor cells, the authors found that patients with augmented glucose uptake into the primary breast cancer following metformin treatment presented a significant increase in intratumoral acetylcarnitine, likely reflecting an increased flux of glucose carbons toward acetyl-CoA via increased fatty acid oxidation and ketogenesis [54–56]. Nonetheless, it is important to note that our present study is the first detailing a systemic modification in host metabolism caused by metformin in cancer patients treated with targeted therapy (the anti-HER2 monoclonal antibody trastuzumab) in combination with chemotherapy (anthracycline/taxane).
In summary, recent strategies in cancer therapy have begun to focus on the potential beneficial effects of adjuvant dietary interventions (e.g., fasting, KD) on those metabolic pathways in tumor cells and the tumor environment (e.g., microbiota, tumor microenvironment, immune system) that play a key role in cancer progression and therapeutic resistance [14,57–60]. However, the safety and efficacy of such nutritional interventions should be examined for each single type/genetic subtype of cancer before they can be exploited for clinical application for cancer patients. In this context, our present findings showing that the addition of metformin to a well-established neoadjuvant regimen causes a fasting-mimicking modification of the systemic host metabolism, including an elevation of BHBA, together with the favorable safety and tolerability profile of metformin [26,61–64], might allow metformin to be considered as a moderate fasting/KD-mimicking agent in combination with standard of care therapies in multiple cancer types. Nevertheless, the ever-growing number of individual clinical trials (>300) investigating metformin in the treatment of various types of cancer has highlighted a need for more rigorous planning to focus on potential predictive biomarkers [65]. Along this line, we have recently proposed that the minor allele (C) of the single-nucleotide polymorphism (SNP) rs11212617, located near the ataxia telangiectasia mutated gene, might warrant consideration as a predictive clinical biomarker to inform the personalized used of metformin in breast cancer patients [66]. In contrast to predictive biomarkers, which attempt to a priori predict the likelihood to respond to a particular treatment from the properties of the tumor, pharmacodynamic biomarkers provide a post-treatment measure of whether a given drug has reached its target, exerted a pharmacological response, and the degree of such response [67]. In our hands, no significant relationship existed between baseline (pre-treatment) serum homocysteine levels and the ability of metformin to achieve pCR in patients, whereas the (post- minus pre-treatment) follow-up difference in circulating homocysteine across treatment paralleled the clinical efficacy of neoadjuvant metformin. Thus, circulating homocysteine might be explored as an informative, non-invasive pharmacodynamic biomarker capable of linking the antifolate-like activity of metformin and biological tumor response using other treatment regimens and other cancer types.
Materials and Methods
Participants
We prospectively collected serum samples from patients (n=68) with early, non-metastatic HER2-positive breast cancer that were recruited into the METTEN study (EU Clinical Trials Register, EudraCT number 2011-000490-30; registered 28 February 2011, https://www.clinicaltrialsregister.eu/ctr-search/trial/2011-000490-30/ES) [26]. The ethics committee of the Dr. Josep Trueta Hospital (Girona, Spain) and independent Institutional Review Boards at each site participating in the METTEN study approved the protocol and any amendments. All procedures were in accordance with the ethical standards of the institutional research committees and with the 1964 Helsinki Declaration and its later amendments or comparable ethical standards. Informed consent was obtained from all individual participants included in the metabolomic sub-study presented here.
Patients were randomly assigned to receive daily metformin (850 mg twice-daily) for 24 weeks concurrently with 12 cycles of weekly paclitaxel (80 mg/m2) plus trastuzumab (4 mg/kg loading dose followed by 2 mg/kg) followed by four cycles of 3-weekly fluorouracil (600 mg/m2), epirubicin (75 mg/m2), cyclophosphamide (600 mg/m2) with concomitant trastuzumab (6 mg/kg) (arm A), or equivalent sequential chemotherapy plus trastuzumab without metformin (arm B), followed by surgery. Patients had surgery within 4–5 weeks of the last cycle of neoadjuvant treatment [26]. In all participants, venous blood was collected, after an overnight fast, into tubes with no added anticoagulants (serum). The tubes were centrifuged at 2500 × g at 4oC, and serum was stored at -80oC until use to minimize preanalytical errors. Post-surgery, patients received thrice-weekly trastuzumab to complete 1 year of neoadjuvant-adjuvant therapy.
Metabolomics
Methods to optimize reproducibility and robustness for the simultaneous measurement of selected metabolites from energy and 1C metabolism and chromatographic conditions have been previously described [68–70]. Briefly, surrogate deuterated standards were added to maximize technical precision during the injection and recovery during the extraction procedures (Isotec Stable Isotopes, Miamisburg, OH, USA). The calibration curves were prepared immediately before each assay using commercially available metabolites (Fluka, St Gallen, Switzerland). The samples for gas chromatography were derivatized and analyzed on an Agilent Technologies (Santa Clara, CA, USA) 7890A gas chromatograph coupled with an electron impact (EI) source to a 7200 quadrupole time-of-flight mass spectrometer (QTOF-MS) equipped with a 7693 auto-sampler module and a J&W Scientific HP-5MS column (30 m × 0.25 mm, 0.25 μm). The liquid chromatography platform (UHPLC-ESI-QqQ-MS) was based on an Agilent 1290 Infinity Ultra High Performance Liquid Chromatograph (UHPLC) coupled with an iFunnel electrospray ionization source (ESI) and a 6490 triple quadrupole mass spectrometer (QqQ-MS). The MS analysis alternated between MS and data-dependent MS2 scans using dynamic exclusion. Metabolites were identified and quantified using available reference libraries and the Qualitative and Quantitative Analysis B.06.00 software (Agilent Technologies).
Statistical analysis
Descriptive data were summarized using percentages, medians or means with their respective 25 and 75 percentiles, or standard deviations as appropriate. Clinical baseline characteristics between treatment arms were assessed using Chi-square or Fisher’s exact test for categorical variables, Student’s t test for continuous variables with normal distribution, or Mann-Whitney U test for non-normal distributions. The assumption of normality was evaluated with the Shapiro-Wilk test. Changes in circulating metabolite levels between pre- and post-treatment were compared using the Wilcoxon test. Binary logistic regression was used to assess the prognostic effect of both the baseline and the follow-up (post-pre) differences in circulating metabolites on pCR. Unadjusted and adjusted ORs with their relative 95% CIs were reported as a measure of association. All tests were 2-sided and p≤0.05 was set as statistically significant. Statistical analyses were carried out using SPSS (IBM Corp. released 2017. IBM SPSS Statistics for Windows, Version 25.0; Armonk, NY, USA) and STATA (StataCorp. 2013. Stata Statistical Software: Release 13; StataCorp LP, College Station, TX, USA).
Author Contributions
Conceptualization, BM-C and JAM; Methodology, BM-C, MB, JAM; Formal analysis, MB, EC, SF-A; Investigation, SF-A, EC, MB, SP, JD, IA, SM, JMP-G, NB-L, CAR-S, KA, SD, ML, AS, IM, GV, JC, SV, JB, EL-B, MG, SS, JJ; Resources, SS, BM; Data curation, EC, SF-A, MB, SS, Writing-Original Draft Preparation, JAM; Writing-Review and Editing, MB, BM-C, JAM; Visualization, EC, MB, JAM; Supervision, JAM, BM-C; Project Administration, BM-C; Funding Acquisition, BM-C, JAM.
Acknowledgements
The METTEN study was conceived and designed by Begoña Martin-Castillo and Javier A. Menendez, and was sponsored by the Consortium for the Support of Biomedical Research Network (CAIBER) and the Catalan Institute of Oncology (ICO). The Unit of Clinical Research at the ICO in Girona and the Unit for Statistical and Methodological Assessment at the Girona Biomedical Research Institute (IDIBGI) were responsible for central data gathering and analysis. All authors had responsibility for the decision to submit for publication. The authors would like to thank Dr. Kenneth McCreath for editorial support.
Conflicts of Interest
The authors declare no conflicts of interest.
Funding
This work was supported by grants from the Ministerio de Sanidad, Servicios Sociales e Igualdad (EC10-125, Ayudas para el Fomento de la Investigación Clínica Independiente to Begoña Martin-Castillo). Work in the Menendez laboratory is supported by the Ministerio de Ciencia e Innovación (Grant SAF2016-80639-P, Plan Nacional de l+D+I, founded by the European Regional Development Fund [EU FEDER], Spain) and by an unrestricted research grant from the Fundació Oncolliga Girona (Lliga catalana d’ajuda al malalt de càncer, Girona).
References
- 1. Fisher R, Pusztai L, Swanton C. Cancer heterogeneity: implications for targeted therapeutics. Br J Cancer. 2013; 108:479–85. https://doi.org/10.1038/bjc.2012.581 [PubMed]
- 2. Jamal-Hanjani M, Quezada SA, Larkin J, Swanton C. Translational implications of tumor heterogeneity. Clin Cancer Res. 2015; 21:1258–66. https://doi.org/10.1158/1078-0432.CCR-14-1429 [PubMed]
- 3. Shibue T, Weinberg RA. EMT, CSCs, and drug resistance: the mechanistic link and clinical implications. Nat Rev Clin Oncol. 2017; 14:611–29. https://doi.org/10.1038/nrclinonc.2017.44 [PubMed]
- 4. Cuyàs E, Verdura S, Fernández-Arroyo S, Bosch-Barrera J, Martin-Castillo B, Joven J, Menendez JA. Metabolomic mapping of cancer stem cells for reducing and exploiting tumor heterogeneity. Oncotarget. 2017; 8:99223–36. https://doi.org/10.18632/oncotarget.21834 [PubMed]
- 5. Pavlova NN, Thompson CB. The Emerging Hallmarks of Cancer Metabolism. Cell Metab. 2016; 23:27–47. https://doi.org/10.1016/j.cmet.2015.12.006 [PubMed]
- 6. Cantor JR, Sabatini DM. Cancer cell metabolism: one hallmark, many faces. Cancer Discov. 2012; 2:881–98. https://doi.org/10.1158/2159-8290.CD-12-0345 [PubMed]
- 7. DeBerardinis RJ, Chandel NS. Fundamentals of cancer metabolism. Sci Adv. 2016; 2:e1600200. https://doi.org/10.1126/sciadv.1600200 [PubMed]
- 8. Ward PS, Thompson CB. Metabolic reprogramming: a cancer hallmark even warburg did not anticipate. Cancer Cell. 2012; 21:297–308. https://doi.org/10.1016/j.ccr.2012.02.014 [PubMed]
- 9. Lehuédé C, Dupuy F, Rabinovitch R, Jones RG, Siegel PM. Metabolic Plasticity as a Determinant of Tumor Growth and Metastasis. Cancer Res. 2016; 76:5201–08. https://doi.org/10.1158/0008-5472.CAN-16-0266 [PubMed]
- 10. Gandhi N, Das GM. Metabolic Reprogramming in Breast Cancer and Its Therapeutic Implications. Cells. 2019; 8:E89. https://doi.org/10.3390/cells8020089 [PubMed]
- 11. Vatrinet R, Leone G, De Luise M, Girolimetti G, Vidone M, Gasparre G, Porcelli AM. The α-ketoglutarate dehydrogenase complex in cancer metabolic plasticity. Cancer Metab. 2017; 5:3. https://doi.org/10.1186/s40170-017-0165-0 [PubMed]
- 12. Yamaguchi R, Perkins G. Challenges in targeting cancer metabolism for cancer therapy. EMBO Rep. 2012; 13:1034–35. https://doi.org/10.1038/embor.2012.176 [PubMed]
- 13. Oliveras-Ferraros C, Vazquez-Martin A, Cuyàs E, Corominas-Faja B, Rodríguez-Gallego E, Fernández-Arroyo S, Martin-Castillo B, Joven J, Menendez JA. Acquired resistance to metformin in breast cancer cells triggers transcriptome reprogramming toward a degradome-related metastatic stem-like profile. Cell Cycle. 2014; 13:1132–44. https://doi.org/10.4161/cc.27982 [PubMed]
- 14. Nencioni A, Caffa I, Cortellino S, Longo VD. Fasting and cancer: molecular mechanisms and clinical application. Nat Rev Cancer. 2018; 18:707–19. https://doi.org/10.1038/s41568-018-0061-0 [PubMed]
- 15. Maddocks OD, Athineos D, Cheung EC, Lee P, Zhang T, van den Broek NJ, Mackay GM, Labuschagne CF, Gay D, Kruiswijk F, Blagih J, Vincent DF, Campbell KJ, et al. Modulating the therapeutic response of tumours to dietary serine and glycine starvation. Nature. 2017; 544:372–76. https://doi.org/10.1038/nature22056 [PubMed]
- 16. Longo VD, Fontana L. Calorie restriction and cancer prevention: metabolic and molecular mechanisms. Trends Pharmacol Sci. 2010; 31:89–98. https://doi.org/10.1016/j.tips.2009.11.004 [PubMed]
- 17. Hopkins BD, Pauli C, Du X, Wang DG, Li X, Wu D, Amadiume SC, Goncalves MD, Hodakoski C, Lundquist MR, Bareja R, Ma Y, Harris EM, et al. Suppression of insulin feedback enhances the efficacy of PI3K inhibitors. Nature. 2018; 560:499–503. https://doi.org/10.1038/s41586-018-0343-4 [PubMed]
- 18. Kanarek N, Keys HR, Cantor JR, Lewis CA, Chan SH, Kunchok T, Abu-Remaileh M, Freinkman E, Schweitzer LD, Sabatini DM. Histidine catabolism is a major determinant of methotrexate sensitivity. Nature. 2018; 559:632–36. https://doi.org/10.1038/s41586-018-0316-7 [PubMed]
- 19. Caccialanza R, Aprile G, Cereda E, Pedrazzoli P. Fasting in oncology: a word of caution. Nat Rev Cancer. 2019; 19:177. https://doi.org/10.1038/s41568-018-0098-0 [PubMed]
- 20. Dhahbi JM, Mote PL, Fahy GM, Spindler SR. Identification of potential caloric restriction mimetics by microarray profiling. Physiol Genomics. 2005; 23:343–50. https://doi.org/10.1152/physiolgenomics.00069.2005 [PubMed]
- 21. Onken B, Driscoll M. Metformin induces a dietary restriction-like state and the oxidative stress response to extend C. elegans Healthspan via AMPK, LKB1, and SKN-1. PLoS One. 2010; 5:e8758. https://doi.org/10.1371/journal.pone.0008758 [PubMed]
- 22. Schuler KM, Rambally BS, DiFurio MJ, Sampey BP, Gehrig PA, Makowski L, Bae-Jump VL. Antiproliferative and metabolic effects of metformin in a preoperative window clinical trial for endometrial cancer. Cancer Med. 2015; 4:161–73. https://doi.org/10.1002/cam4.353 [PubMed]
- 23. Walcott FL, Annunziata CM, Sotomayor EM, Tito Fojo A. Effect of metformin chemoprevention on metabolomics profiles in Li-Fraumeni Syndrome (LFS). J Clin Oncol. 2017; 15:1556–1556. https://doi.org/10.1200/JCO.2017.35.15_suppl.1556
- 24. Liu X, Romero IL, Litchfield LM, Lengyel E, Locasale JW. Metformin Targets Central Carbon Metabolism and Reveals Mitochondrial Requirements in Human Cancers. Cell Metab. 2016; 24:728–39. https://doi.org/10.1016/j.cmet.2016.09.005 [PubMed]
- 25. Lord SR, Cheng WC, Liu D, Gaude E, Haider S, Metcalf T, Patel N, Teoh EJ, Gleeson F, Bradley K, Wigfield S, Zois C, McGowan DR, et al. Integrated Pharmacodynamic Analysis Identifies Two Metabolic Adaption Pathways to Metformin in Breast Cancer. Cell Metab. 2018; 28:679–688.e4. https://doi.org/10.1016/j.cmet.2018.08.021 [PubMed]
- 26. Martin-Castillo B, Pernas S, Dorca J, Álvarez I, Martínez S, Pérez-Garcia JM, Batista-López N, Rodríguez-Sánchez CA, Amillano K, Domínguez S, Luque M, Stradella A, Morilla I, et al. A phase 2 trial of neoadjuvant metformin in combination with trastuzumab and chemotherapy in women with early HER2-positive breast cancer: the METTEN study. Oncotarget. 2018; 9:35687–704. https://doi.org/10.18632/oncotarget.26286 [PubMed]
- 27. Corominas-Faja B, Quirantes-Piné R, Oliveras-Ferraros C, Vazquez-Martin A, Cufí S, Martin-Castillo B, Micol V, Joven J, Segura-Carretero A, Menendez JA. Metabolomic fingerprint reveals that metformin impairs one-carbon metabolism in a manner similar to the antifolate class of chemotherapy drugs. Aging (Albany NY). 2012; 4:480–98. https://doi.org/10.18632/aging.100472 [PubMed]
- 28. Cabreiro F, Au C, Leung KY, Vergara-Irigaray N, Cochemé HM, Noori T, Weinkove D, Schuster E, Greene ND, Gems D. Metformin retards aging in C. elegans by altering microbial folate and methionine metabolism. Cell. 2013; 153:228–39. https://doi.org/10.1016/j.cell.2013.02.035 [PubMed]
- 29. Gabel SA, Duff MR, Pedersen LC, DeRose EF, Krahn JM, Howell EE, London RE. A Structural Basis for Biguanide Activity. Biochemistry. 2017; 56:4786–98. https://doi.org/10.1021/acs.biochem.7b00619 [PubMed]
- 30. Cuyàs E, Fernández-Arroyo S, Verdura S, García RÁ, Stursa J, Werner L, Blanco-González E, Montes-Bayón M, Joven J, Viollet B, Neuzil J, Menendez JA. Metformin regulates global DNA methylation via mitochondrial one-carbon metabolism. Oncogene. 2018; 37:963–70. https://doi.org/10.1038/onc.2017.367 [PubMed]
- 31. Laplante M, Sabatini DM. mTOR signaling in growth control and disease. Cell. 2012; 149:274–93. https://doi.org/10.1016/j.cell.2012.03.017 [PubMed]
- 32. Lamming DW, Sabatini DM. A Central role for mTOR in lipid homeostasis. Cell Metab. 2013; 18:465–69. https://doi.org/10.1016/j.cmet.2013.08.002 [PubMed]
- 33. Ricoult SJ, Manning BD. The multifaceted role of mTORC1 in the control of lipid metabolism. EMBO Rep. 2013; 14:242–51. https://doi.org/10.1038/embor.2013.5 [PubMed]
- 34. Brown NF, Stefanovic-Racic M, Sipula IJ, Perdomo G. The mammalian target of rapamycin regulates lipid metabolism in primary cultures of rat hepatocytes. Metabolism. 2007; 56:1500–07. https://doi.org/10.1016/j.metabol.2007.06.016 [PubMed]
- 35. Peng T, Golub TR, Sabatini DM. The immunosuppressant rapamycin mimics a starvation-like signal distinct from amino acid and glucose deprivation. Mol Cell Biol. 2002; 22:5575–84. https://doi.org/10.1128/MCB.22.15.5575-5584.2002 [PubMed]
- 36. Howell JJ, Hellberg K, Turner M, Talbott G, Kolar MJ, Ross DS, Hoxhaj G, Saghatelian A, Shaw RJ, Manning BD. Metformin Inhibits Hepatic mTORC1 Signaling via Dose-Dependent Mechanisms Involving AMPK and the TSC Complex. Cell Metab. 2017; 25:463–71. https://doi.org/10.1016/j.cmet.2016.12.009 [PubMed]
- 37. Chin RM, Fu X, Pai MY, Vergnes L, Hwang H, Deng G, Diep S, Lomenick B, Meli VS, Monsalve GC, Hu E, Whelan SA, Wang JX, et al. The metabolite α-ketoglutarate extends lifespan by inhibiting ATP synthase and TOR. Nature. 2014; 510:397–401. https://doi.org/10.1038/nature13264 [PubMed]
- 38. Wheaton WW, Weinberg SE, Hamanaka RB, Soberanes S, Sullivan LB, Anso E, Glasauer A, Dufour E, Mutlu GM, Budigner GS, Chandel NS. Metformin inhibits mitochondrial complex I of cancer cells to reduce tumorigenesis. ELife. 2014; 3:e02242. https://doi.org/10.7554/eLife.02242 [PubMed]
- 39. Bridges HR, Sirviö VA, Agip AN, Hirst J. Molecular features of biguanides required for targeting of mitochondrial respiratory complex I and activation of AMP-kinase. BMC Biol. 2016; 14:65. https://doi.org/10.1186/s12915-016-0287-9 [PubMed]
- 40. de la Cuesta-Zuluaga J, Mueller NT, Corrales-Agudelo V, Velásquez-Mejía EP, Carmona JA, Abad JM, Escobar JS. Metformin Is Associated With Higher Relative Abundance of Mucin-Degrading Akkermansia muciniphila and Several Short-Chain Fatty Acid-Producing Microbiota in the Gut. Diabetes Care. 2017; 40:54–62. https://doi.org/10.2337/dc16-1324 [PubMed]
- 41. Forslund K, Hildebrand F, Nielsen T, Falony G, Le Chatelier E, Sunagawa S, Prifti E, Vieira-Silva S, Gudmundsdottir V, Pedersen HK, Arumugam M, Kristiansen K, Voigt AY, et al, and MetaHIT consortium. Disentangling type 2 diabetes and metformin treatment signatures in the human gut microbiota. Nature. 2015; 528:262–66. https://doi.org/10.1038/nature15766 [PubMed]
- 42. van Ede AE, Laan RF, Blom HJ, Boers GH, Haagsma CJ, Thomas CM, De Boo TM, van de Putte LB. Homocysteine and folate status in methotrexate-treated patients with rheumatoid arthritis. Rheumatology (Oxford). 2002; 41:658–65. https://doi.org/10.1093/rheumatology/41.6.658 [PubMed]
- 43. Hoekstra M, Haagsma CJ, Doelman CJ, van de Laar MA. Intermittent rises in plasma homocysteine in patients with rheumatoid arthritis treated with higher dose methotrexate. Ann Rheum Dis. 2005; 64:141–43. https://doi.org/10.1136/ard.2003.019828 [PubMed]
- 44. Niyikiza C, Baker SD, Seitz DE, Walling JM, Nelson K, Rusthoven JJ, Stabler SP, Paoletti P, Calvert AH, Allen RH. Homocysteine and methylmalonic acid: markers to predict and avoid toxicity from pemetrexed therapy. Mol Cancer Ther. 2002; 1:545–52. [PubMed]
- 45. Tanaka H, Horiike A, Sakatani T, Saito R, Yanagitani N, Kudo K, Ohyanagi F, Horai T, Nishio M. Plasma homocysteine levels and hematological toxicity in NSCLC patients after the first cycle of pemetrexed under folate supplementation. Anticancer Drugs. 2015; 26:573–78. https://doi.org/10.1097/CAD.0000000000000220 [PubMed]
- 46. Valik D, Radina M, Sterba J, Vojtesek B. Homocysteine: exploring its potential as a pharmacodynamic biomarker of antifolate chemotherapy. Pharmacogenomics. 2004; 5:1151–62. https://doi.org/10.1517/14622416.5.8.1151 [PubMed]
- 47. Carlsen SM, Følling I, Grill V, Bjerve KS, Schneede J, Refsum H. Metformin increases total serum homocysteine levels in non-diabetic male patients with coronary heart disease. Scand J Clin Lab Invest. 1997; 57:521–27. https://doi.org/10.3109/00365519709084603 [PubMed]
- 48. Wulffelé MG, Kooy A, Lehert P, Bets D, Ogterop JC, Borger van der Burg B, Donker AJ, Stehouwer CD. Effects of short-term treatment with metformin on serum concentrations of homocysteine, folate and vitamin B12 in type 2 diabetes mellitus: a randomized, placebo-controlled trial. J Intern Med. 2003; 254:455–63. https://doi.org/10.1046/j.1365-2796.2003.01213.x [PubMed]
- 49. Menendez JA, Joven J. One-carbon metabolism: an aging-cancer crossroad for the gerosuppressant metformin. Aging (Albany NY). 2012; 4:894–98. https://doi.org/10.18632/aging.100523 [PubMed]
- 50. Winter-Vann AM, Kamen BA, Bergo MO, Young SG, Melnyk S, James SJ, Casey PJ. Targeting Ras signaling through inhibition of carboxyl methylation: an unexpected property of methotrexate. Proc Natl Acad Sci USA. 2003; 100:6529–34. https://doi.org/10.1073/pnas.1135239100 [PubMed]
- 51. Philips MR. Methotrexate and Ras methylation: a new trick for an old drug? Sci STKE. 2004; 2004:pe13. https://doi.org/10.1126/stke.2252004pe13 [PubMed]
- 52. Elbere I, Silamikelis I, Ustinova M, Kalnina I, Zaharenko L, Peculis R, Konrade I, Ciuculete DM, Zhukovsky C, Gudra D, Radovica-Spalvina I, Fridmanis D, Pirags V, et al. Significantly altered peripheral blood cell DNA methylation profile as a result of immediate effect of metformin use in healthy individuals. Clin Epigenetics. 2018; 10:156. https://doi.org/10.1186/s13148-018-0593-x [PubMed]
- 53. Ducker GS, Ghergurovich JM, Mainolfi N, Suri V, Jeong SK, Hsin-Jung Li S, Friedman A, Manfredi MG, Gitai Z, Kim H, Rabinowitz JD. Human SHMT inhibitors reveal defective glycine import as a targetable metabolic vulnerability of diffuse large B-cell lymphoma. Proc Natl Acad Sci USA. 2017; 114:11404–09. https://doi.org/10.1073/pnas.1706617114 [PubMed]
- 54. Ribel-Madsen A, Ribel-Madsen R, Brøns C, Newgard CB, Vaag AA, Hellgren LI. Plasma acylcarnitine profiling indicates increased fatty acid oxidation relative to tricarboxylic acid cycle capacity in young, healthy low birth weight men. Physiol Rep. 2016; 4:e12977. https://doi.org/10.14814/phy2.12977 [PubMed]
- 55. Schoeler NE, Bell G, Yuen A, Kapelner AD, Heales SJ, Cross JH, Sisodiya S. An examination of biochemical parameters and their association with response to ketogenic dietary therapies. Epilepsia. 2017; 58:893–900. https://doi.org/10.1111/epi.13729 [PubMed]
- 56. Steinhauser ML, Olenchock BA, O’Keefe J, Lun M, Pierce KA, Lee H, Pantano L, Klibanski A, Shulman GI, Clish CB, Fazeli PK. The circulating metabolome of human starvation. JCI Insight. 2018; 3:121434. https://doi.org/10.1172/jci.insight.121434 [PubMed]
- 57. Klement RJ. Beneficial effects of ketogenic diets for cancer patients: a realist review with focus on evidence and confirmation. Med Oncol. 2017; 34:132. https://doi.org/10.1007/s12032-017-0991-5 [PubMed]
- 58. Weber DD, Aminazdeh-Gohari S, Kofler B. Ketogenic diet in cancer therapy. Aging (Albany NY). 2018; 10:164–65. https://doi.org/10.18632/aging.101382 [PubMed]
- 56. Klement RJ. The emerging role of ketogenic diets in cancer treatment. Curr Opin Clin Nutr Metab Care. 2019; 22:129–34. https://doi.org/10.1097/MCO.0000000000000540 [PubMed]
- 60. Lettieri-Barbato D, Aquilano K. Pushing the Limits of Cancer Therapy: The Nutrient Game. Front Oncol. 2018; 8:148. https://doi.org/10.3389/fonc.2018.00148 [PubMed]
- 61. Chae YK, Arya A, Malecek MK, Shin DS, Carneiro B, Chandra S, Kaplan J, Kalyan A, Altman JK, Platanias L, Giles F. Repurposing metformin for cancer treatment: current clinical studies. Oncotarget. 2016; 7:40767–80. https://doi.org/10.18632/oncotarget.8194 [PubMed]
- 62. MacKenzie MJ, Ernst S, Johnson C, Winquist E. A phase I study of temsirolimus and metformin in advanced solid tumours. Invest New Drugs. 2012; 30:647–52. https://doi.org/10.1007/s10637-010-9570-8 [PubMed]
- 63. Kritharis A, Caplain J, Rajagopal S, Grimm E, Tsichlis PN, Martell R, Saif WM. A phase I study of metformin and chemotherapy in salid tumors. J Clin Oncol. 2014; 32:5. https://doi.org/10.1200/jco.2014.32.15_suppl.2560
- 64. Kordes S, Pollak MN, Zwinderman AH, Mathôt RA, Weterman MJ, Beeker A, Punt CJ, Richel DJ, Wilmink JW. Metformin in patients with advanced pancreatic cancer: a double-blind, randomised, placebo-controlled phase 2 trial. Lancet Oncol. 2015; 16:839–47. https://doi.org/10.3389/fendo.2018.00372 [PubMed]
- 65. Andrzejewski S, Siegel PM, St-Pierre J. Metabolic Profiles Associated With Metformin Efficacy in Cancer. . Front Endocrinol (Lausanne). 2018; 9:372. https://doi.org/10.3389/fendo.2018.00372 [PubMed]
- 66. Cuyàs E, Buxó M, Ferri Iglesias MJ, Verdura S, Pernas S, Dorca J, Álvarez I, Martínez S, Pérez-Garcia JM, Batista-López N, Rodríguez-Sánchez CA, Amillano K, Domínguez S, et al. The C allele of ATM rs11212617 associates with higher pathological complete remission rate in breast cancer patients treated with neoadjuvant metformin. Front Oncol. 2019; 9:193. https://doi.org/10.3389/fonc.2019.00193 [PubMed]
- 67. Jackson RC. Pharmacodynamic modelling of biomarker data in oncology. ISRN Pharmacol. 2012; 2012:590626. https://doi.org/10.5402/2012/590626 [PubMed]
- 68. Riera-Borrull M, Rodríguez-Gallego E, Hernández-Aguilera A, Luciano F, Ras R, Cuyàs E, Camps J, Segura-Carretero A, Menendez JA, Joven J, Fernández-Arroyo S. Exploring the Process of Energy Generation in Pathophysiology by Targeted Metabolomics: Performance of a Simple and Quantitative Method. J Am Soc Mass Spectrom. 2016; 27:168–77. https://doi.org/10.1007/s13361-015-1262-3 [PubMed]
- 69. Fernández-Arroyo S, Cuyàs E, Bosch-Barrera J, Alarcón T, Joven J, Menendez JA. Activation of the methylation cycle in cells reprogrammed into a stem cell-like state. Oncoscience. 2016; 2:958–67. https://doi.org/10.18632/oncoscience.280 [PubMed]
- 70. Riera-Borrull M, García-Heredia A, Fernández-Arroyo S, Hernández-Aguilera A, Cabré N, Cuyàs E, Luciano-Mateo F, Camps J, Menendez JA, Joven J. Metformin Potentiates the Benefits of Dietary Restraint: A Metabolomic Study. Int J Mol Sci. 2017; 18:E2263. https://doi.org/10.3390/ijms18112263 [PubMed]