


Introduction
Over the past decades, major advances have been made in the understanding of the role of amyloid and cerebrovascular pathology in the onset and progression of Alzheimer’s disease (AD) [1]. However, the underlying number of pathological changes and the subsequent final trigger leading to clinical disease manifestation, remain largely unclear. AD has a strong genetic component with a heritability of 60-80%, with additional AD-susceptibility genes that are still being identified [2,3]. These findings suggest that an individual’s genetic architecture is key in determining if and when disease emerges [2–4]. Notwithstanding the importance of environmental and lifestyle factors, it remains difficult to quantify to what extent this genetic predisposition is deterministic for AD onset.
Originated in cancer research, multistage models have been used to gain more insight in the number of steps before disease manifestation. These models are able to estimate the number of steps (‘mutations’) required for a healthy cell to become malignant [5]. After undergoing several of these rate-limiting steps, the last mutation will ultimately lead to clinical manifestation of the disease. These models have yielded consistent findings across a variety of cancers, supporting the notion that the occurrence of cancer is the end result of seven, successful mutations [5].
Cancer and neurodegenerative disease, including AD as its most common form, may be seen as two opposite ends in cell proliferation. Yet they share biological and clinical characteristics, including dysregulations in key DNA repair and inflammation processes, an increasing incidence with advancing age, and rapid disease progression after diagnosis [6,7]. Moreover, they share a complex inheritance pattern with genetic pleiotropy [8]. For instance, a recent GWAS found a positive genetic correlation between AD and cancer genes, further supporting the genetic overlap between these two diseases [8].
Given the commonalities between neurodegenerative diseases and cancer, the multistage model has recently been successfully applied to model the incidence rate of amyotrophic lateral sclerosis, a rare neurodegenerative disease, as a six-step process [9]. So far, this multistage modelling has not been used for AD. We therefore applied a multistage model within a large, population-based study to test the hypothesis that AD is a multistage process. We determined the number of steps required for disease onset and hypothesized that if AD complies with a multistage process, the number of steps will be smaller in genetically predisposed individuals as these individuals may already inherited one of these key steps.
Results
During a follow-up of up to 26.1 years, 1,124 out of 9,362 participants were diagnosed with AD, (median follow-up 10.3 years [interquartile range 10.1 years].). Table 1 shows the baseline characteristics of the study population. In this sample, 58.2% of the participants were women. Of the included participants, 2,624 were APOE ε4 carriers (28.0%).
Table 1. Baseline characteristics of total study population.
| Characteristic | Study population (N=9,362) | ||||||||||||||||||||||||||||||||||||||||||||||||||||||||||||||||||||||||||||||||||||||||||||||||||
| Age, median (IQR), y | 65.0 (12.6) | ||||||||||||||||||||||||||||||||||||||||||||||||||||||||||||||||||||||||||||||||||||||||||||||||||
| Women | 5,453 (58.2) | ||||||||||||||||||||||||||||||||||||||||||||||||||||||||||||||||||||||||||||||||||||||||||||||||||
| APOE ・4 carrier | 2,624 (28.0) | ||||||||||||||||||||||||||||||||||||||||||||||||||||||||||||||||||||||||||||||||||||||||||||||||||
| Weighted genetic risk score | |||||||||||||||||||||||||||||||||||||||||||||||||||||||||||||||||||||||||||||||||||||||||||||||||||
| First tertile | 3,146 (33.6) | ||||||||||||||||||||||||||||||||||||||||||||||||||||||||||||||||||||||||||||||||||||||||||||||||||
| Second tertile | 3,120 (33.3) | ||||||||||||||||||||||||||||||||||||||||||||||||||||||||||||||||||||||||||||||||||||||||||||||||||
| Third tertile | 3,096 (33.1) | ||||||||||||||||||||||||||||||||||||||||||||||||||||||||||||||||||||||||||||||||||||||||||||||||||
| Educational level | |||||||||||||||||||||||||||||||||||||||||||||||||||||||||||||||||||||||||||||||||||||||||||||||||||
| Primary | 1,689 (18.3) | ||||||||||||||||||||||||||||||||||||||||||||||||||||||||||||||||||||||||||||||||||||||||||||||||||
| Lower | 3,941 (42.6) | ||||||||||||||||||||||||||||||||||||||||||||||||||||||||||||||||||||||||||||||||||||||||||||||||||
| Further | 2,512 (27.2) | ||||||||||||||||||||||||||||||||||||||||||||||||||||||||||||||||||||||||||||||||||||||||||||||||||
| Higher | 1,101 (11.9) | ||||||||||||||||||||||||||||||||||||||||||||||||||||||||||||||||||||||||||||||||||||||||||||||||||
| Body mass index, mean (SD), kg/m2 | 26.8 (3.9) | ||||||||||||||||||||||||||||||||||||||||||||||||||||||||||||||||||||||||||||||||||||||||||||||||||
| Systolic blood pressure, mmHg, mean (SD) | 140 (22) | ||||||||||||||||||||||||||||||||||||||||||||||||||||||||||||||||||||||||||||||||||||||||||||||||||
| Diastolic blood pressure, mmHg, mean (SD) | 76 (12) | ||||||||||||||||||||||||||||||||||||||||||||||||||||||||||||||||||||||||||||||||||||||||||||||||||
| Total cholesterol, mmol/L, mean (SD) | 6.3 (1.2) | ||||||||||||||||||||||||||||||||||||||||||||||||||||||||||||||||||||||||||||||||||||||||||||||||||
| Diabetes mellitus | 1,026 (11.0) | ||||||||||||||||||||||||||||||||||||||||||||||||||||||||||||||||||||||||||||||||||||||||||||||||||
| Smoking status | |||||||||||||||||||||||||||||||||||||||||||||||||||||||||||||||||||||||||||||||||||||||||||||||||||
| Never | 3,021 (32.7) | ||||||||||||||||||||||||||||||||||||||||||||||||||||||||||||||||||||||||||||||||||||||||||||||||||
| Former | 4,276 (46.3) | ||||||||||||||||||||||||||||||||||||||||||||||||||||||||||||||||||||||||||||||||||||||||||||||||||
| Current | 1,938 (21.0) | ||||||||||||||||||||||||||||||||||||||||||||||||||||||||||||||||||||||||||||||||||||||||||||||||||
| No alcohol use | 1,416 (17.3) | ||||||||||||||||||||||||||||||||||||||||||||||||||||||||||||||||||||||||||||||||||||||||||||||||||
| Abbreviations: APOE, apolipoprotein E; IQR, interquartile range; SD, standard deviation. Data are presented as number (percentage) of participants unless otherwise indicated. Values are shown without imputation and therefore not always add up to 100%. | |||||||||||||||||||||||||||||||||||||||||||||||||||||||||||||||||||||||||||||||||||||||||||||||||||
Multistep model
The adjusted R-squared for the relation between log AD incidence rate and log age was 0.93, indicating a linear correlation, which is in line with the multistage model. The estimate of the slope (number of steps minus 1) for AD was 12.8 (95% confidence interval (CI): 9.0-16.6), indicating that 14 steps are needed for the development of AD (Table 2, Figure 1).
Table 2. Overview of estimates for slopes across groups with different genetic risks.
| Study population | n/N | n-1 (95%CI) | R-squared* | ||||||||||||||||||||||||||||||||||||||||||||||||||||||||||||||||||||||||||||||||||||||||||||||||
| Total study population | 1,124/9,362 | 12.82 (9.01-16.62) | 0.925 | ||||||||||||||||||||||||||||||||||||||||||||||||||||||||||||||||||||||||||||||||||||||||||||||||
| APOE ・4 | Carrier | 481/2,624 | 10.56 (5.96-15.17) | 0.849 | |||||||||||||||||||||||||||||||||||||||||||||||||||||||||||||||||||||||||||||||||||||||||||||||
| Homozygote | 70/213 | 8.92 (5.74-12.11) | 0.923 | ||||||||||||||||||||||||||||||||||||||||||||||||||||||||||||||||||||||||||||||||||||||||||||||||
| Heterozygote | 411/2,411 | 14.93 (8.11-21.75) | 0.878 | ||||||||||||||||||||||||||||||||||||||||||||||||||||||||||||||||||||||||||||||||||||||||||||||||
| Non-carrier | 643/6,738 | 15.02 (11.28-18.76) | 0.946 | ||||||||||||||||||||||||||||||||||||||||||||||||||||||||||||||||||||||||||||||||||||||||||||||||
| Weighted genetic risk score tertile | First | 296/3,146 | 15.04 (9.41-20.68) | 0.885 | |||||||||||||||||||||||||||||||||||||||||||||||||||||||||||||||||||||||||||||||||||||||||||||||
| Second | 376/3,120 | 12.8 (9.94-15.65) | 0.956 | ||||||||||||||||||||||||||||||||||||||||||||||||||||||||||||||||||||||||||||||||||||||||||||||||
| Third | 452/3,096 | 11.72 (7.37-16.08) | 0.886 | ||||||||||||||||||||||||||||||||||||||||||||||||||||||||||||||||||||||||||||||||||||||||||||||||
| Weighted genetic risk score first tertile | APOE ・4 carrier | 124/843 | 8.47 (1.91-15.04) | 0.886 | |||||||||||||||||||||||||||||||||||||||||||||||||||||||||||||||||||||||||||||||||||||||||||||||
| APOE ・4 non-carrier | 172/2,303 | 15.3 (11.77-18.82) | 0.954 | ||||||||||||||||||||||||||||||||||||||||||||||||||||||||||||||||||||||||||||||||||||||||||||||||
| Weighted genetic risk score second tertile | APOE ・4 carrier | 161/930 | 10.31 (6.83-13.79) | 0.905 | |||||||||||||||||||||||||||||||||||||||||||||||||||||||||||||||||||||||||||||||||||||||||||||||
| APOE ・4 non-carrier | 215/2,190 | 15.54 (12.02-19.05) | 0.955 | ||||||||||||||||||||||||||||||||||||||||||||||||||||||||||||||||||||||||||||||||||||||||||||||||
| Weighted genetic risk score third tertile | APOE ・4 carrier | 196/851 | 8.93 (3.51-14.36) | 0.738 | |||||||||||||||||||||||||||||||||||||||||||||||||||||||||||||||||||||||||||||||||||||||||||||||
| APOE ・4 non-carrier | 256/2,245 | 14.39 (9.81-18.97) | 0.915 | ||||||||||||||||||||||||||||||||||||||||||||||||||||||||||||||||||||||||||||||||||||||||||||||||
| Abbreviations: APOE, apolipoprotein E; n, number of incident Alzheimer’s disease events; N, total number of participants; n-1, estimate for slope (i.e. number of steps minus 1). | |||||||||||||||||||||||||||||||||||||||||||||||||||||||||||||||||||||||||||||||||||||||||||||||||||
| *Obtained from linear regression model log(Alzheimer’s disease incidencei) = β0 + β1*log(agei) | |||||||||||||||||||||||||||||||||||||||||||||||||||||||||||||||||||||||||||||||||||||||||||||||||||
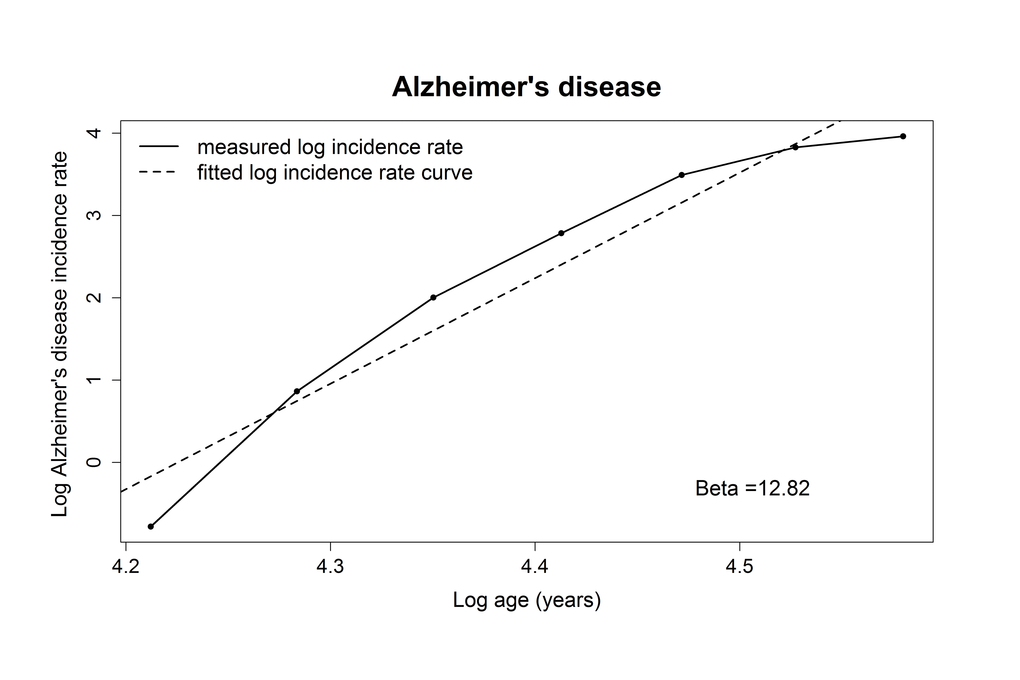
Figure 1. Plotted log incidence rate of Alzheimer’s disease (y-axis) against log age (x-axis). The dashed line shows the most optimal linear correlation.
Considering genetic risk
When considering only the APOE-related risk of developing AD, we found that APOE ε4 genotype non-carriers needed more steps to develop AD compared to APOE ε4 carriers (16 steps for non-carriers, 12 for carriers). In an exploratory analysis, we also examined the number of steps among participants homo- or heterozygous for APOE ε4 separately. Participants homozygous for the APOE ε4 allele required 10 steps, while participants heterozygous for APOE with ε3 and ε4 or ε2 and ε4 required 16 steps to develop AD. Similarly, we found for participants in the low-risk tertile of the genetic risk score that more steps were required to develop AD compared to those in the high-risk tertile (16 steps versus 13 steps). When stratifying on both APOE ε4 carrier ship and the genetic risk score, we found that for every increase in tertile of the genetic risk score, APOE ε4 carriers needed less steps to develop AD compared to the APOE ε4 non-carriers. This translated into ten steps for APOE ε4 carriers in the high-risk tertile, compared to 16 steps for non-carriers for APOE in the low-risk tertile (Table 2).
Discussion
In this population-based study using long-term follow-up of AD, we found evidence that the development of AD follows a multistage process with 14 steps. This indicates that 14 steps are required for the clinical occurrence of AD in the general population. The number of steps was modified by the level of genetic predisposition, translating into six less steps for those individuals at highest genetic risk for AD, compared to those at the lowest genetic risk.
The multistage models have been extensively used in cancer research to provide more insight in their underlying pathogenesis [10–14]. Several studies showed that seven steps were required to develop cancer, which may reflect somatic mutations, genomic rearrangements, or changes in tissue interactions and environment. Neurodegenerative diseases show several similarities with cancer such as dysregulation of DNA repair mechanisms. Yet, the multistage model has only been applied to amyotrophic lateral sclerosis which appears to follow a multistage process with six rate-limiting steps. In this study, we show that AD also can also be modelled as a multistage condition consisting of 14 steps, stressing the genetic complexity and the variety of potential biological pathways involved in the development of this disease.
We found that the number of steps for AD differed between individuals with different degrees of genetic predisposition. APOE ε4 carriers require a smaller number of steps to develop AD compared to APOE ε4 non-carriers. Moreover, these effects became even more pronounced when additionally considering 23 AD-associated genetic variants. Compared to those at highest genetic risk (i.e. APOE ε4 carrier and within the third tertile of the weighted genetic score), individuals at lowest genetic risk (i.e. APOE ε4 non-carrier and within the first tertile of weighted genetic score) needed six more rate-limiting steps to develop AD. These findings are in line with previous observations in cancer research showing different thresholds before disease becomes clinically apparent between inherited and sporadic cancer events. For instance, individuals with familial adenomatous polyposis are at increased risk of colon cancer due to one mutated copy of the APC gene. It has been shown that these individuals need one step fewer in the overall pathological process to develop clinical colon cancer than individuals without this mutated gene [10]. Furthermore, children with inherited retinoblastoma required only one hit to develop this disease, whilst sporadic retinoblastoma cases became clinically apparent after two hits [15]. Our findings may suggest that individuals with genetic predisposition begin several stages further down the chain of the required pathological threshold before AD becomes clinically apparent.
Although our findings suggest that 14 steps are needed for AD to emerge clinically, the underlying biological pathways and changes reflected by these steps still need to be identified. To date, eight different biological pathways involved in the pathogenesis of AD have been identified using genetic variants in AD [16]. The APOE ε4 allele is the most significant genetic risk factor due to its high prevalence and strong relation to AD. It is involved in four of these pathways, including cholesterol transport, hematopoietic cell lineage, clathrin/AP2 adaptor complex, and protein folding pathways. Our finding that APOE ε4 non-carriers need four more steps before AD clinically manifests compared to APOE ε4 carriers taps into this observation, and could indicate that changes in the abovementioned four pathways are indeed necessary to acquire before AD manifests clinically. This could mean that these pathways are already changed or dysregulated at birth in APOE ε4 carriers, indicating that these individuals subsequently have a lower resilience to the development of dementia. This could in turn lead to a lower required number of subsequent steps before disease manifestation. Indeed, up to 18% of the APOE ε4 carriers in this study developed AD during follow-up, yet the lifetime risk of AD among these individuals is even higher with almost half of all them developing AD in their remaining lifetime. For carriers homozygous for APOE ε4 in the high-risk tertile, this risk is even higher, and the disease moreover manifests earlier, with a 29-year difference in age at onset for AD, compared to homozygous APOE carriers at the low-risk tertile of the genetic risk score [2].
The search of finding successful AD therapies is among the most challenging and expensive healthcare issue to date. So far, many disease-modifying agents aim to reduce the production of amyloid-beta (Aβ), or target a specific but single part of the disease process [17]. Our present study shows that as many as 14 steps are required before AD becomes clinically apparent. This high number of required steps may signal the need to develop multi-domain approaches to target various underlying disease-processes simultaneously in order to halt or deter neurodegeneration.
Several limitations of this study need to be discussed. Firstly, although the use of multistage models produces a number as simple, and concrete result, its exact biological meaning is complex and remains hard to interpret. For instance, multistage models reflect the notion and the trajectory of a single cell or cell lineage to become malignant in several rate limiting steps in cancer research. However, the biological unit and meaning of these independent steps is more variable in the case of AD, as indeed it is for other neurodegenerative diseases such as ALS. This could for instance reflect an essential pathophysiological change in a single neurovascular unit, but could also relate to a key genetic mutation in a single cell or cell lineage. Secondly, the underlying multistage model assumes that disease development is predominantly genetically determined. This means that a certain number of steps, all with a similar exposure time, have to occur before the specific disease manifests clinically. In most instances, this means that the exposure under study must be present at birth or during an individual’s early life, such as their genes, ethnicity, sex or environmental factors present from birth onwards. This leaves little room for the incorporation of environmental factors that start later in life, such as smoking. While AD has a strong genetic component [2]. the importance of lifestyle and environmental factors is also substantial [18,19]. These factors remain however in part unaddressed in the current multistage models. Some studies in cancer epidemiology have tried to model these effects in more complex multistage models, but the results of these models turned out to be difficult to interpret and are currently poorly validated [10]. Since this is the first application of the multistage modelling in AD, we relied on a more simple, yet widely used multistage model. Future research is encouraged to incorporate (time-varying) extensions with environmental and lifestyle factors. Thirdly, results derived from exploratory analyses amongst participants either homo- or heterozygous for APOE ε4 should be interpreted with caution as these analyses are based on relatively small sample sizes. Fourthly, due to various reasons including for instance selection bias, the presented frequencies of homo- and heterozygous carriers for the APOE ε4 allele in this population-based cohort study (2.8% homozygous, 25.8% heterozygous), may differ from those in the unselected general population [20]. Nevertheless, the frequencies in this study fell within the reported ranges from several other, large population-based cohort studies (Supplementary Table 1). Finally, estimates of multistage models are vulnerable for several artificial influences on the observed incidence patterns, such as community-wide disease screening programs or misclassification of diagnoses at high ages due to restrained diagnostic work-ups [21]. For some diseases, this subsequently could influence the estimation of the slope and thus the number of steps needed for disease onset. We nevertheless minimized these effects by using a cohort study with standardized and consistent AD ascertainment over time with virtually complete follow-up (>95% of potential person-years).
In conclusion, we found that AD complies with a multistage model characterized by 14 steps that include essential facets of biological change which are required before AD becomes clinically apparent. Moreover, we observed that individuals with a higher genetic susceptibility require less of these additional steps before disease manifests clinically. Future research is warranted to validate the number of steps, to study the effects of environmental and lifestyle factors, and to further investigate the processes underlying these rate-limiting steps. These findings could further increase the understanding of the pathogenesis of AD, which in turn could benefit the development of prevention and treatment strategies.
Materials and Methods
Study design
This study was embedded within the Rotterdam Study, a prospective population-based cohort designed to study the occurrence and determinants of age-related diseases in the general population. Details regarding the objectives and design have been reported previously [22]. Briefly, in 1990 inhabitants aged ≥55 years from a well-defined suburb in the city of Rotterdam, the Netherlands were invited to participate. The initial cohort comprised 7,983 individuals. In 2000, 3,011 individuals who had become 55 years of age or moved into the study district since the start of the study if aged ≥55 years, were added to the cohort. In 2006, a further extension of the cohort was initiated in which 3,932 individuals were included, aged ≥45 years. In total, the Rotterdam Study comprises 14,926 individuals aged ≥45 years. The overall response rate for all three recruitment waves was 72%.
This study is registered with the Netherlands National Trial Register and WHO International Clinical Trials Registry Platform under the shared catalogue number NTR6831. The Rotterdam Study was approved by the medical ethics committee of the Erasmus MC University Medical Center Rotterdam (registration number MEC 02.1015) and by the Dutch Ministry of Health, Welfare and Sport (Population Screening Act WBO, license number 1071272-159521-PG). Written informed consent was obtained for all participants. This study is registered with the Netherlands National Trial Register and WHO International Clinical Trials Registry Platform under the shared catalogue number NTR6831.
To model AD as a multistage process, we excluded participants with a history of any type of dementia at baseline (N=531) and those who were insufficiently screened for dementia (N=637). We further excluded participants who did not provide informed consent to access medical records or hospital discharge letters (N=159). Lastly, participants without information on their APOE genotype (N=964) or AD-associated genetic variants to calculate the genetic risk score (N=1,565) were excluded, leaving 11,070 participants for analyses (Figure 2).
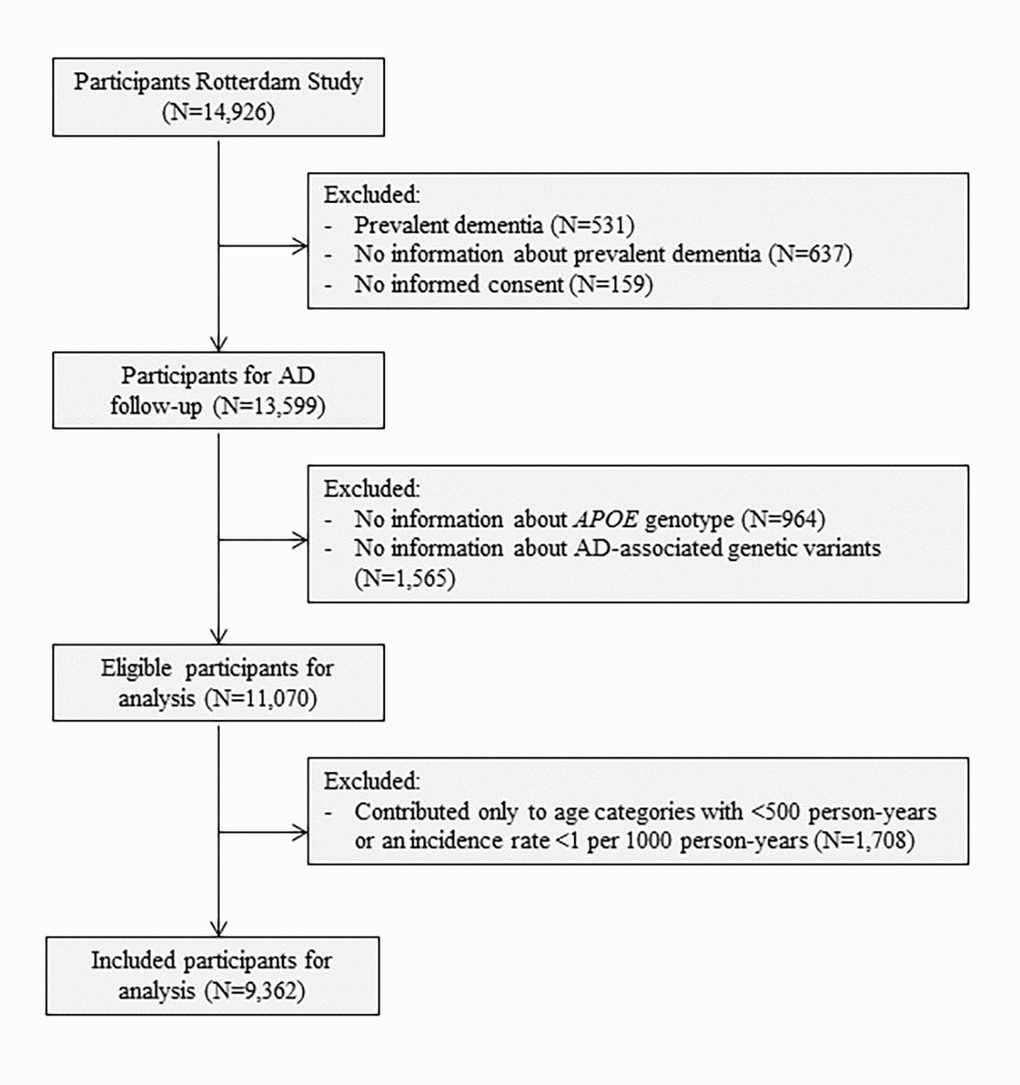
Figure 2. Flowchart of study population. Abbreviations: AD, Alzheimer’s disease; APOE, Apolipoprotein E.
APOE genotyping and calculation of a weighted genetic risk score
DNA was extracted from blood samples drawn by venepuncture at baseline. APOE genotype was determined using polymerase chain reaction on coded DNA samples in the initial cohort and with a bi-allelic TaqMan assay (rs7412 and rs429358) in the two extensions (RS-II and RS-III). The majority of samples (81.1%) were further genotyped with the Illumina 610K and 660K chips and imputed to the Haplotype Reference Consortium reference panel (version 1.0) with Minimac 3. We included 23 genetic variants that showed genome wide significant evidence of association with AD to calculate a weighted genetic risk score (Supplementary Table 2 for an overview of the included variants) [9,23–37]. This score was calculated as the sum of the products of single nucleotide polymorphism dosages of the 23 genetic variants (excluding APOE) and their respective reported effect estimates. All 23 variants selected for the calculation of the genetic risk score were well imputed (imputation score R2 > 0.3, median 0.99).
Ascertainment methods of dementia
Baseline and follow-up ascertainment methods for dementia have previously been described in detail [19]. Participants were screened for dementia at baseline and subsequent centre visits with the Mini-Mental State Examination and the Geriatric Mental Schedule organic level. Those with a Mini-Mental State Examination score <26 or Geriatric Mental Schedule score >0 underwent further investigation and informant interview, including the Cambridge Examination for Mental Disorders of the Elderly. All participants also underwent routine cognitive assessment. In addition, the entire cohort was continuously under surveillance for dementia through electronic linkage of the study database with medical records from general practitioners and the regional institute for outpatient mental health care. Available information on cognitive testing and clinical neuroimaging was used when required for diagnosis of dementia subtype. A consensus panel led by a consultant neurologist established the final diagnosis according to standard criteria for AD (NINCDS–ADRDA). Participants were censored at date of any type of dementia diagnosis, death, loss to follow-up, or 1st January 2016, whichever came first. Follow-up was virtually complete (96.3% of potential person-years) [38].
The multistage model
Multistage models originate from cancer epidemiology, where they were first employed to study the age distribution of several cancer types [5,12,39,40]. Within this framework it is assumed that cancer manifests clinically after a certain threshold number has been reached composed of n mutations within one cell. This threshold for disease occurrence in that cell has a certain probability distribution over time (t), e.g. for an individual the nth mutation occurs at age 50, whereas for another individual this nth mutation may occur at age 80. Of the required mutations, (n
It was noted in cancer epidemiology that the age-specific incidence rate of cancer (‘i’) roughly coincided with the probability that at least one cell of all independent cells acquired the necessary number of seven mutations by that specific age. This means that for most types of cancer six preceding rate-limiting steps (n
in which c is a constant number containing
Statistical analysis
We applied a multistage model to determine the slope and the number of steps for the development and clinical onset of AD. In line with previous studies, the incidence rate of AD was calculated per five years age categories [5,9]. Each participant contributed person-years to specific age categories, until the age at AD diagnosis or censoring. To minimize the effects of outliers on the slope of the model, we excluded age categories with less than 500 person-years or with an incidence rate below 1 per 1000 person-years given that estimated incidence rates often become instable in the extremes of the age distribution [40]. This additional criterion resulted in an exclusion of 213,530.6 person-years, which corresponded to the exclusion of 1,708 of the 11,070 participants with age at AD or censoring below the first included age category. This left 9,362 participants available for the final analyses (Figure 2). The incidence rate of AD and the five-years age categories (log age) were natural log-transformed. Linearity was tested based on the adjusted R-squared obtained from a linear regression model with log age and incidence rate of AD as outcome. Linear models were unadjusted.
Additionally, we stratified according to APOE ε4 carrier status and on tertiles of a weighted genetic risk score in mutually exclusive categories of genetic risk and by combining both in order to be able to stratify those individuals with the lowest and those with the highest AD genetic risk.
Data were handled and analysed with SPSS Statistics version 24.0.0.1 (IBM Corp., Armonk, NY) and R, CRAN version 3.4.3.
Supplementary Materials
Acknowledgments
We acknowledge the dedication, commitment, and contribution of inhabitants, general practitioners, and pharmacists of the Ommoord district who took part in the Rotterdam Study. We acknowledge Frank van Rooij as data manager, and Brenda C.T. Leening-Kieboom as study coordinator.
Conflicts of Interest
We declare no competing interests.
Funding
The Rotterdam Study is funded by Erasmus Medical Center and Erasmus University, Rotterdam, Netherlands Organization for the Health Research and Development (ZonMw), the Research Institute for Diseases in the Elderly (RIDE), the Ministry of Education, Culture and Science, the Ministry for Health, Welfare and Sports, the European Commission (DG XII), and the Municipality of Rotterdam. Further support was obtained from the Netherlands Consortium for Healthy Ageing and the Dutch Heart Foundation (2012T008) and the Dutch Cancer Society (NKI-20157737).
References
- 1. Winblad B, Amouyel P, Andrieu S, Ballard C, Brayne C, Brodaty H, Cedazo-Minguez A, Dubois B, Edvardsson D, Feldman H, Fratiglioni L, Frisoni GB, Gauthier S, et al. Defeating Alzheimer’s disease and other dementias: a priority for European science and society. Lancet Neurol. 2016; 15:455–532. https://doi.org/10.1016/S1474-4422(16)00062-4 [PubMed]
- 2. van der Lee SJ, Wolters FJ, Ikram MK, Hofman A, Ikram MA, Amin N, van Duijn CM. The effect of APOE and other common genetic variants on the onset of Alzheimer’s disease and dementia: a community-based cohort study. Lancet Neurol. 2018; 17:434–44. https://doi.org/10.1016/S1474-4422(18)30053-X [PubMed]
- 3. Van Cauwenberghe C, Van Broeckhoven C, Sleegers K. The genetic landscape of Alzheimer disease: clinical implications and perspectives. Genet Med. 2016; 18:421–30. https://doi.org/10.1038/gim.2015.117 [PubMed]
- 4. Gatz M, Reynolds CA, Fratiglioni L, Johansson B, Mortimer JA, Berg S, Fiske A, Pedersen NL. Role of genes and environments for explaining Alzheimer disease. Arch Gen Psychiatry. 2006; 63:168–74. https://doi.org/10.1001/archpsyc.63.2.168 [PubMed]
- 5. Armitage P, Doll R. The age distribution of cancer and a multi-stage theory of carcinogenesis. Br J Cancer. 1954; 8:1–12. https://doi.org/10.1038/bjc.1954.1 [PubMed]
- 6. Driver JA. Inverse association between cancer and neurodegenerative disease: review of the epidemiologic and biological evidence. Biogerontology. 2014; 15:547–57. https://doi.org/10.1007/s10522-014-9523-2 [PubMed]
- 7. van der Willik KD, Ruiter R, Wolters FJ, Ikram MK, Stricker BH, Hauptmann M, Compter A, Schagen SB, Ikram MA. Mild cognitive impairment and dementia show contrasting associations with risk of cancer. Neuroepidemiology. 2018; 50:207–15. https://doi.org/10.1159/000488892 [PubMed]
- 8. Feng YA, Cho K, Lindstrom S, Kraft P, Cormack J, Liang L, Driver JA, and IGAP Consortium, Colorectal Transdisciplinary Study (CORECT), and Discovery, Biology, and Risk of Inherited Variants in Breast Cancer (DRIVE), and Elucidating Loci Involved in Prostate Cancer Susceptibility (ELLIPSE), and Transdisciplinary Research in Cancer of the Lung (TRICL). Investigating the genetic relationship between Alzheimer’s disease and cancer using GWAS summary statistics. Hum Genet. 2017; 136:1341–51. https://doi.org/10.1007/s00439-017-1831-6 [PubMed]
- 9. Al-Chalabi A, Calvo A, Chio A, Colville S, Ellis CM, Hardiman O, Heverin M, Howard RS, Huisman MH, Keren N, Leigh PN, Mazzini L, Mora G, et al. Analysis of amyotrophic lateral sclerosis as a multistep process: a population-based modelling study. Lancet Neurol. 2014; 13:1108–13. https://doi.org/10.1016/S1474-4422(14)70219-4 [PubMed]
- 10. Frank SA. Age-specific incidence of inherited versus sporadic cancers: a test of the multistage theory of carcinogenesis. Proc Natl Acad Sci USA. 2005; 102:1071–75. https://doi.org/10.1073/pnas.0407299102 [PubMed]
- 11. Hornsby C, Page KM, Tomlinson IP. What can we learn from the population incidence of cancer? Armitage and Doll revisited. Lancet Oncol. 2007; 8:1030–38. https://doi.org/10.1016/S1470-2045(07)70343-1 [PubMed]
- 12. Luebeck EG, Moolgavkar SH. Multistage carcinogenesis and the incidence of colorectal cancer. Proc Natl Acad Sci USA. 2002; 99:15095–100. https://doi.org/10.1073/pnas.222118199 [PubMed]
- 13. Schöllnberger H, Manuguerra M, Bijwaard H, Boshuizen H, Altenburg HP, Rispens SM, Brugmans MJ, Vineis P. Analysis of epidemiological cohort data on smoking effects and lung cancer with a multi-stage cancer model. Carcinogenesis. 2006; 27:1432–44. https://doi.org/10.1093/carcin/bgi345 [PubMed]
- 14. Zhang X, Simon R. Estimating the number of rate limiting genomic changes for human breast cancer. Breast Cancer Res Treat. 2005; 91:121–24. https://doi.org/10.1007/s10549-004-5782-y [PubMed]
- 15. Knudson AG
Jr . Mutation and cancer: statistical study of retinoblastoma. Proc Natl Acad Sci USA. 1971; 68:820–23. https://doi.org/10.1073/pnas.68.4.820 [PubMed] - 16. Ahmad S, Bannister C, van der Lee SJ, Vojinovic D, Adams HH, Ramirez A, Escott-Price V, Sims R, Baker E, Williams J, Holmans P, Vernooij MW, Ikram MA, et al. Disentangling the biological pathways involved in early features of Alzheimer’s disease in the Rotterdam Study. Alzheimers Dement. 2018; 14:848–57. https://doi.org/10.1016/j.jalz.2018.01.005 [PubMed]
- 17. Egan MF, Kost J, Tariot PN, Aisen PS, Cummings JL, Vellas B, Sur C, Mukai Y, Voss T, Furtek C, Mahoney E, Harper Mozley L, Vandenberghe R, et al. Randomized trial of verubecestat for mild-to-moderate Alzheimer’s Disease. N Engl J Med. 2018; 378:1691–703. https://doi.org/10.1056/NEJMoa1706441 [PubMed]
- 18. Norton S, Matthews FE, Barnes DE, Yaffe K, Brayne C. Potential for primary prevention of Alzheimer’s disease: an analysis of population-based data. Lancet Neurol. 2014; 13:788–94. https://doi.org/10.1016/S1474-4422(14)70136-X [PubMed]
- 19. de Bruijn RF, Bos MJ, Portegies ML, Hofman A, Franco OH, Koudstaal PJ, Ikram MA. The potential for prevention of dementia across two decades: the prospective, population-based Rotterdam Study. BMC Med. 2015; 13:132. https://doi.org/10.1186/s12916-015-0377-5 [PubMed]
- 20. Qian J, Wolters FJ, Beiser A, Haan M, Ikram MA, Karlawish J, Langbaum JB, Neuhaus JM, Reiman EM, Roberts JS, Seshadri S, Tariot PN, Woods BM, et al. APOE-related risk of mild cognitive impairment and dementia for prevention trials: an analysis of four cohorts. PLoS Med. 2017; 14:e1002254. https://doi.org/10.1371/journal.pmed.1002254 [PubMed]
- 21. Møller B, Weedon-Fekjaer H, Hakulinen T, Tryggvadóttir L, Storm HH, Talbäck M, Haldorsen T. The influence of mammographic screening on national trends in breast cancer incidence. Eur J Cancer Prev. 2005; 14:117–28. https://doi.org/10.1097/00008469-200504000-00007 [PubMed]
- 22. Ikram MA, Brusselle GG, Murad SD, van Duijn CM, Franco OH, Goedegebure A, Klaver CC, Nijsten TE, Peeters RP, Stricker BH, Tiemeier H, Uitterlinden AG, Vernooij MW, Hofman A. The Rotterdam Study: 2018 update on objectives, design and main results. Eur J Epidemiol. 2017; 32:807–50. https://doi.org/10.1007/s10654-017-0321-4 [PubMed]
- 23. Harold D, Abraham R, Hollingworth P, Sims R, Gerrish A, Hamshere ML, Pahwa JS, Moskvina V, Dowzell K, Williams A, Jones N, Thomas C, Stretton A, et al. Genome-wide association study identifies variants at CLU and PICALM associated with Alzheimer’s disease. Nat Genet. 2009; 41:1088–93. https://doi.org/10.1038/ng.440 [PubMed]
- 24. Lambert JC, Heath S, Even G, Campion D, Sleegers K, Hiltunen M, Combarros O, Zelenika D, Bullido MJ, Tavernier B, Letenneur L, Bettens K, Berr C, et al, and European Alzheimer’s Disease Initiative Investigators. Genome-wide association study identifies variants at CLU and CR1 associated with Alzheimer’s disease. Nat Genet. 2009; 41:1094–99. https://doi.org/10.1038/ng.439 [PubMed]
- 25. Seshadri S, Fitzpatrick AL, Ikram MA, DeStefano AL, Gudnason V, Boada M, Bis JC, Smith AV, Carassquillo MM, Lambert JC, Harold D, Schrijvers EM, Ramirez-Lorca R, et al, and CHARGE Consortium, and GERAD1 Consortium, and EADI1 Consortium. Genome-wide analysis of genetic loci associated with Alzheimer disease. JAMA. 2010; 303:1832–40. https://doi.org/10.1001/jama.2010.574 [PubMed]
- 26. Arakawa S, Takahashi A, Ashikawa K, Hosono N, Aoi T, Yasuda M, Oshima Y, Yoshida S, Enaida H, Tsuchihashi T, Mori K, Honda S, Negi A, et al. Genome-wide association study identifies two susceptibility loci for exudative age-related macular degeneration in the Japanese population. Nat Genet. 2011; 43:1001–04. https://doi.org/10.1038/ng.938 [PubMed]
- 27. Hollingworth P, Harold D, Sims R, Gerrish A, Lambert JC, Carrasquillo MM, Abraham R, Hamshere ML, Pahwa JS, Moskvina V, Dowzell K, Jones N, Stretton A, et al, and Alzheimer’s Disease Neuroimaging Initiative, and CHARGE consortium, and EADI1 consortium. Common variants at ABCA7, MS4A6A/MS4A4E, EPHA1, CD33 and CD2AP are associated with Alzheimer’s disease. Nat Genet. 2011; 43:429–35. https://doi.org/10.1038/ng.803 [PubMed]
- 28. Naj AC, Jun G, Beecham GW, Wang LS, Vardarajan BN, Buros J, Gallins PJ, Buxbaum JD, Jarvik GP, Crane PK, Larson EB, Bird TD, Boeve BF, et al. Common variants at MS4A4/MS4A6E, CD2AP, CD33 and EPHA1 are associated with late-onset Alzheimer’s disease. Nat Genet. 2011; 43:436–41. https://doi.org/10.1038/ng.801 [PubMed]
- 29. Knol MJ, VanderWeele TJ. Recommendations for presenting analyses of effect modification and interaction. Int J Epidemiol. 2012; 41:514–20. https://doi.org/10.1093/ije/dyr218 [PubMed]
- 30. Fritsche LG, Chen W, Schu M, Yaspan BL, Yu Y, Thorleifsson G, Zack DJ, Arakawa S, Cipriani V, Ripke S, Igo RP
Jr , Buitendijk GH, Sim X, et al, and AMD Gene Consortium. Seven new loci associated with age-related macular degeneration. Nat Genet. 2013; 45:433–39, e1–2. https://doi.org/10.1038/ng.2578 [PubMed] - 31. Guerreiro R, Wojtas A, Bras J, Carrasquillo M, Rogaeva E, Majounie E, Cruchaga C, Sassi C, Kauwe JS, Younkin S, Hazrati L, Collinge J, Pocock J, et al, and Alzheimer Genetic Analysis Group. TREM2 variants in Alzheimer’s disease. N Engl J Med. 2013; 368:117–27. https://doi.org/10.1056/NEJMoa1211851 [PubMed]
- 32. Jonsson T, Stefansson H, Steinberg S, Jonsdottir I, Jonsson PV, Snaedal J, Bjornsson S, Huttenlocher J, Levey AI, Lah JJ, Rujescu D, Hampel H, Giegling I, et al. Variant of TREM2 associated with the risk of Alzheimer’s disease. N Engl J Med. 2013; 368:107–16. https://doi.org/10.1056/NEJMoa1211103 [PubMed]
- 33. Lambert JC, Ibrahim-Verbaas CA, Harold D, Naj AC, Sims R, Bellenguez C, DeStafano AL, Bis JC, Beecham GW, Grenier-Boley B, Russo G, Thorton-Wells TA, Jones N, et al, and Cohorts for Heart and Aging Research in Genomic Epidemiology. Meta-analysis of 74,046 individuals identifies 11 new susceptibility loci for Alzheimer’s disease. Nat Genet. 2013; 45:1452–58. https://doi.org/10.1038/ng.2802 [PubMed]
- 34. Ruiz A, Dols-Icardo O, Bullido MJ, Pastor P, Rodríguez-Rodríguez E, López de Munain A, de Pancorbo MM, Pérez-Tur J, Alvarez V, Antonell A, López-Arrieta J, Hernández I, Tárraga L, et al, and dementia genetic Spanish consortium (DEGESCO). Assessing the role of the TREM2 p.R47H variant as a risk factor for Alzheimer’s disease and frontotemporal dementia. Neurobiol Aging. 2014; 35:444.e1–4. https://doi.org/10.1016/j.neurobiolaging.2013.08.011 [PubMed]
- 35. Desikan RS, Schork AJ, Wang Y, Thompson WK, Dehghan A, Ridker PM, Chasman DI, McEvoy LK, Holland D, Chen CH, Karow DS, Brewer JB, Hess CP, et al, and Inflammation working group, IGAP and DemGene Investigators. Polygenic overlap between C-reactive protein, plasma lipids, and Alzheimer Disease. Circulation. 2015; 131:2061–69. https://doi.org/10.1161/CIRCULATIONAHA.115.015489 [PubMed]
- 36. Fritsche LG, Igl W, Bailey JN, Grassmann F, Sengupta S, Bragg-Gresham JL, Burdon KP, Hebbring SJ, Wen C, Gorski M, Kim IK, Cho D, Zack D, et al. A large genome-wide association study of age-related macular degeneration highlights contributions of rare and common variants. Nat Genet. 2016; 48:134–43. https://doi.org/10.1038/ng.3448 [PubMed]
- 37. Jun G, Ibrahim-Verbaas CA, Vronskaya M, Lambert JC, Chung J, Naj AC, Kunkle BW, Wang LS, Bis JC, Bellenguez C, Harold D, Lunetta KL, Destefano AL, et al, and IGAP Consortium. A novel Alzheimer disease locus located near the gene encoding tau protein. Mol Psychiatry. 2016; 21:108–17. https://doi.org/10.1038/mp.2015.23 [PubMed]
- 38. Clark TG, Altman DG, De Stavola BL. Quantification of the completeness of follow-up. Lancet. 2002; 359:1309–10. https://doi.org/10.1016/S0140-6736(02)08272-7 [PubMed]
- 39. Frank SA. Commentary: mathematical models of cancer progression and epidemiology in the age of high throughput genomics. Int J Epidemiol. 2004; 33:1179–81. https://doi.org/10.1093/ije/dyh222 [PubMed]
- 40. Frank SA. Age-specific acceleration of cancer. Curr Biol. 2004; 14:242–46. https://doi.org/10.1016/j.cub.2003.12.026 [PubMed]
- 41. Nordling CO. A new theory on cancer-inducing mechanism. Br J Cancer. 1953; 7:68–72. https://doi.org/10.1038/bjc.1953.8 [PubMed]
- 42. Turanyi T. Sensitivity analysis of complex kinetic systems: tools and applications. J Math Chem. 1990; 5:203–48. https://doi.org/10.1007/BF01166355