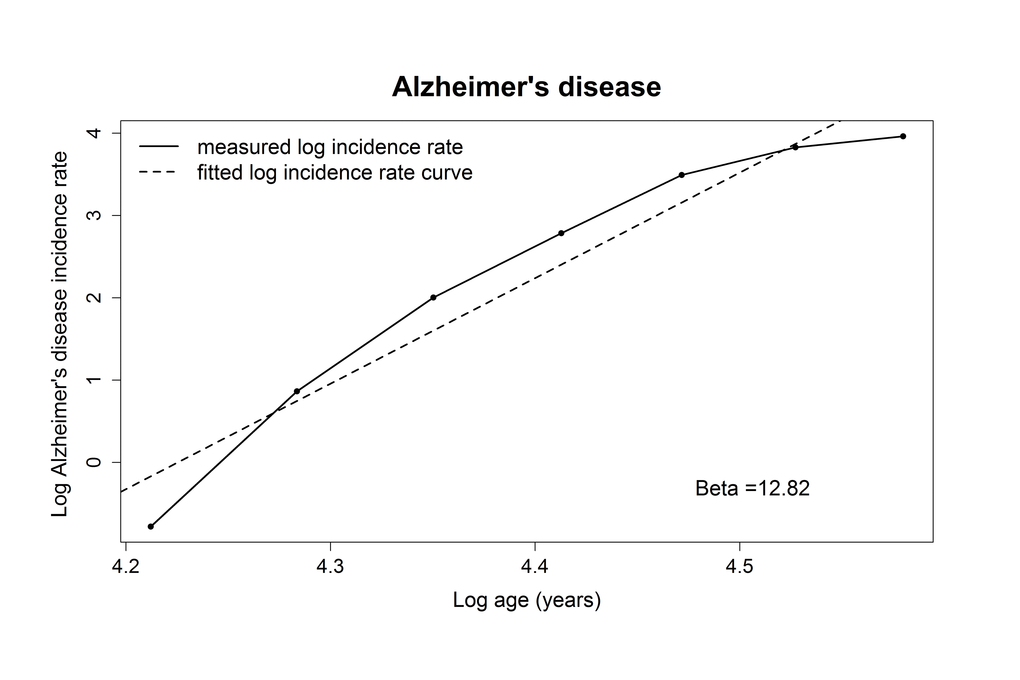
Figure 1.Plotted log incidence rate of Alzheimer’s disease (y-axis) against log age (x-axis). The dashed line shows the most optimal linear correlation.
Figure 1 — Alzheimer’s disease as a multistage process: an analysis from a population-based cohort study | Aging