


Introduction
Endometrial cancer (EC), referred to as uterine corpus endometrial cancer (UCEC), is one of the most common gynaecologic malignancy all over the world and most frequently occurs in postmenopausal women [1,2]. Symptoms arising from UCEC included postmenopausal vaginal bleeding, enlarged uterus, low abdominal pain, and pelvic cramping, which forms the basis of clinical diagnosis [3,4]. There were 569,847 newly registered cases and 311,365 deaths caused by corpus uteri cancer in 2018, causing a serious burden to public health, particularly to people in developing countries [5]. Precision medicine, powered by health record and genetic data of patients, refers to the concept that health care is individually tailored on the basis of a person’s genes, lifestyle and environment. Advances in genomic sequencing has made precision medicine the main melody of current anti-cancer treatment and we attempted to seek reliable genetic changes from the aspect of alternative splicing (AS) to enhance the individualized prognosis prediction of UCEC patients [6].
Alternative splicing (AS) is crucial a mechanism by which the complexity of mammalian and viral proteom increased overwhelmingly [7,8]. Through selective removal of introns and junction of exons, mRNA isoforms with diversified functions can be generated from a single gene [9,10]. AS events occurred in cancer-related genes have significant impact on the progression of human cancers, which is evidenced by the fact that extensive studies reported a large number of AS events in multiple human cancers [11–13]. The occurrence of AS abides by a tissue specific and disease stage specific manner [9].
In UCEC, multiple splice variants of estrogen receptor (ER) and progesterone receptor (PR), two vital molecules that played important roles in the initiation and development of UCEC, were discovered as the results of AS [14]. These receptor variants have been reported to affect the carcinogenesis of UCEC with distinct functions [14–16]. Spliced variants discovered in other genes such as synuclein gamma also implicated the contribution of AS to the tumorigenesis of EC [17]. Convinced of the critical influence of AS events on the tumorigenesis of UCEC, we inferred that AS events might serve as novel prognostic marker for UCEC. Previous studies have indicated that one isoform of ERa: ERaD7 and YT521 exon6-retention mRNA were significantly correlated with the survival of UCEC patients [15,18]. Nevertheless, more unknown AS events in UCEC awaits further excavation. Herein, we pursued the present study on systematically exploring the prognostic significance of AS events in UCEC based on RNA sequencing data in TCGA in order to find promising prognostic predictors for UCEC patients.
Results
A preview of survival-associated AS events in UCEC
In total, 28281 AS events from 8137 genes were detected from 506 UCEC patients. Number of AS events identified in seven AS types were recorded in Table 1. For the 28281 AS events from 8137 genes, ES was the predominant type with the maximum number of AS events (n=9744). The intersecting sets of genes and AS events were visualized by UpSet plot in Figure 1, which indicated that one gene might possessed up to six types of AS. With respect to the relationship between AS events and OS of UCEC patients, a total of 2630 survival-associated AS events in 1752 genes were reported from the univariate Cox regression analysis (P<0.05). The distribution of the 2630 survival-associated splicing events in seven AS types was listed in Table 2. We selected top significant survival-associated AS events (P<0.001) to investigate the enrichment of these AS events in biological functions and pathways as well as the interaction network beneath them. The results showed that these significant survival-associated AS events were obviously clustered in biological processes including viral RNA genome replication, regulation of RNA splicing and spliceosomal complex assembly (P<0.01). Top three pathways assembled by these AS events were snRNP Assembly, COPI-mediated anterograde transport and Insulin receptor recycling (P<0.01) (Table 3) (Figure 2). Molecular Complex Detection (MCODE) was used to screen the modules of the protein-to-protein network using the following parameters: degree cut-off = 2, node score cut-off = 0.2, k-core = 2, and maximum depth = 100 [19–21]. Protein-protein interaction network analysis from Metascape for these genes revealed these AS events were gathered in seven MCODE components (Figure 3).
Table 1. Summary of AS events in UCEC.
| Splicing type | Number of AS events | Number of genes | |||||||||||||||||||||||||||||||||||||||||||||||||||||||||||||||||||||||||||||||||||||||||||||||||
| AA | 2270 | 1691 | |||||||||||||||||||||||||||||||||||||||||||||||||||||||||||||||||||||||||||||||||||||||||||||||||
| AD | 1877 | 1386 | |||||||||||||||||||||||||||||||||||||||||||||||||||||||||||||||||||||||||||||||||||||||||||||||||
| AP | 4458 | 1792 | |||||||||||||||||||||||||||||||||||||||||||||||||||||||||||||||||||||||||||||||||||||||||||||||||
| AT | 7796 | 3411 | |||||||||||||||||||||||||||||||||||||||||||||||||||||||||||||||||||||||||||||||||||||||||||||||||
| ES | 9744 | 4604 | |||||||||||||||||||||||||||||||||||||||||||||||||||||||||||||||||||||||||||||||||||||||||||||||||
| ME | 86 | 85 | |||||||||||||||||||||||||||||||||||||||||||||||||||||||||||||||||||||||||||||||||||||||||||||||||
| RI | 2050 | 1413 | |||||||||||||||||||||||||||||||||||||||||||||||||||||||||||||||||||||||||||||||||||||||||||||||||
| Total | 28281 | 10380 | |||||||||||||||||||||||||||||||||||||||||||||||||||||||||||||||||||||||||||||||||||||||||||||||||
| Note: AA: alternate acceptor; AD: alternate donor; AP: alternate promoter; AT: alternate terminator; ES: exon skip; ME: mutually exclusive exons; RI: retained intron. | |||||||||||||||||||||||||||||||||||||||||||||||||||||||||||||||||||||||||||||||||||||||||||||||||||
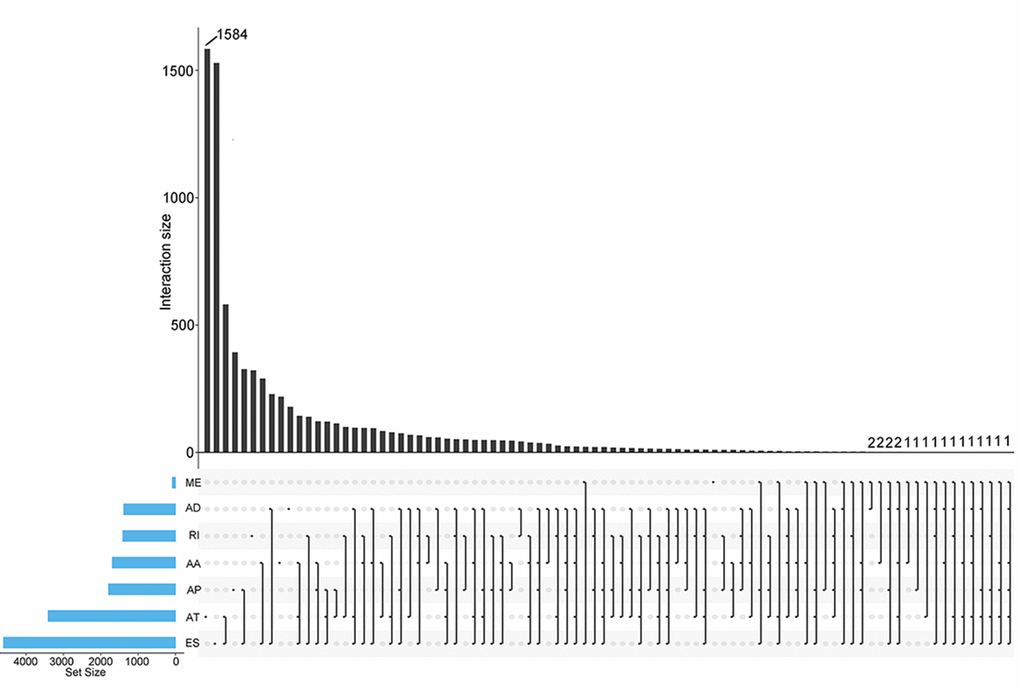
Figure 1. UpSet plots of AS events in UCEC. The horizontal axis and vertical axes represent number of genes in the interacting sets of one or multiple AS types and number of gens in each AS type, respectively. AA: alternate acceptor; AD: alternate donor; AP: alternate promoter; AT: alternate terminator; ES: exon skip; ME: mutually exclusive exons; RI: retained intron.
Table 2. Survival-associated AS events from univariate Cox regression analysis.
| Splicing type | Number of AS events | Number of genes | |||||||||||||||||||||||||||||||||||||||||||||||||||||||||||||||||||||||||||||||||||||||||||||||||
| AA | 172 | 164 | |||||||||||||||||||||||||||||||||||||||||||||||||||||||||||||||||||||||||||||||||||||||||||||||||
| AD | 170 | 159 | |||||||||||||||||||||||||||||||||||||||||||||||||||||||||||||||||||||||||||||||||||||||||||||||||
| AP | 391 | 227 | |||||||||||||||||||||||||||||||||||||||||||||||||||||||||||||||||||||||||||||||||||||||||||||||||
| AT | 793 | 440 | |||||||||||||||||||||||||||||||||||||||||||||||||||||||||||||||||||||||||||||||||||||||||||||||||
| ES | 929 | 796 | |||||||||||||||||||||||||||||||||||||||||||||||||||||||||||||||||||||||||||||||||||||||||||||||||
| ME | 11 | 11 | |||||||||||||||||||||||||||||||||||||||||||||||||||||||||||||||||||||||||||||||||||||||||||||||||
| RI | 164 | 149 | |||||||||||||||||||||||||||||||||||||||||||||||||||||||||||||||||||||||||||||||||||||||||||||||||
| Total | 2630 | 1752 | |||||||||||||||||||||||||||||||||||||||||||||||||||||||||||||||||||||||||||||||||||||||||||||||||
| Note: AA: alternate acceptor; AD: alternate donor; AP: alternate promoter; AT: alternate terminator; ES: exon skip; ME: mutually exclusive exons; RI: retained intron. | |||||||||||||||||||||||||||||||||||||||||||||||||||||||||||||||||||||||||||||||||||||||||||||||||||
Table 3. Pathway and process enrichment analysis for top significant survival-associated AS events.
| GO | Category | Description | Count | % | Log10(P) | Log10(q) | |||||||||||||||||||||||||||||||||||||||||||||||||||||||||||||||||||||||||||||||||||||||||||||
| CORUM:351 | CORUM | spliceosome | 17 | 14.04958678 | -18.01041164 | -13.69903928 | |||||||||||||||||||||||||||||||||||||||||||||||||||||||||||||||||||||||||||||||||||||||||||||
| R-HSA-191859 | Reactome Gene Sets | snRNP assembly | 7 | 5.785123967 | -8.019420114 | -4.986801354 | |||||||||||||||||||||||||||||||||||||||||||||||||||||||||||||||||||||||||||||||||||||||||||||
| R-HSA-6807878 | Reactome Gene Sets | COPI-mediated anterograde transport | 7 | 5.785123967 | -6.0016261 | -3.032676419 | |||||||||||||||||||||||||||||||||||||||||||||||||||||||||||||||||||||||||||||||||||||||||||||
| CORUM:3118 | CORUM | SMN1-SIP1-SNRP complex | 3 | 2.479338843 | -5.565637629 | -2.652205275 | |||||||||||||||||||||||||||||||||||||||||||||||||||||||||||||||||||||||||||||||||||||||||||||
| R-HSA-77387 | Reactome Gene Sets | insulin receptor recycling | 4 | 3.305785124 | -5.020037464 | -2.21381508 | |||||||||||||||||||||||||||||||||||||||||||||||||||||||||||||||||||||||||||||||||||||||||||||
| R-HSA-382551 | Reactome Gene Sets | transport of small molecules | 13 | 10.74380165 | -3.98898093 | -1.462938404 | |||||||||||||||||||||||||||||||||||||||||||||||||||||||||||||||||||||||||||||||||||||||||||||
| R-HSA-72649 | Reactome Gene Sets | translation initiation complex formation | 4 | 3.305785124 | -3.622820626 | -1.156546304 | |||||||||||||||||||||||||||||||||||||||||||||||||||||||||||||||||||||||||||||||||||||||||||||
| GO:0039694 | GO Biological Processes | viral RNA genome replication | 3 | 2.479338843 | -3.484731862 | -1.070409087 | |||||||||||||||||||||||||||||||||||||||||||||||||||||||||||||||||||||||||||||||||||||||||||||
| GO:0043484 | GO Biological Processes | regulation of RNA splicing | 5 | 4.132231405 | -3.177663215 | -0.892370138 | |||||||||||||||||||||||||||||||||||||||||||||||||||||||||||||||||||||||||||||||||||||||||||||
| GO:0000245 | GO Biological Processes | spliceosomal complex assembly | 4 | 3.305785124 | -3.010155112 | -0.785142581 | |||||||||||||||||||||||||||||||||||||||||||||||||||||||||||||||||||||||||||||||||||||||||||||
| GO:0007005 | GO Biological Processes | mitochondrion organization | 9 | 7.438016529 | -2.780755792 | -0.606103997 | |||||||||||||||||||||||||||||||||||||||||||||||||||||||||||||||||||||||||||||||||||||||||||||
| GO:0015711 | GO Biological Processes | organic anion transport | 8 | 6.611570248 | -2.575952409 | -0.422942539 | |||||||||||||||||||||||||||||||||||||||||||||||||||||||||||||||||||||||||||||||||||||||||||||
| GO:0042273 | GO Biological Processes | ribosomal large subunit biogenesis | 3 | 2.479338843 | -2.182984218 | -0.107140303 | |||||||||||||||||||||||||||||||||||||||||||||||||||||||||||||||||||||||||||||||||||||||||||||
| GO:0006281 | GO Biological Processes | DNA repair | 8 | 6.611570248 | -2.070668634 | -0.009716275 | |||||||||||||||||||||||||||||||||||||||||||||||||||||||||||||||||||||||||||||||||||||||||||||
| GO:0002028 | GO Biological Processes | regulation of sodium ion transport | 3 | 2.479338843 | -2.015633166 | 0 | |||||||||||||||||||||||||||||||||||||||||||||||||||||||||||||||||||||||||||||||||||||||||||||
| Note: GO: gene ontology; CORUM: the comprehensive resource of mammalian protein complexes. | |||||||||||||||||||||||||||||||||||||||||||||||||||||||||||||||||||||||||||||||||||||||||||||||||||
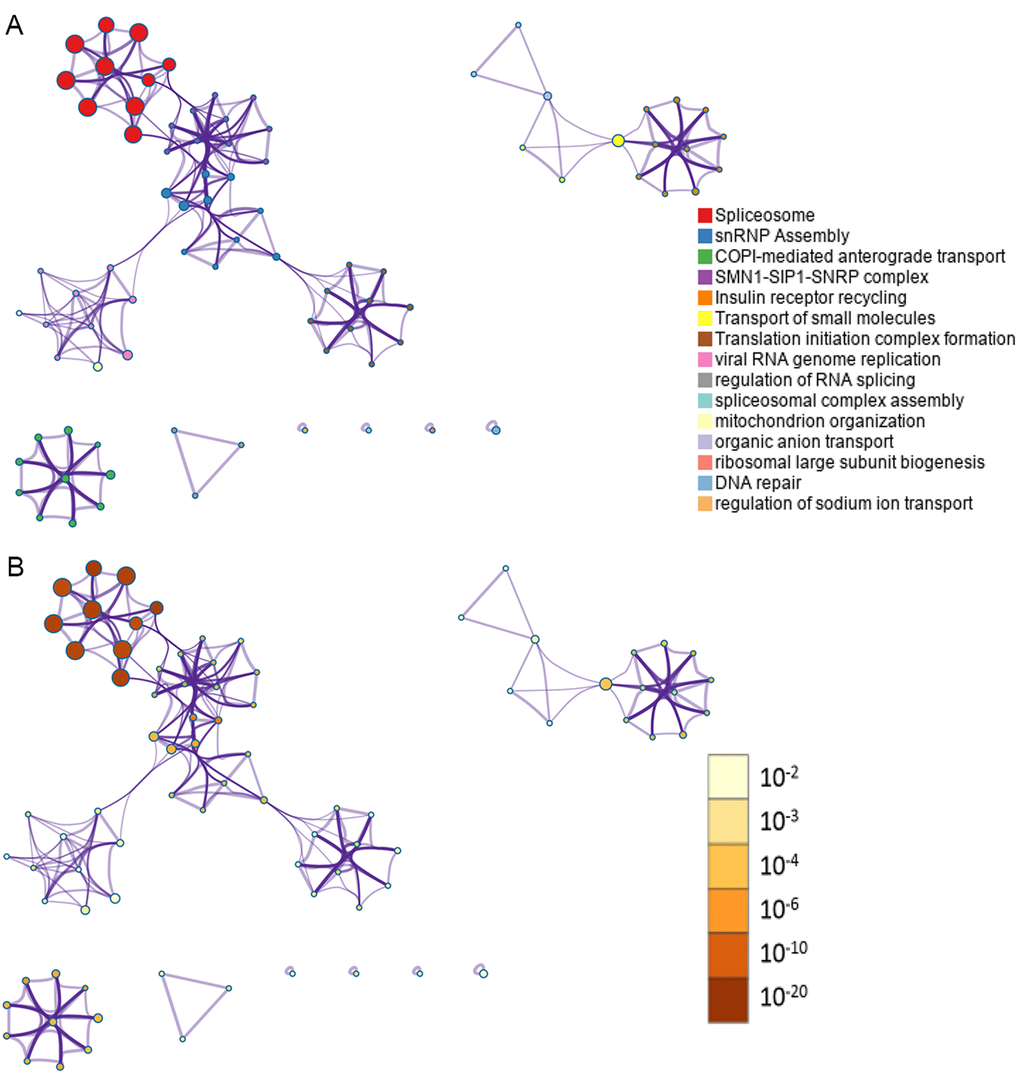
Figure 2. Network of enriched terms. (A) Nodes in the network represent corresponding genes of top significant survival-associated AS events. One-to-one match between colors of the nodes and enrichment terms were labeled in the left. Nodes that share the same cluster ID are typically close to each other; (B) Nodes in the network represent corresponding genes of top significant survival-associated AS events. One-to-one match between colors of the nodes and P values were labeled in the left. Enrichment terms containing more nodes tend to have a more significant P value.
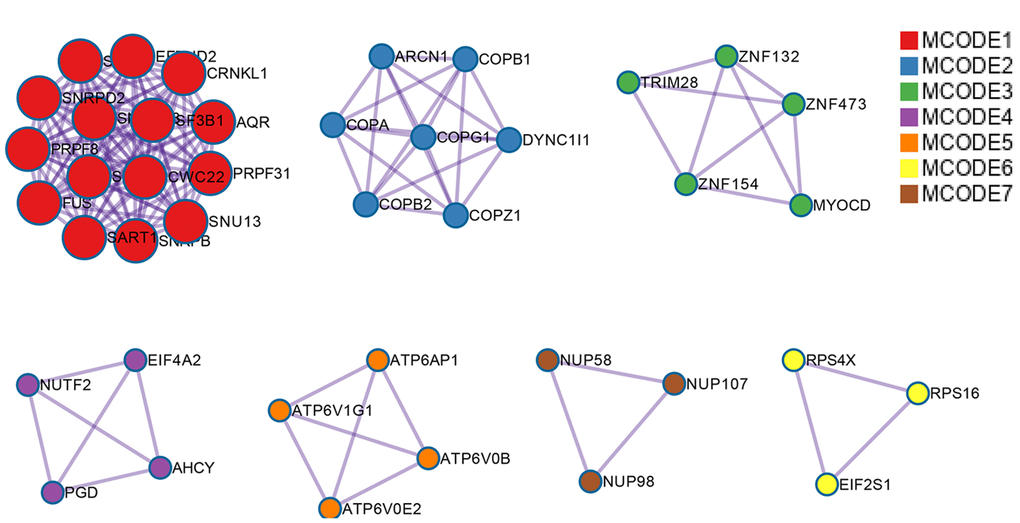
Figure 3. Protein-protein interaction network for top significant survival-associated AS events. Nodes in the network represent corresponding genes of top significant survival-associated AS events. Gene that clustered in the same MCODE component was unified in one color.
PI models featured by AS events for UCEC
Top significant survival-associated AS events in univariate Cox regression analysis (P<0.001) were considered as candidate AS events for the construction of PI models. Then, multivariate Cox regression analysis was performed to select component AS events for PI models from the 308 top significant survival-associated AS events. According to the results, 26 significant AS events (P<0.05) from multivariate Cox regression analysis were reserved to build PI models of six AS types (AA, AD, AP, AT, ME and RI) (Table 4). Particularly, all the 26 splicing events were merged to construct a PI for all AS types. Distributions of PSI for component AS events and risk scores in each PI model were displayed in Figure 4. The predicting efficiency of the seven PI models was assessed by tROC curves and Kaplan-Meier survival analysis. As illustrated by a panel of tROC curves in Figure 5, PI-AT demonstrated the highest capacity of estimating the prognosis of UCEC patients with an AUC value of 0.758, followed by PI-RI with an AUC value of 0.719. We also used Kaplan-Meier survival analyses to appraise the prognosis-predicting ability of the seven PI models. UCEC patients were separated into low risk and high risk group according to the median values of PI. The results suggested that six of the seven PI models (AD, AP, AT, ME, RI and ALL) exhibited good performance in stratifying the prognosis of low risk and high risk group (Figure 5). Survival time of UCEC patients in low risk group of six PI models (AD, AP, AT, ME, RI and ALL) was significantly prolonged compared to that of UCEC patients in high risk group (P<0.001). According to the assessment from univariate and multivariate Cox regression analysis, four PI models including PI-AP, PI-AT, PI-ME and PI-RI figure prominently with superior independent prognosis-predicting value in both univariate and multivariate Cox regression analysis (Table 5). (all P<0.05). For all PI models, high-risk UCEC patients were more inclined to suffer from advanced clinical progression than low-risk UCEC patients, which is especially obvious for grade classification of UCEC (Table 6).
Table 4. Component AS events of PI models for AA, AD, AP, AT, ES, ME and RI.
| Splicing type | Gene symbol | AS ID | Exons | From exon | To exon | Hazard ratio | P-value | ||||||||||||||||||||||||||||||||||||||||||||||||||||||||||||||||||||||||||||||||||||||||||||
| AA | SHPRH | 78032 | 31.1 | 30 | 31.2 | 0.516 | <0.001 | ||||||||||||||||||||||||||||||||||||||||||||||||||||||||||||||||||||||||||||||||||||||||||||
| AA | CASK | 88861 | 24.1 | 23 | 24.2 | 0.759 | <0.001 | ||||||||||||||||||||||||||||||||||||||||||||||||||||||||||||||||||||||||||||||||||||||||||||
| AD | FBXL19 | 36205 | 8.2 | 8.1 | 9 | 1.030 | 0.004 | ||||||||||||||||||||||||||||||||||||||||||||||||||||||||||||||||||||||||||||||||||||||||||||
| AD | SAT2 | 39030 | 5.2 | 5.1 | 6 | 1.112 | 0.007 | ||||||||||||||||||||||||||||||||||||||||||||||||||||||||||||||||||||||||||||||||||||||||||||
| AD | TRO | 89255 | 12.2:12.3 | 12.1 | 13 | 0.986 | 0.036 | ||||||||||||||||||||||||||||||||||||||||||||||||||||||||||||||||||||||||||||||||||||||||||||
| AD | CSTF2 | 89611 | 12.2 | 12.1 | 13 | 0.001 | <0.001 | ||||||||||||||||||||||||||||||||||||||||||||||||||||||||||||||||||||||||||||||||||||||||||||
| AP | ZC3H11A | 9456 | 4 | null | null | 1.203 | 0.041 | ||||||||||||||||||||||||||||||||||||||||||||||||||||||||||||||||||||||||||||||||||||||||||||
| AP | STK32C | 13483 | 2 | null | null | 1.072 | 0.001 | ||||||||||||||||||||||||||||||||||||||||||||||||||||||||||||||||||||||||||||||||||||||||||||
| AP | GRB2 | 43439 | 1 | null | null | 0.961 | 0.031 | ||||||||||||||||||||||||||||||||||||||||||||||||||||||||||||||||||||||||||||||||||||||||||||
| AP | CRTC1 | 48500 | 2 | null | null | 3.785 | 0.004 | ||||||||||||||||||||||||||||||||||||||||||||||||||||||||||||||||||||||||||||||||||||||||||||
| AP | ERCC1 | 50440 | 1 | null | null | 1.283 | 0.001 | ||||||||||||||||||||||||||||||||||||||||||||||||||||||||||||||||||||||||||||||||||||||||||||
| AP | ESR1 | 78161 | 4 | null | null | 1.048 | 0.001 | ||||||||||||||||||||||||||||||||||||||||||||||||||||||||||||||||||||||||||||||||||||||||||||
| AT | MAGI3 | 4271 | 23 | null | null | 0.913 | 0.018 | ||||||||||||||||||||||||||||||||||||||||||||||||||||||||||||||||||||||||||||||||||||||||||||
| AT | TPM1 | 30982 | 13.2 | null | null | 1.153 | <0.001 | ||||||||||||||||||||||||||||||||||||||||||||||||||||||||||||||||||||||||||||||||||||||||||||
| AT | ATP8B3 | 46544 | 29 | null | null | 0.978 | 0.001 | ||||||||||||||||||||||||||||||||||||||||||||||||||||||||||||||||||||||||||||||||||||||||||||
| AT | MAST1 | 47878 | 14.2 | null | null | 1.015 | 0.027 | ||||||||||||||||||||||||||||||||||||||||||||||||||||||||||||||||||||||||||||||||||||||||||||
| AT | SPAG16 | 57327 | 14 | null | null | 1.583 | <0.001 | ||||||||||||||||||||||||||||||||||||||||||||||||||||||||||||||||||||||||||||||||||||||||||||
| AT | CBWD5 | 86498 | 17.2 | null | null | 1.051 | 0.002 | ||||||||||||||||||||||||||||||||||||||||||||||||||||||||||||||||||||||||||||||||||||||||||||
| AT | OLFM1 | 88103 | 2 | null | null | 1.090 | <0.001 | ||||||||||||||||||||||||||||||||||||||||||||||||||||||||||||||||||||||||||||||||||||||||||||
| ME | NSMF | 193275 | 6|7 | 4 | 9.2 | 1.075 | 0.035 | ||||||||||||||||||||||||||||||||||||||||||||||||||||||||||||||||||||||||||||||||||||||||||||
| ME | GTF2H3 | 306194 | 10|11 | 9 | 12 | 1.155 | <0.001 | ||||||||||||||||||||||||||||||||||||||||||||||||||||||||||||||||||||||||||||||||||||||||||||
| RI | C11orf49 | 15609 | 14.2 | 14.1 | 14.3 | 1.021 | 0.045 | ||||||||||||||||||||||||||||||||||||||||||||||||||||||||||||||||||||||||||||||||||||||||||||
| RI | ZNF276 | 38138 | 12.2 | 12.1 | 12.3 | 1.027 | 0.011 | ||||||||||||||||||||||||||||||||||||||||||||||||||||||||||||||||||||||||||||||||||||||||||||
| RI | USP36 | 43917 | 17.2 | 17.1 | 17.3 | 0.039 | 0.006 | ||||||||||||||||||||||||||||||||||||||||||||||||||||||||||||||||||||||||||||||||||||||||||||
| RI | NUDT18 | 82937 | 2.2 | 2.1 | 2.3 | 1.019 | 0.028 | ||||||||||||||||||||||||||||||||||||||||||||||||||||||||||||||||||||||||||||||||||||||||||||
| RI | NAPRT1 | 85430 | 11.5:11.6:11.7 | 11.4 | 11.8 | 1.033 | 0.008 | ||||||||||||||||||||||||||||||||||||||||||||||||||||||||||||||||||||||||||||||||||||||||||||
| Note: AA: alternate acceptor; AD: alternate donor; AP: alternate promoter; AT: alternate terminator; ME: mutually exclusive exons; RI: retained intron; P values were calculated from multivariate Cox regression analysis. | |||||||||||||||||||||||||||||||||||||||||||||||||||||||||||||||||||||||||||||||||||||||||||||||||||
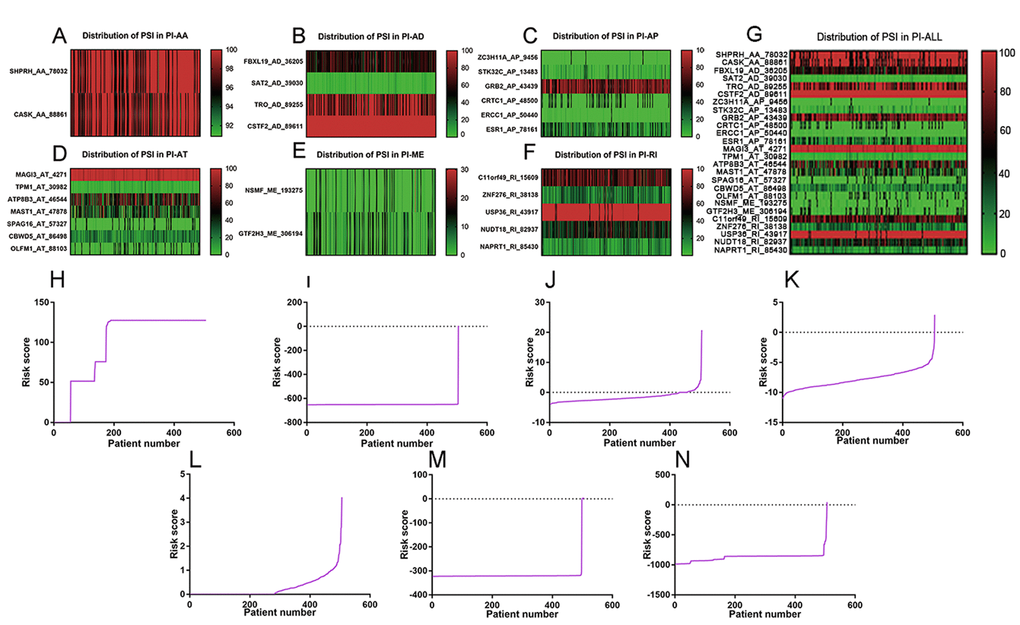
Figure 4. Distribution of PSI values and risk scores in each PI model. (A) distribution of PSI values in PI-AA model. (B) distribution of PSI values in PI-AD model. (C) distribution of PSI values in PI-AP model. (D) distribution of PSI values in PI-AT model. (E) Distribution of PSI values in PI-ME model. (F) Distribution of PSI values in PI-RI model. (G) Distribution of PSI values in PI-ALL model. The range of PSI values was annotated by a spectrum of colors from green to red; (H) Risk scores derived from significant survival-associated AS events in AA type. (I) Risk scores derived from significant survival-associated AS events in AD type. (J) Risk scores derived from significant survival-associated AS events in AP type. (K) Risk scores derived from significant survival-associated AS events in AT type. (L) Risk scores derived from significant survival-associated AS events in ME type. (M) Risk scores derived from significant survival-associated AS events in RI type. (N) Risk scores derived from significant survival-associated AS events in all types.
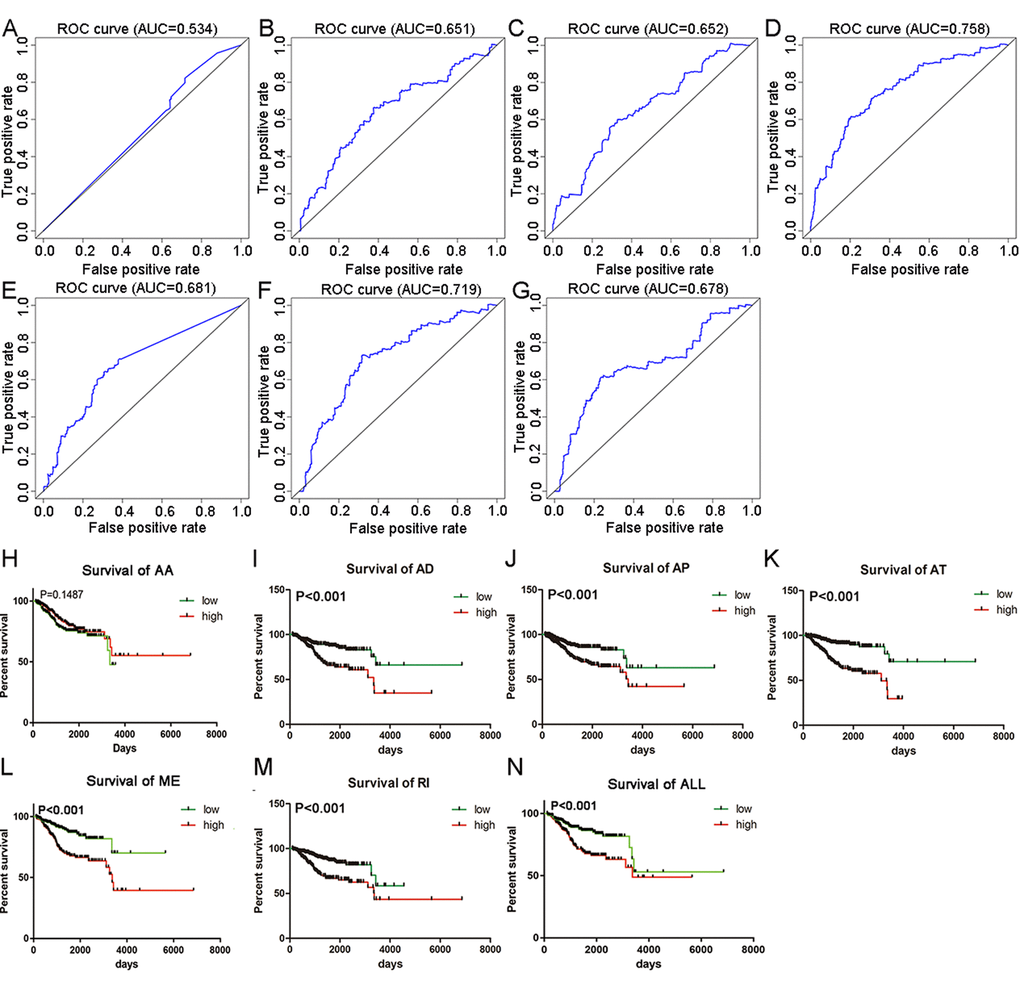
Figure 5. tROC curves and Kaplan-Meier survival curves seven PI models. (A) tROC curve for PI-AA model (AUC=0.534). (B) tROC curve for PI-AD model (AUC=0.651). (C) tROC curve for PI-AP model (AUC=0.652). (D) tROC curve for PI-AT model (AUC=0.758). (E) tROC curve for PI-ME model (AUC=0.681). (F) tROC curve for PI-RI model (AUC=0.719). (G) tROC curve for PI-ALL model (AUC=0.678). (H) Kaplan-Meier survival curves for PI-AA model (P=0.1487). Average OS time in low and high risk group was 2762 and 4713 days, respectively. (I) Kaplan-Meier survival curves for PI-AD model (P<0.001). Average OS time in low and high risk group was 5272 and 3219 days, respectively. (J) Kaplan-Meier survival curves for PI-AP model (P<0.001). Average OS time in low and high risk group was 5165 and 3469 days, respectively. (K) Kaplan-Meier survival curves for PI-AT model (P<0.001). Average OS time in low and high risk group was 5556 and 2511 days, respectively. (L) Kaplan-Meier survival curves for PI-ME model (P<0.001). Average OS time in low and high risk group was 4569 and 3848 days, respectively. (M) Kaplan-Meier survival curves for PI-RI model (P<0.001). Average OS time in low and high risk group was 3652 and 3957 days, respectively. (N) Kaplan-Meier survival curves for PI-ALL model (P<0.001). Average OS time in low and high risk group was 4787 and 3594 days, respectively.
Table 5. Univariate and Multivariate Cox regression analysis of clinical parameters and seven PI models in TCGA cohort of UCEC patients.
| Clinical variable | Group | Univariate | Multivariate | ||||||||||||||||||||||||||||||||||||||||||||||||||||||||||||||||||||||||||||||||||||||||||||||||
| HR (95% CI) | P value | HR (95% CI) | P value | ||||||||||||||||||||||||||||||||||||||||||||||||||||||||||||||||||||||||||||||||||||||||||||||||
| Age | <60 | 2.247 (1.326-3.806) | 0.003 | 1.722 (0.983-3.014) | 0.057 | ||||||||||||||||||||||||||||||||||||||||||||||||||||||||||||||||||||||||||||||||||||||||||||||
| ≥60 | |||||||||||||||||||||||||||||||||||||||||||||||||||||||||||||||||||||||||||||||||||||||||||||||||||
| Histological type | Endometrioid | 2.413 (1.590-3.663) | <0.001 | 1.112 (0.756-1.635) | 0.590 | ||||||||||||||||||||||||||||||||||||||||||||||||||||||||||||||||||||||||||||||||||||||||||||||
| Serous | |||||||||||||||||||||||||||||||||||||||||||||||||||||||||||||||||||||||||||||||||||||||||||||||||||
| Grade | 1-2 | 1.804 (1.162-2.802) | 0.009 | 1.203 (0.810-1.785) | 0.360 | ||||||||||||||||||||||||||||||||||||||||||||||||||||||||||||||||||||||||||||||||||||||||||||||
| 3 | |||||||||||||||||||||||||||||||||||||||||||||||||||||||||||||||||||||||||||||||||||||||||||||||||||
| Stage | I-II | 3.918 (2.568-5.978) | <0.001 | 3.527 (2.248-5.533) | <0.001 | ||||||||||||||||||||||||||||||||||||||||||||||||||||||||||||||||||||||||||||||||||||||||||||||
| III | |||||||||||||||||||||||||||||||||||||||||||||||||||||||||||||||||||||||||||||||||||||||||||||||||||
| PI-AA | Low | 0.734 (0.481-1.119) | 0.150 | 0.563 (0.333-0.950) | 0.031 | ||||||||||||||||||||||||||||||||||||||||||||||||||||||||||||||||||||||||||||||||||||||||||||||
| High | |||||||||||||||||||||||||||||||||||||||||||||||||||||||||||||||||||||||||||||||||||||||||||||||||||
| PI-AD | Low | 2.446 (1.570-3.813) | <0.001 | 1.303 (0.781-2.173) | 0.310 | ||||||||||||||||||||||||||||||||||||||||||||||||||||||||||||||||||||||||||||||||||||||||||||||
| High | |||||||||||||||||||||||||||||||||||||||||||||||||||||||||||||||||||||||||||||||||||||||||||||||||||
| PI-AP | Low | 2.237 (1.428-.3.503) | <0.001 | 2.025 (1.270-3.229) | 0.003 | ||||||||||||||||||||||||||||||||||||||||||||||||||||||||||||||||||||||||||||||||||||||||||||||
| High | |||||||||||||||||||||||||||||||||||||||||||||||||||||||||||||||||||||||||||||||||||||||||||||||||||
| PI-AT | Low | 4.209 (2.551-6.944) | <0.001 | 2.102 (1.170-3.776) | 0.013 | ||||||||||||||||||||||||||||||||||||||||||||||||||||||||||||||||||||||||||||||||||||||||||||||
| High | |||||||||||||||||||||||||||||||||||||||||||||||||||||||||||||||||||||||||||||||||||||||||||||||||||
| PI-ME | Low | 2.551 (1.620-4.018) | <0.001 | 2.058 (1.261-3.359) | 0.004 | ||||||||||||||||||||||||||||||||||||||||||||||||||||||||||||||||||||||||||||||||||||||||||||||
| High | |||||||||||||||||||||||||||||||||||||||||||||||||||||||||||||||||||||||||||||||||||||||||||||||||||
| PI-RI | Low | 2.560 (1.638-4.001) | <0.001 | 2.052 (1.283-3.282) | 0.003 | ||||||||||||||||||||||||||||||||||||||||||||||||||||||||||||||||||||||||||||||||||||||||||||||
| High | |||||||||||||||||||||||||||||||||||||||||||||||||||||||||||||||||||||||||||||||||||||||||||||||||||
| PI-ALL | Low | 2.057 (1.330-3.181) | 0.001 | 0.983 (0.548-1.763) | 0.953 | ||||||||||||||||||||||||||||||||||||||||||||||||||||||||||||||||||||||||||||||||||||||||||||||
| High | |||||||||||||||||||||||||||||||||||||||||||||||||||||||||||||||||||||||||||||||||||||||||||||||||||
| Note: AA: alternate acceptor; AD: alternate donor; AP: alternate promoter; AT: alternate terminator; ME: mutually exclusive exons; RI: retained intron. | |||||||||||||||||||||||||||||||||||||||||||||||||||||||||||||||||||||||||||||||||||||||||||||||||||
Table 6. Relationship between PI models and the progression of UCEC.
| Type of PI | Clinico-pathological parameters | Group of risk low % high % | χ2 | P value | |||||||||||||||||||||||||||||||||||||||||||||||||||||||||||||||||||||||||||||||||||||||||||||||
| PI-AA | Grade | 4.577 | 0.032 | ||||||||||||||||||||||||||||||||||||||||||||||||||||||||||||||||||||||||||||||||||||||||||||||||
| 1-2 | 113 (27.3) | 90 (72.7) | |||||||||||||||||||||||||||||||||||||||||||||||||||||||||||||||||||||||||||||||||||||||||||||||||
| 3 | 134 (31.3) | 158 (68.7) | |||||||||||||||||||||||||||||||||||||||||||||||||||||||||||||||||||||||||||||||||||||||||||||||||
| Stage | 0.627 | 0.429 | |||||||||||||||||||||||||||||||||||||||||||||||||||||||||||||||||||||||||||||||||||||||||||||||||
| I-II | 186 (39.1) | 178 (60.9) | |||||||||||||||||||||||||||||||||||||||||||||||||||||||||||||||||||||||||||||||||||||||||||||||||
| III | 67(17.0) | 75 (83.0) | |||||||||||||||||||||||||||||||||||||||||||||||||||||||||||||||||||||||||||||||||||||||||||||||||
| PI-AD | Grade | 18.409 | <0.001 | ||||||||||||||||||||||||||||||||||||||||||||||||||||||||||||||||||||||||||||||||||||||||||||||||
| 1-2 | 126 (27.3) | 77 (72.7) | |||||||||||||||||||||||||||||||||||||||||||||||||||||||||||||||||||||||||||||||||||||||||||||||||
| 3 | 124 (31.3) | 168 (68.7) | |||||||||||||||||||||||||||||||||||||||||||||||||||||||||||||||||||||||||||||||||||||||||||||||||
| Stage | 0.979 | 0.322 | |||||||||||||||||||||||||||||||||||||||||||||||||||||||||||||||||||||||||||||||||||||||||||||||||
| I-II | 187 (39.1) | 177 (60.9) | |||||||||||||||||||||||||||||||||||||||||||||||||||||||||||||||||||||||||||||||||||||||||||||||||
| III | 66 (17.0) | 76(83.0) | |||||||||||||||||||||||||||||||||||||||||||||||||||||||||||||||||||||||||||||||||||||||||||||||||
| PI-AP | Grade | 1.583 | 0.208 | ||||||||||||||||||||||||||||||||||||||||||||||||||||||||||||||||||||||||||||||||||||||||||||||||
| 1-2 | 109 (27.3) | 94 (72.7) | |||||||||||||||||||||||||||||||||||||||||||||||||||||||||||||||||||||||||||||||||||||||||||||||||
| 3 | 140 (31.3) | 152 (68.7) | |||||||||||||||||||||||||||||||||||||||||||||||||||||||||||||||||||||||||||||||||||||||||||||||||
| Stage | 0.352 | 0.553 | |||||||||||||||||||||||||||||||||||||||||||||||||||||||||||||||||||||||||||||||||||||||||||||||||
| I-II | 185 (39.1) | 68 (60.9) | |||||||||||||||||||||||||||||||||||||||||||||||||||||||||||||||||||||||||||||||||||||||||||||||||
| III | 179 (17.0) | 74 (83.0) | |||||||||||||||||||||||||||||||||||||||||||||||||||||||||||||||||||||||||||||||||||||||||||||||||
| PI-AT | Grade | 43.455 | <0.001 | ||||||||||||||||||||||||||||||||||||||||||||||||||||||||||||||||||||||||||||||||||||||||||||||||
| 1-2 | 139 (27.3) | 64 (72.7) | |||||||||||||||||||||||||||||||||||||||||||||||||||||||||||||||||||||||||||||||||||||||||||||||||
| 3 | 112 (31.3) | 180 (68.7) | |||||||||||||||||||||||||||||||||||||||||||||||||||||||||||||||||||||||||||||||||||||||||||||||||
| Stage | 20.715 | <0.001 | |||||||||||||||||||||||||||||||||||||||||||||||||||||||||||||||||||||||||||||||||||||||||||||||||
| I-II | 205 (39.1) | 159 (60.9) | |||||||||||||||||||||||||||||||||||||||||||||||||||||||||||||||||||||||||||||||||||||||||||||||||
| III | 48 (17.0) | 94 (83.0) | |||||||||||||||||||||||||||||||||||||||||||||||||||||||||||||||||||||||||||||||||||||||||||||||||
| PI-ME | Grade | 26.660 | <0.001 | ||||||||||||||||||||||||||||||||||||||||||||||||||||||||||||||||||||||||||||||||||||||||||||||||
| 1-2 | 132 (27.3) | 71 (72.7) | |||||||||||||||||||||||||||||||||||||||||||||||||||||||||||||||||||||||||||||||||||||||||||||||||
| 3 | 121 (31.3) | 171 (68.7) | |||||||||||||||||||||||||||||||||||||||||||||||||||||||||||||||||||||||||||||||||||||||||||||||||
| Stage | 1.410 | 0.235 | |||||||||||||||||||||||||||||||||||||||||||||||||||||||||||||||||||||||||||||||||||||||||||||||||
| I-II | 188 (39.1) | 176 (60.9) | |||||||||||||||||||||||||||||||||||||||||||||||||||||||||||||||||||||||||||||||||||||||||||||||||
| III | 65 (17.0) | 77 (83.0) | |||||||||||||||||||||||||||||||||||||||||||||||||||||||||||||||||||||||||||||||||||||||||||||||||
| PI-RI | Grade | 25.217 | <0.001 | ||||||||||||||||||||||||||||||||||||||||||||||||||||||||||||||||||||||||||||||||||||||||||||||||
| 1-2 | 130 (27.3) | 73 (72.7) | |||||||||||||||||||||||||||||||||||||||||||||||||||||||||||||||||||||||||||||||||||||||||||||||||
| 3 | 120 (31.3) | 172(68.7) | |||||||||||||||||||||||||||||||||||||||||||||||||||||||||||||||||||||||||||||||||||||||||||||||||
| Stage | 0.352 | 0.553 | |||||||||||||||||||||||||||||||||||||||||||||||||||||||||||||||||||||||||||||||||||||||||||||||||
| I-II | 185 (39.1) | 179(60.9) | |||||||||||||||||||||||||||||||||||||||||||||||||||||||||||||||||||||||||||||||||||||||||||||||||
| III | 68 (17.0) | 74 (83.0) | |||||||||||||||||||||||||||||||||||||||||||||||||||||||||||||||||||||||||||||||||||||||||||||||||
| PI-ALL | Grade | 25.974 | <0.001 | ||||||||||||||||||||||||||||||||||||||||||||||||||||||||||||||||||||||||||||||||||||||||||||||||
| 1-2 | 130 (27.3) | 73 (72.7) | |||||||||||||||||||||||||||||||||||||||||||||||||||||||||||||||||||||||||||||||||||||||||||||||||
| 3 | 119 (31.3) | 173 (68.7) | |||||||||||||||||||||||||||||||||||||||||||||||||||||||||||||||||||||||||||||||||||||||||||||||||
| Stage | 6.618 | 0.010 | |||||||||||||||||||||||||||||||||||||||||||||||||||||||||||||||||||||||||||||||||||||||||||||||||
| I-II | 195 (39.1) | 169 (60.9) | |||||||||||||||||||||||||||||||||||||||||||||||||||||||||||||||||||||||||||||||||||||||||||||||||
| III | 58(17.0) | 84 (83.0) | |||||||||||||||||||||||||||||||||||||||||||||||||||||||||||||||||||||||||||||||||||||||||||||||||
| Note: AA: alternate acceptor; AD: alternate donor; AP: alternate promoter; AT: alternate terminator; ME: mutually exclusive exons; RI: retained intron. | |||||||||||||||||||||||||||||||||||||||||||||||||||||||||||||||||||||||||||||||||||||||||||||||||||
Correlation network of splicing factor-related AS events and survival associated AS events
We downloaded information of 74 splicing factors and the corresponding splicing factor-related AS events from the SpliceAid2 database and TCGA. Results from univariate Cox regression analysis suggested that 16 splicing factor-related AS events were remarkably linked to the survival of UCEC patients (Supplementary Table 1). The correlation between the 16 splicing factor-related AS events and 26 significant AS events from multivariate Cox regression analysis were calculated and significant correlations were presented as a correlation network in Figure 6E (P<0.05) (Supplementary Table 1). Blue nodes (n=16) and purple nodes (n=24) represented splicing factor-related AS events and significant AS events from multivariate Cox regression analysis, respectively. Positive and negative correlations between splicing events were marked as red lines (n=68) and green lines (n=64), respectively. We also conducted Kaplan-Meier survival analysis for the 12 splicing factors of the 16 splicing factor-related AS events after dividing UCEC patients according to the average expression value of the 12 splicing factors. We found that four splicing factors including RBM4, ESRP1, TRA2B and SRSF2 served as significant prognostic indicators for the worse survival of UCEC patients (P<0.05) (Figure 6A-D).
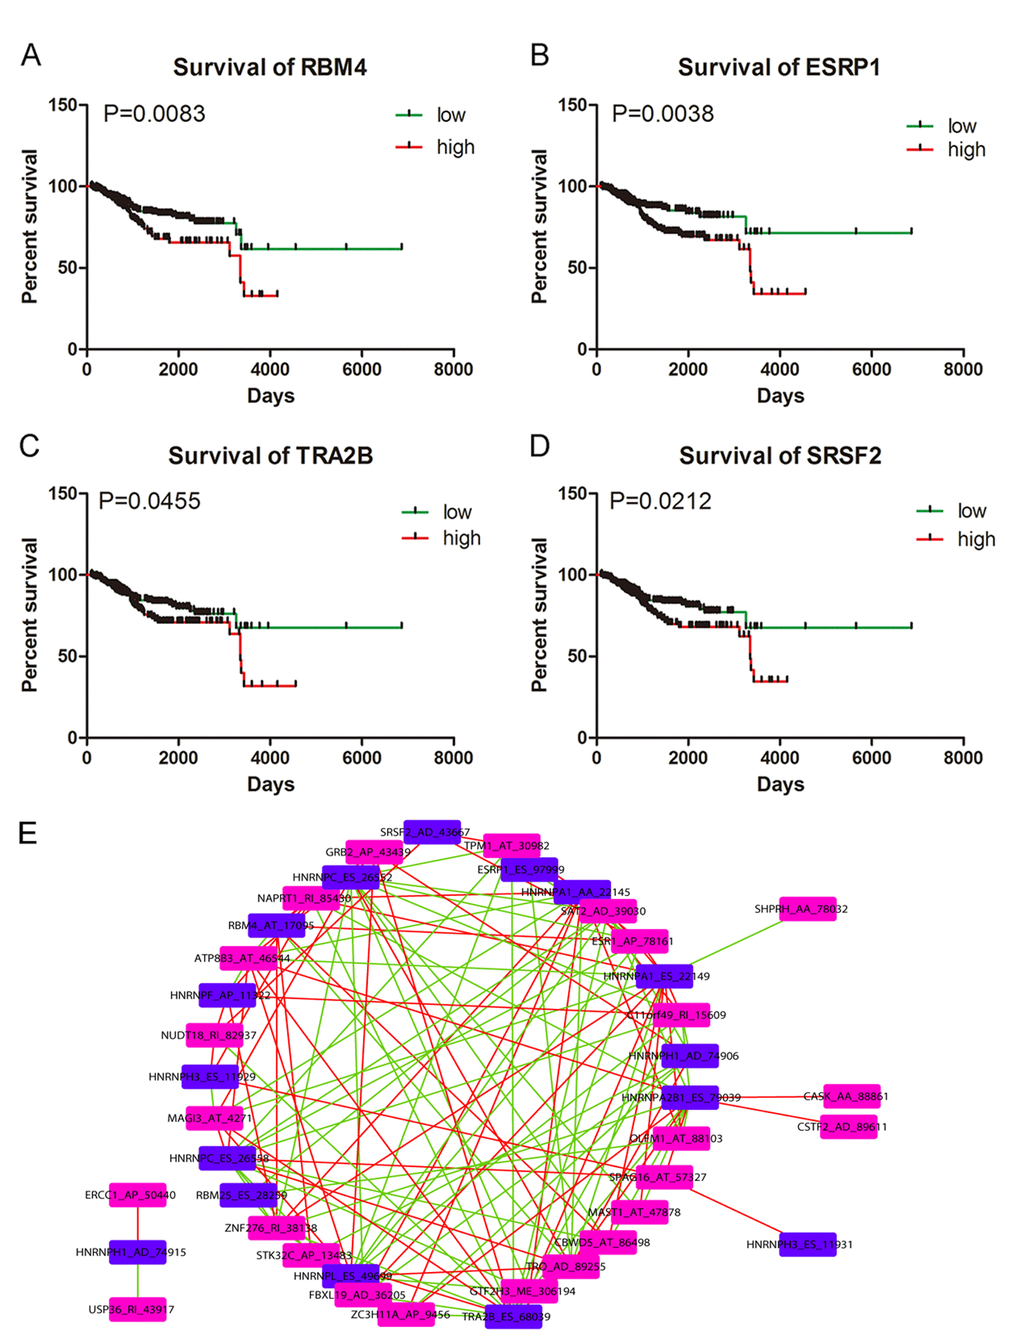
Figure 6. Kaplan-Meier survival curves for appraising the prognostic significance of splicing factors in UCEC and Correlation network. (A) Kaplan-Meier survival curves for RBM4 (P=0.0083). (B) Kaplan-Meier survival curves for ESRP1 (P=0.0038). (C) Kaplan-Meier survival curves for TRA2B (P=0.0455). (D) Kaplan-Meier survival curves for SRSF2 (P=0.0212). (E) Correlation network between splicing factor-related AS events and significant survival-associated AS events. Blue nodes (n=16) and purple nodes (n=24) represented splicing factor-related AS events and significant AS events from multivariate Cox regression analysis, respectively. Positive and negative correlations between splicing events were marked as red lines (n=68) and green lines (n=64), respectively.
Discussion
Existing risk stratification for UCEC patients based on morphological classification had limited power in predicting the overall survival conditions of UCEC patients and it remained unsolved to find effective prognostic indicator for UCEC patients. Accumulated evidence suggested that AS exerted vast influence on the biological events of human cancers [22–24], which enlightened us that the aberrant AS profiles in UCEC may provide valuable prognostic information. Although multiple splice variants of molecules such as ER and PR have been reported in previous studies to participate in the pathogenesis of UCEC, there lacks systematic and comprehensive analysis of the prognostic significance of AS profiling landscape for UCEC.
The present study is the first to investigate global pattern of survival-associated AS events in UCEC using TCGA data. Results from univariate Cox regression analysis revealed that thousands of AS events were associated with the survival of UCEC patients (P<0.05). Subsequent functional annotation for genes corresponding to the significant survival-associated AS events in UCEC (P<0.001) indicated that these genes were mainly involved in biological processes and pathways including viral RNA genome replication, regulation of RNA splicing, spliceosomal complex assembly, snRNP Assembly, COPI-mediated anterograde transport and Insulin receptor recycling. AS events generated from these genes might affect the initiation and development of UCEC through interfere with the above biological processes and pathways.
Bioinformatics analysis of the significant survival-associated AS events in UCEC is one of the highlights of our research. The most striking clinical implication of the present study was that we constructed PI models with noticeable predicting power for overall survival of UCEC patients. Six PI models exhibited significant ability in prognosing overall survival time of UCEC patients with PI-AT performing best (AUC=0.758). More encouragingly, univariate and multivariate Cox regression analysis proved four of the PI models including PI-AP, PI-AT, PI-ME and PI-RI as independent prognostic factors for UCEC. Prior to our studies, several researchers have developed prognostic models for UCEC based on other genomic signatures. Zhou M et al. have devised a lncRNA-focus expression signature for survival prediction in UCEC, which achieved excellent prognostic performance (AUC=0.887) [25]. The high AUC value in the study of Zhou M et al. was derived from a validation cohort of 151 UCEC patients while 506 UCEC patients in our study were designated as validation groups for PI. AUC values of a six-gene signature proposed by Wang Y et al. and a nine-gene prognostic model devised by Ying J et al. reached 0.787 and 0.82, respectively [26,27]. The difference values between these two gene-expression signatures and PIs in our study were within the range of ±0.1, which indicated that the prediction efficiency of PIs in this study were comparable with gene-expression models. In the current study, UCEC cases enrolled in the prognostic analysis were restricted to those whose OS time exceeded 90 days and the validation cohorts were composed of 506 UCEC patients from TCGA, which is different from previous study with similar works. It is understandable that a certain amount of error was inevitable due to the inclusion criteria of patients with prognostic data and heterogeneity of validation cohort. Results in our study offered a novel visual angle for the precision medicine of UCEC patients and the molecular mechanism of tumorigenesis of UCEC. Evaluation results from tROC curves and Kaplan-Meier survival curves proved that building PI models based on survival –associated AS events was a feasible way to stratify UCEC patients into risk groups of different survival outcome.
It is well known that AS may introduce nonsense-mediated mRNA decay, truncated protein and increased or decreased miRNA binding sites, eventually changing the quality and quantity of protein product. Additionally, splicing events in untranslated regions or non-coding RNAs might lead to abnormal gene function [28]. Cancer-specific mRNA transcripts may affect the formation and progression of human cancers via activating oncogenes or inhibiting tumour suppressor genes [29]. Splice-switching of MYO1B into an oncogenic isoform drove gliomagenesis [30]. Presence or absence of exon7 in two splicing isoforms of MBNL1 conveyed opposite phenotypical implications of cancer [31]. Two splicing isoforms of ZNF148 exerted mutual antagonistic effect to each other on the biological activities of colorectal cancer [32]. Throughout the 26 corresponding genes of component AS events for PI models, four genes were closely associated with UCEC. In the study of Wong YF et al., OLFM1 was found to display significant down-regulation in endometrial cancer of Hong Kong Chinese women [33]. Oestrogen receptor α (ESR1) has great impact on the susceptibility and prognosis of endometrial cancer [34]. Latest research discovered that five adjacent tag single-nucleotide polymorphisms at the 5’ end of ESR1 denoted lower risk of UCEC [35]. Significant correlation was established between single nucleotide polymorphisms of ERCC1 and chemosensitivity of UCEC in the study conducted by Chen L et al. [36]. Elevated GRB2 was engaged in oncogenic events of UCEC triggered by insulin [37]. Apart from the four genes, other genes such as FBXL19, CSTF2, ZC3H11A, CRTC1 and MAGI3 influenced the formation and progression of human cancers with either carcinogenic or tumor-suppressive function [38–42]. Although none of the corresponding AS events of the 26 genes was reported in UCEC, it is conjectured that loss-of function for the tumor suppressor gene or gain-of-function and retain-of-function for the oncogene induced by AS may connect the 26 component AS events in PI models to the cancer biology of UCEC.
As critical regulators of splicing events, the prognostic significance of splicing factors and the correlation between splicing factor-related AS events and survival-associated AS events are also worthy of exploration. Correlation network in this study depicted the complicated interactions between splicing factor-related AS events and survival-associated AS events. Both positive and negative correlations were observed between one splicing factor-related AS event and multiple survival-associated AS events; or one survival associated AS event and multiple splicing factor related AS events. For example, SERBP1_AA_3354 was negatively correlated with HNRNPA1_AA_22145 and was positively correlated with HNRNPC_ES_26552. We speculated that splicing factors might execute diversified regulatory functions in mediating AS events of UCEC. Moreover, assessment from Kaplan-Meier survival analysis indicated that four splicing factors including SRSF2, TRA2B, ESPR1 and RBM4 were all associated with the worse survival of UCEC patients. Of note, SRSF2 was linked with poor survival of patients with myelodysplastic syndromes and the frequent mutation of SRSF2 could induce oncogenesis in hematopoietic cells through activating a cascade of alternative splicing [43]. Expression of TRA2B served as independent prognostic factor for the worse progression-free survival of UCEC patients in the study of Ouyang YQ1 et al. [44], which were in concordance with our results. However, the prognostic significance of ESRP1 and RBM4 in this study was conflicting with documents in previous studies. ESRP1 is a kind of epithelial cell-specific epithelial cell-specific alternative splicing controller with involvement in epithelial–mesenchymal transition (EMT) [45,46]. ESRP1 could suppress tumorigenic potential in various cancers including colorectal cancer, pancreatic cancer and ovarian cancer [47–49]. Similarly, RBM4 was reported to inhibit tumor progression via specifically controlling splicing related to the apoptosis, proliferation, and migration of cancer cells [50]. Whether the expression of ESRP1 and RBM4 indicated good or poor clinical outcome of UCEC patients require further investigations in future studies.
Although PI models with impressive predicting power were produced in this study, limitations of the present research should also be pointed out. The prediction efficiency of PIs in this study was not the best among all prognostic models to date. Functional annotation of the genes corresponding to significant survival-associated AS events were theoretical analysis based on public databases. The regulatory network was constructed on the correlations calculated between PSI values of splicing factor-related AS events and survival-associated AS events. Experiments were warranted in future studies to validate the functional role of survival-associated AS events in UCEC and the stimulating or inhibitive influence of splicing factors on AS events.
In conclusion, we identified PI models based on survival-associated AS events for UCEC with preferable prognosis-predicting ability. Findings in this study were anticipated to provide novel options for selecting reliable prognostic indicators for UCEC patients. Furthermore, the correlation network between splicing factor-related AS events and survival-associated AS events may deepen the understanding of the carcinogenesis of UCEC.
Materials and Methods
Process of AS data curation
TCGA data portal (https://portal.gdc.cancer.gov/) provided the RNA sequencing data of UCEC cohorts. Analysis of mRNA splicing profiles in UCEC was conducted with the aid of SpliceSeq [51], a java program that explicitly quantifies RNA-Seq reads and identifies its possible functional changes as a consequence of AS in the context of transcript splice graphs. We downloaded the percent spliced in (PSI) value for seven types of AS events: Exon Skip (ES), Mutually Exclusive Exons (ME), Retained Intron (RI), Alternate Promoter (AP), Alternate Terminator (AT), Alternate Donor site (AD) and Alternate Acceptor site (AA) to quantify AS events in UCEC. PSI value is a commonly used ratio for the scoring of AS events from zero to one.
A preview of survival-associated AS events in UCEC
A total of 506 EC patients were included in this study and the overall survival (OS) of the 506 included EC patients were at least 90 days. Since it would be extremely intricate to illustrate the relationship between five or more interactive sets, we used UpSetR (version 1.3.3) [52] rather than Venn diagram to present the intersections between seven types of AS. Interactive sets among the seven types of AS events were visualized by UpSet plot. Based on the median cut of each parameter, these patients were divided into two groups. Univariate Cox regression analysis was conducted to identify survival-associated AS events (P<0.05). Functional enrichment analysis and gene network of top significant survival-associated AS genes (P<0.001) in UCEC were imported from Metascape, (http://metascape.org), an online tool that incorporates resources including KEGG Pathway, GO Biological Processes, Reactome Pathway Database, Canonical Pathways and CORUM to provide functional annotation for genes. Significant terms met the criteria of P value < 0.01 and the number of enriched genes ≥ 3.
PI models featured by AS events for UCEC
Multivariate Cox regression analysis was applied to top significant survival-associated AS events (P<0.001) selected from univariate Cox regression analysis in each AS type for further evaluation of the prognostic value of AS events in UCEC. AS events with P <0.05 from multivariate Cox regression analysis were retained to construct prognostic index (PI) for the corresponding AS type, which was calculated from the following formula: PI=
Statistical analysis
Statistical analysis for this study has been detailed in previous study [56].
Supplementary Materials
Acknowledgements
The authors would like to thank the TCGA Spliceseq and TCGA databases for the availability of the data.
Conflicts of Interest
The authors have no conflicts of interests to declare.
Funding
This study was funded by Guangxi Medical University Training Program for Distinguished Young Scholars, Medical Excellence Award Funded by the Creative Research Development Grant from the First Affiliated Hospital of Guangxi Medical University and Guangxi Zhuang Autonomous Region Health and Family Planning Commission Self-financed Scientific Research Project (Z20180979) and Guangxi Zhuang Autonomous Region University Student Innovative Plan (2018088).
References
- 1. Liu C, Zhang YH, Deng Q, Li Y, Huang T, Zhou S, Cai YD. Cancer-Related Triplets of mRNA-lncRNA-miRNA Revealed by Integrative Network in Uterine Corpus Endometrial Carcinoma. BioMed Res Int. 2017; 2017:3859582. https://doi.org/10.1155/2017/3859582 [PubMed]
- 2. Chen Y, Huang Q, Chen Q, Lin Y, Sun X, Zhang H, Zhu M, Dong S. The inflammation and estrogen metabolism impacts of polychlorinated biphenyls on endometrial cancer cells. Toxicol In Vitro. 2015; 29:308–13. https://doi.org/10.1016/j.tiv.2014.11.008 [PubMed]
- 3. El Behery MM, Huda MH, Kamal EM, Shehatta AE. Diagnostic accuracy of uterine fluid lactate dehydrogenase isoenzyme activity profile and vaginal ultrasound in detecting endometrial cancer in women with postmenopausal bleeding. Arch Gynecol Obstet. 2010; 281:717–21. https://doi.org/10.1007/s00404-009-1231-9 [PubMed]
- 4. Neppe C, Land R, Obermair A. Wrigley forceps to deliver a bulky uterus following a total laparoscopic hysterectomy for endometrial cancer. Aust N Z J Obstet Gynaecol. 2005; 45:444–45. https://doi.org/10.1111/j.1479-828X.2005.00460.x [PubMed]
- 5. Bray F, Ferlay J, Soerjomataram I, Siegel RL, Torre LA, Jemal A. Global cancer statistics 2018: GLOBOCAN estimates of incidence and mortality worldwide for 36 cancers in 185 countries. CA Cancer J Clin. 2018; 68:394–424. https://doi.org/10.3322/caac.21492 [PubMed]
- 6. Hodson R. Precision medicine. Nature. 2016; 537:S49. https://doi.org/10.1038/537S49a [PubMed]
- 7. Tang JY, Lee JC, Hou MF, Wang CL, Chen CC, Huang HW, Chang HW. Alternative splicing for diseases, cancers, drugs, and databases. Sci World J. 2013; 2013:703568. https://doi.org/10.1155/2013/703568 [PubMed]
- 8. Bowler E, Porazinski S, Uzor S, Thibault P, Durand M, Lapointe E, Rouschop KM, Hancock J, Wilson I, Ladomery M. Hypoxia leads to significant changes in alternative splicing and elevated expression of CLK splice factor kinases in PC3 prostate cancer cells. BMC Cancer. 2018; 18:355. https://doi.org/10.1186/s12885-018-4227-7 [PubMed]
- 9. Le KQ, Prabhakar BS, Hong WJ, Li LC. Alternative splicing as a biomarker and potential target for drug discovery. Acta Pharmacol Sin. 2015; 36:1212–18. https://doi.org/10.1038/aps.2015.43 [PubMed]
- 10. Shi Y, Chen Z, Gao J, Wu S, Gao H, Feng G. Transcriptome-wide analysis of alternative mRNA splicing signature in the diagnosis and prognosis of stomach adenocarcinoma. Oncol Rep. 2018; 40:2014–22. https://doi.org/10.3892/or.2018.6623 [PubMed]
- 11. Hagen RM, Ladomery MR. Role of splice variants in the metastatic progression of prostate cancer. Biochem Soc Trans. 2012; 40:870–74. https://doi.org/10.1042/BST20120026 [PubMed]
- 12. Sampath J, Pelus LM, Sampath J, Pelus L. Alternative splice variants of survivin as potential targets in cancer. Curr Drug Discov Technol. 2007; 4:174–91. https://doi.org/10.2174/157016307782109652 [PubMed]
- 13. Miura K, Fujibuchi W, Sasaki I. Alternative pre-mRNA splicing in digestive tract malignancy. Cancer Sci. 2011; 102:309–16. https://doi.org/10.1111/j.1349-7006.2010.01797.x [PubMed]
- 14. Skrzypczak M, Merx I, Schüler-Toprak S, Weber F, Inwald EC, Ortmann O, Treeck O. Molecular profiling of estrogen receptor α and progesterone receptor transcript variants in endometrial cancer. Steroids. 2015; 104:122–28. https://doi.org/10.1016/j.steroids.2015.09.004 [PubMed]
- 15. Hirschfeld M, Ouyang YQ, Jaeger M, Erbes T, Orlowska-Volk M, Zur Hausen A, Stickeler E. HNRNP G and HTRA2-BETA1 regulate estrogen receptor alpha expression with potential impact on endometrial cancer. BMC Cancer. 2015; 15:86. https://doi.org/10.1186/s12885-015-1088-1 [PubMed]
- 16. Häring J, Skrzypczak M, Stegerer A, Lattrich C, Weber F, Görse R, Ortmann O, Treeck O. Estrogen receptor β transcript variants associate with oncogene expression in endometrial cancer. Int J Mol Med. 2012; 29:1127–36. https://doi.org/10.3892/ijmm.2012.929 [PubMed]
- 17. Schaal K, Hirschfeld M, Bronsert P, Füllgraf H, Jäger M, Herde B, Nöthling C, Mayer S, Erbes T, Stickeler E. Alternative splicing of synuclein gamma in endometrial cancer: identification of a novel isoform. Oncotarget. 2015; 6:22553–63. https://doi.org/10.18632/oncotarget.4155 [PubMed]
- 18. Zhang B, zur Hausen A, Orlowska-Volk M, Jäger M, Bettendorf H, Stamm S, Hirschfeld M, Yiqin O, Tong X, Gitsch G, Stickeler E. Alternative splicing-related factor YT521: an independent prognostic factor in endometrial cancer. Int J Gynecol Cancer. 2010; 20:492–99. https://doi.org/10.1111/IGC.0b013e3181d66ffe [PubMed]
- 19. Bader GD, Hogue CW. An automated method for finding molecular complexes in large protein interaction networks. BMC Bioinformatics. 2003; 4:2. https://doi.org/10.1186/1471-2105-4-2 [PubMed]
- 20. Wang Y, Ye F, Huang C, Xue F, Li Y, Gao S, Qiu Z, Li S, Chen Q, Zhou H, Song Y, Huang W, Tan W, Wang Z. Bioinformatic Analysis of Potential Biomarkers for Spinal Cord-injured Patients with Intractable Neuropathic Pain. Clin J Pain. 2018; 34:825–30. https://doi.org/10.1097/AJP.0000000000000608 [PubMed]
- 21. Ashburner M, Ball CA, Blake JA, Botstein D, Butler H, Cherry JM, Davis AP, Dolinski K, Dwight SS, Eppig JT, Harris MA, Hill DP, Issel-Tarver L, et al, and The Gene Ontology Consortium. Gene ontology: tool for the unification of biology. Nat Genet. 2000; 25:25–29. https://doi.org/10.1038/75556 [PubMed]
- 22. Zhang J, Ren J, Wei J, Chong CC, Yang D, He Y, Chen GG, Lai PB. Alternative splicing of estrogen receptor alpha in hepatocellular carcinoma. BMC Cancer. 2016; 16:926. https://doi.org/10.1186/s12885-016-2928-3 [PubMed]
- 23. Richter TM, Tong BD, Scholnick SB. Epigenetic inactivation and aberrant transcription of CSMD1 in squamous cell carcinoma cell lines. Cancer Cell Int. 2005; 5:29. https://doi.org/10.1186/1475-2867-5-29 [PubMed]
- 24. Canzoneri R, Rabassa ME, Gurruchaga A, Ferretti V, Palma S, Isla-Larrain M, Croce MV, Lacunza E, Abba MC. Alternative splicing variant of RHBDD2 is associated with cell stress response and breast cancer progression. Oncol Rep. 2018; 40:909–15. https://doi.org/10.3892/or.2018.6489 [PubMed]
- 25. Zhou M, Zhang Z, Zhao H, Bao S, Sun J. A novel lncRNA-focus expression signature for survival prediction in endometrial carcinoma. BMC Cancer. 2018; 18:39. https://doi.org/10.1186/s12885-017-3983-0 [PubMed]
- 26. Ying J, Wang Q, Xu T, Lyu J. Establishment of a nine-gene prognostic model for predicting overall survival of patients with endometrial carcinoma. Cancer Med. 2018; 7:2601–11. https://doi.org/10.1002/cam4.1498 [PubMed]
- 27. Wang Y, Ren F, Chen P, Liu S, Song Z, Ma X. Identification of a six-gene signature with prognostic value for patients with endometrial carcinoma. Cancer Med. 2018; 7:5632–42. https://doi.org/10.1002/cam4.1806 [PubMed]
- 28. Yang YT, Chiu YC, Kao CJ, Hou HA, Lin CC, Tsai CH, Tseng MH, Chou WC, Tien HF. The prognostic significance of global aberrant alternative splicing in patients with myelodysplastic syndrome. Blood Cancer J. 2018; 8:78. https://doi.org/10.1038/s41408-018-0115-2 [PubMed]
- 29. Chen J, Weiss WA. Alternative splicing in cancer: implications for biology and therapy. Oncogene. 2015; 34:1–14. https://doi.org/10.1038/onc.2013.570 [PubMed]
- 30. Zhou X, Wang R, Li X, Yu L, Hua D, Sun C, Shi C, Luo W, Rao C, Jiang Z, Feng Y, Wang Q, Yu S. Splicing factor SRSF1 promotes gliomagenesis via oncogenic splice-switching of MYO1B. J Clin Invest. 2018. Epub ahead of print. https://doi.org/10.1172/JCI120279 [PubMed]
- 31. Tabaglio T, Low DH, Teo WK, Goy PA, Cywoniuk P, Wollmann H, Ho J, Tan D, Aw J, Pavesi A, Sobczak K, Wee DK, Guccione E. MBNL1 alternative splicing isoforms play opposing roles in cancer. Life Sci Alliance. 2018; 1:e201800157. https://doi.org/10.26508/lsa.201800157 [PubMed]
- 32. Liu Y, et al. Regulation between two alternative splicing isoforms ZNF148FL and ZNF148ΔN, and their roles in the apoptosis and invasion of colorectal cancer. Pathol Res Pract. 2018. Epub ahead of print. https://doi.org/10.1016/j.prp.2018.10.036
- 33. Wong YF, Cheung TH, Lo KW, Yim SF, Siu NS, Chan SC, Ho TW, Wong KW, Yu MY, Wang VW, Li C, Gardner GJ, Bonome T, et al. Identification of molecular markers and signaling pathway in endometrial cancer in Hong Kong Chinese women by genome-wide gene expression profiling. Oncogene. 2007; 26:1971–82. https://doi.org/10.1038/sj.onc.1209986 [PubMed]
- 34. Matsuzaki S, Fukaya T, Suzuki T, Murakami T, Sasano H, Yajima A. Oestrogen receptor alpha and beta mRNA expression in human endometrium throughout the menstrual cycle. Mol Hum Reprod. 1999; 5:559–64. https://doi.org/10.1093/molehr/5.6.559 [PubMed]
- 35. Einarsdóttir K, Darabi H, Czene K, Li Y, Low YL, Li YQ, Bonnard C, Wedrén S, Liu ET, Hall P, Liu J, Humphreys K. Common genetic variability in ESR1 and EGF in relation to endometrial cancer risk and survival. Br J Cancer. 2009; 100:1358–64. https://doi.org/10.1038/sj.bjc.6604984 [PubMed]
- 36. Chen L, Liu MM, Liu H, Lu D, Zhao XD, Yang XJ. ERCC1 and XRCC1 but not XPA single nucleotide polymorphisms correlate with response to chemotherapy in endometrial carcinoma. OncoTargets Ther. 2016; 9:7019–28. https://doi.org/10.2147/OTT.S110976 [PubMed]
- 37. Wang Y, Zhu Y, Zhang L, Tian W, Hua S, Zhao J, Zhang H, Xue F. Insulin promotes proliferation, survival, and invasion in endometrial carcinoma by activating the MEK/ERK pathway. Cancer Lett. 2012; 322:223–31. https://doi.org/10.1016/j.canlet.2012.03.026 [PubMed]
- 38. Jeong HM, Han J, Lee SH, Park HJ, Lee HJ, Choi JS, Lee YM, Choi YL, Shin YK, Kwon MJ. ESRP1 is overexpressed in ovarian cancer and promotes switching from mesenchymal to epithelial phenotype in ovarian cancer cells. Oncogenesis. 2017; 6:e389. https://doi.org/10.1038/oncsis.2017.87 [PubMed]
- 39. Wang Y, Chen D, Qian H, Tsai YS, Shao S, Liu Q, Dominguez D, Wang Z. The splicing factor RBM4 controls apoptosis, proliferation, and migration to suppress tumor progression. Cancer Cell. 2014; 26:374–89. https://doi.org/10.1016/j.ccr.2014.07.010 [PubMed]
- 40. Ryan MC, Cleland J, Kim R, Wong WC, Weinstein JN. SpliceSeq: a resource for analysis and visualization of RNA-Seq data on alternative splicing and its functional impacts. Bioinformatics. 2012; 28:2385–87. https://doi.org/10.1093/bioinformatics/bts452 [PubMed]
- 41. Lex A, Gehlenborg N, Strobelt H, Vuillemot R, Pfister H. UpSet: Visualization of Intersecting Sets. IEEE Trans Vis Comput Graph. 2014; 20:1983–92. https://doi.org/10.1109/TVCG.2014.2346248 [PubMed]
- 42. Heagerty PJ, Lumley T, Pepe MS. Time-dependent ROC curves for censored survival data and a diagnostic marker. Biometrics. 2000; 56:337–44. https://doi.org/10.1111/j.0006-341X.2000.00337.x [PubMed]
- 43. Liang Y, Tebaldi T, Rejeski K, Joshi P, Stefani G, Taylor A, Song Y, Vasic R, Maziarz J, Balasubramanian K, Ardasheva A, Ding A, Quattrone A, Halene S. SRSF2 mutations drive oncogenesis by activating a global program of aberrant alternative splicing in hematopoietic cells. Leukemia. 2018; 32:2659–71. https://doi.org/10.1038/s41375-018-0152-7 [PubMed]
- 44. Ouyang YQ, zur Hausen A, Orlowska-Volk M, Jäger M, Bettendorf H, Hirschfeld M, Tong XW, Stickeler E. Expression levels of hnRNP G and hTra2-beta1 correlate with opposite outcomes in endometrial cancer biology. Int J Cancer. 2011; 128:2010–19. https://doi.org/10.1002/ijc.25544 [PubMed]
- 45. Warzecha CC, Sato TK, Nabet B, Hogenesch JB, Carstens RP. ESRP1 and ESRP2 are epithelial cell-type-specific regulators of FGFR2 splicing. Mol Cell. 2009; 33:591–601. https://doi.org/10.1016/j.molcel.2009.01.025 [PubMed]
- 46. Shapiro IM, Cheng AW, Flytzanis NC, Balsamo M, Condeelis JS, Oktay MH, Burge CB, Gertler FB. An EMT-driven alternative splicing program occurs in human breast cancer and modulates cellular phenotype. PLoS Genet. 2011; 7:e1002218. https://doi.org/10.1371/journal.pgen.1002218 [PubMed]
- 47. Leontieva OV, Ionov Y. RNA-binding motif protein 35A is a novel tumor suppressor for colorectal cancer. Cell Cycle. 2009; 8:490–97. https://doi.org/10.4161/cc.8.3.7679 [PubMed]
- 48. Ueda J, Matsuda Y, Yamahatsu K, Uchida E, Naito Z, Korc M, Ishiwata T. Epithelial splicing regulatory protein 1 is a favorable prognostic factor in pancreatic cancer that attenuates pancreatic metastases. Oncogene. 2014; 33:4485–95. https://doi.org/10.1038/onc.2013.392 [PubMed]
- 49. Fredericks AM, Cygan KJ, Brown BA, Fairbrother WG. RNA-Binding Proteins: Splicing Factors and Disease. Biomolecules. 2015; 5:893–909. https://doi.org/10.3390/biom5020893 [PubMed]
- 50. Wagner GP, Kin K, Lynch VJ. A model based criterion for gene expression calls using RNA-seq data. Theory Biosci. 2013; 132:159–64. https://doi.org/10.1007/s12064-013-0178-3 [PubMed]
- 51. Huang ZG, He RQ, Mo ZN. Prognostic value and potential function of splicing events in prostate adenocarcinoma. Int J Oncol. 2018; 53:2473–87. https://doi.org/10.3892/ijo.2018.4563 [PubMed]
- 52. Shen B, Yuan Y, Zhang Y, Yu S, Peng W, Huang X, Feng J. Long non-coding RNA FBXL19-AS1 plays oncogenic role in colorectal cancer by sponging miR-203. Biochem Biophys Res Commun. 2017; 488:67–73. https://doi.org/10.1016/j.bbrc.2017.05.008 [PubMed]
- 53. Chen X, Zhang JX, Luo JH, Wu S, Yuan GJ, Ma NF, Feng Y, Cai MY, Chen RX, Lu J, Jiang LJ, Chen JW, Jin XH, et al. CSTF2-induced shortening of the RAC1 3'UTR promotes the pathogenesis of urothelial carcinoma of the bladder. Cancer Res. 2018; 78:5848–62. https://doi.org/10.1158/0008-5472.CAN-18-0822 [PubMed]
- 54. Tabl AA, Alkhateeb A, Pham HQ, Rueda L, ElMaraghy W, Ngom A. A Novel Approach for Identifying Relevant Genes for Breast Cancer Survivability on Specific Therapies. Evol Bioinform Online. 2018; 14:1176934318790266. https://doi.org/10.1177/1176934318790266 [PubMed]
- 55. Chen Z, Lin S, Li JL, Ni W, Guo R, Lu J, Kaye FJ, Wu L. CRTC1-MAML2 fusion-induced lncRNA LINC00473 expression maintains the growth and survival of human mucoepidermoid carcinoma cells. Oncogene. 2018; 37:1885–95. https://doi.org/10.1038/s41388-017-0104-0 [PubMed]
- 56. Ma Q, Yang Y, Feng D, Zheng S, Meng R, Fa P, Zhao C, Liu H, Song R, Tao T, Yang L, Dai J, Wang S, et al. MAGI3 negatively regulates Wnt/β-catenin signaling and suppresses malignant phenotypes of glioma cells. Oncotarget. 2015; 6:35851–65. https://doi.org/10.18632/oncotarget.5323 [PubMed]