


Introduction
Myogenesis is an ordered process driven by myogenic regulatory factors, coordinated with permanent cell cycle withdrawal and culminating in myoblasts fusion in myotubes. Myogenic differentiation process requires bHLH transcription factor family of myogenic regulatory factors (MRFs), including MyoD, Myogenin and Mrf4 which lead to expression of muscle-specific proteins, such as myosin heavy chain (MHC) and creatine kinase (CK) and to multinucleated myotube formation [1]. Cell cycle arrest occurs early during the differentiation program playing a key role in myoblast differentiation into mature myotubes [2–8]. In addition to autophagy [9,10], the retinoblastoma protein (Rb) is a key factor, indeed myoblasts lacking Rb fails to exit the cell cycle [11–13]. Invitro and in vivo experiments demonstrated that also the cyclin-dependent-kinase inhibitors p21Cip/Waf1 (p21) and p57Kip2 (p57) are important during myogenesis, acting redundantly to inhibits cell cycle arrest during myoblast differentiation [10,14–16]. Upregulation of p21 and the dephosphorylation of retinoblastoma protein (pRb) appear to be critical regulatory events for the establishment of both the postmitotic and apoptosis-resistant states, the latter is relevant for controlling muscle mass and thereby the size of individual motor units [17].
Several studies indicated that p53 and its family members, p63 and p73, are also involved in myoblast differentiation [13,18–24], regulating cell cycle exit and the early stage of myogenesis. TP53 is primarily related to its tumour suppression function [25–27] despite solid evidence of a differentiation function [28–31]. TP63 and TP73 genes are transcribed by two different promoters, giving rise to multiple isoforms with own properties, the (TA) isoforms with an N-terminal transactivation domain and the N-terminal truncated (ΔN) isoforms. Moreover alternative splicing at mRNA 3’-end generates isoforms with different C-temini length and sequence (α, β, γ, δ and ε) and also different properties [32–36]. All p53 family members are involved in myoblast differentiation and rhabdomyosarcoma development [13,16]. TP63 is essential for skin development [13,37,38], but plays also a crucial role in cancer biology [39,40] as well as in skeletal muscle homeostasis [41]. Indeed, TAp63γ isoform is the only member of the p53 family that accumulates during in vitro myoblasts differentiation and its silencing leads to a delay in terminal differentiation and a reduction of the fusion index [16]. To date the specific role of TAp63γ has not been investigated. Here, using as experimental system the well established in vitro model involving the immortalized murine myoblast C2C12 and C2C7 cell lines [42], we asked the question whether TAp63γ has a specific role in myoblasts, independent from the other family member p53 and p73. We generated sh-p63 and Tet-ON doxycycline-inducible TAp63γ clones to study the effects of TAp63γ depletion and/or ectopic expression in proliferating myoblasts. By whole transcriptome mRNA profiling, we found that p63-depletion affects the expression of genes involved in proliferation and metabolism. Indeed, sh-p63 knock-down cells present an increased cell proliferation rate, while TAp63γ over-expression decreases proliferation. Interestingly, p63 depletion affects also mitochondria functions as indicated by the reduction of the spare respiratory capacity, the decrease in complex I and IV protein levels and ATP reduction. Furthermore, mitochondria reactive oxygen species increase and the NADP/NADPH ratio decrease. Overall, these results indicate that TAp63γ participate to myoblasts proliferation controlling both cell cycle exit and mitochondrial metabolism.
Results
TAp63 modulates gene expression in myoblasts
To investigate the impact of p63 depletion in myoblasts, we performed a whole transcriptome mRNA expression profiling in C2C7 cells. To this aim, we generated stable scramble (Scr) and sh-p63 C2C7 clones (sh1- and sh2-p63) (Fig. 1A). The used sh sequences are designed to knock down all p63 isoforms. As control, we showed that sh1- and sh2-p63 clones showed a reduction of the bona fide TAp63 direct target, Cdkn1a (p21) (Fig. 1B). Furthermore, the reduction of TAp63 expression in these clones was maintained also during differentiation as indicated by TAp63 RT-qPCR (Fig. S1A-B). sh1- and sh2-p63 cells also presented a delay in differentiation as evaluated by phase contrast microscopy, immunofluorescence for MyHC and by western blots against MyHC and MyoG proteins (Fig. S1B-D), confirming previous obtained results [16]. By whole transcriptome mRNA profiling, we compared scramble versus sh1-p63 transcripts. In this conditions, we have identified 2123 up-regulated and 1989 down-regulated genes (cut-off log(FC)< -0,5 and log(FC)>0,5, p-value<0,05; Fig. S1C, Table S1). Gene Ontology analysis of significantly modulated genes were classified in different groups linked to “muscle structure development”, “regulation of cell proliferation”, “regulation of cell metabolic process” (Fig. 1D). Genes included in the “regulation of cell proliferation” and “regulation of cell metabolic process” categories are indicated in Fig. 1E. Selected genes related to proliferation (Pold4, Gas6, Rgcc, Igf2) and metabolism (Als2, HK1, Pdk4) were validated by independent RT-qPCRs (Fig. 1F, 0.001 Figure 1. TAp63 knock-down affects the expression of genes involved in proliferation and metabolism. (A) RT-qPCR of p63 mRNA (Trp63) and (B) p21 (Cdkn1a) performed in proliferating Scr, sh1-p63 and sh2-p63 clones. Results are shown as average of three experiments ± s.d. *p<0.05. (C) Volcano plot showing -log10(FDR) in function of the log2(FC) for coding genes in Scr and sh1-p63. Green points indicate significantly expressed genes (D) GO terms of microarray performed on significantly modulated genes in C2C7 myoblasts (C). Panther was used for biological process (http://pantherdb.org/). (E) Heatmap expression level of genes from “positive regulation of cell proliferation” and “regulation of cellular metabolism” categories. (F) RT-qPCR analysis of mRNA level of modulated genes. Results are shown as average of three experiments ± s.d. *p<0.05, **p<0.01.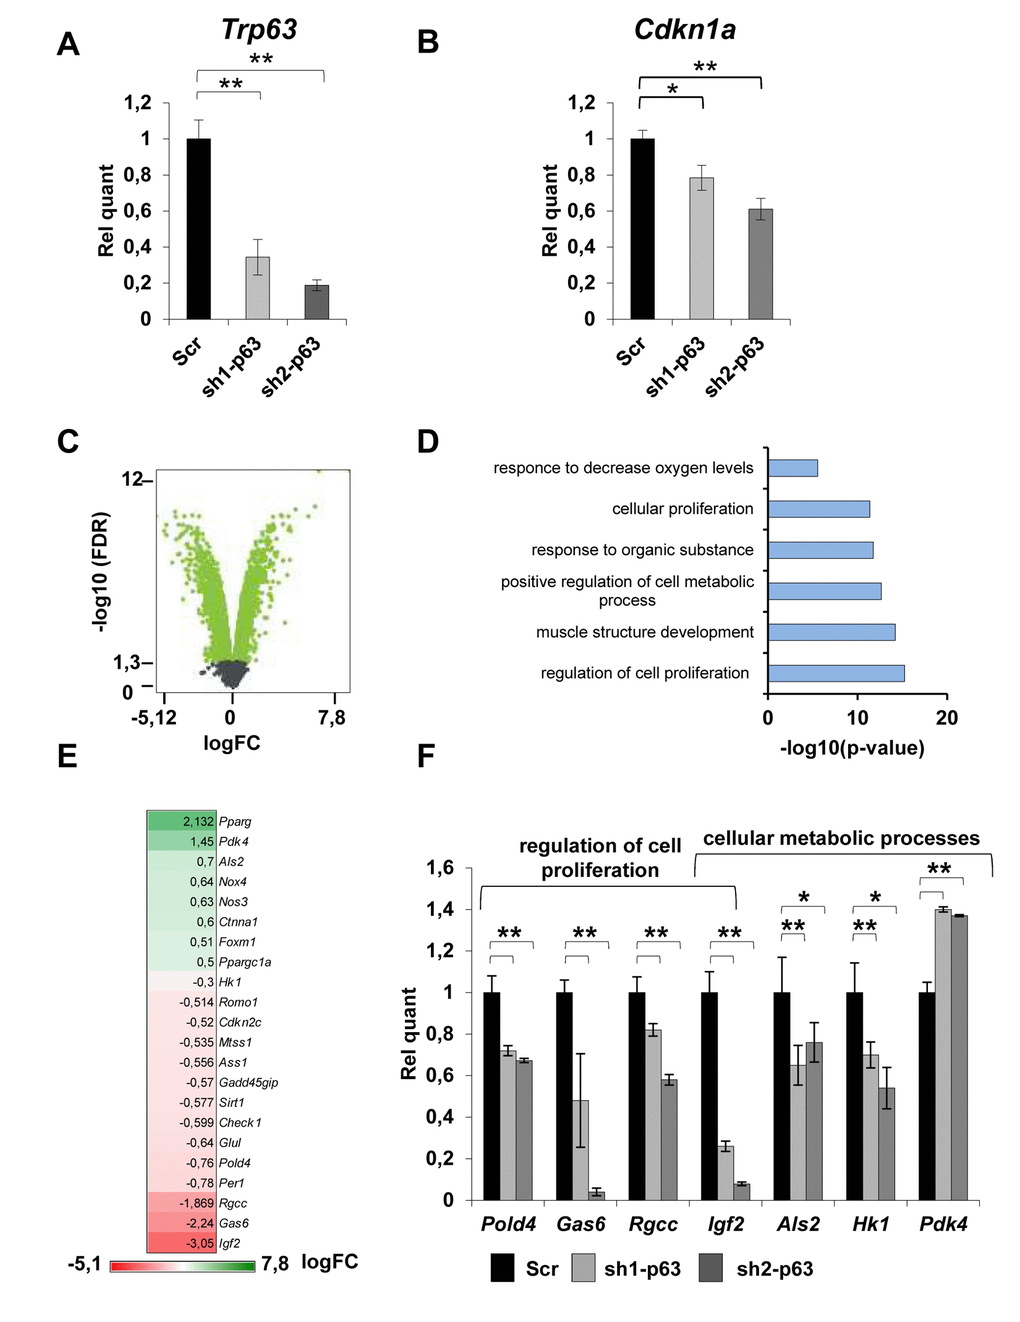
TAp63 knock-down affects myoblast proliferation
To better characterize the role of p63 depletion in myoblasts, we evaluated cell proliferation in sh1- and sh2-p63 C2C7 clones. Growth curves showed a significant increase of cell number at 72 hours (Fig. 2A, p<0,01). This was confirmed evaluating cells in S-phase by EdU-incorporation assay (Fig. 2B, p<0.01) and by clonogenic assay, in which the clone numbers increased 1.5 and 2.2 fold over scramble cells for sh1- and sh2-p63 clones, respectively (Fig. 2C, p<0.05). Time courses evaluating p57 and p21 expression by western blots (Fig. 2D), are in line with enhanced proliferation capacity of the sh1- and sh2-p63 myoblasts, in which p21 and p57 expression decreased. We generated an additional cellular model to further confirm these findings using the Tet-ON system. C2C12 myoblasts expressing TAp63γ under the control of doxycycline (Dox) were used to demonstrate the opposite; indeed doxycycline addition resulted in a decrease of cells number, that is evident already after 24 hours after induction (Fig. 2E-F, p<0.05) and confirmed in shorted time-points (8, 16 and 24 hours of induction) by cell cycle analysis (Fig. S2A-B). As control, we confirmed that induction of TAp63γ does not induce cell death in these cells, evaluated as hypo-diploid events (Sub-G1 events, Fig. S2C). Clonogenic assays also confirmed the strong TAp63γ anti-proliferative effect, resulting in reduction of about 50% of the clone (Fig. 2G, p<0.05). Altogether these data indicated that, in vitro, TAp63γ is involved in controlling myoblast proliferation.
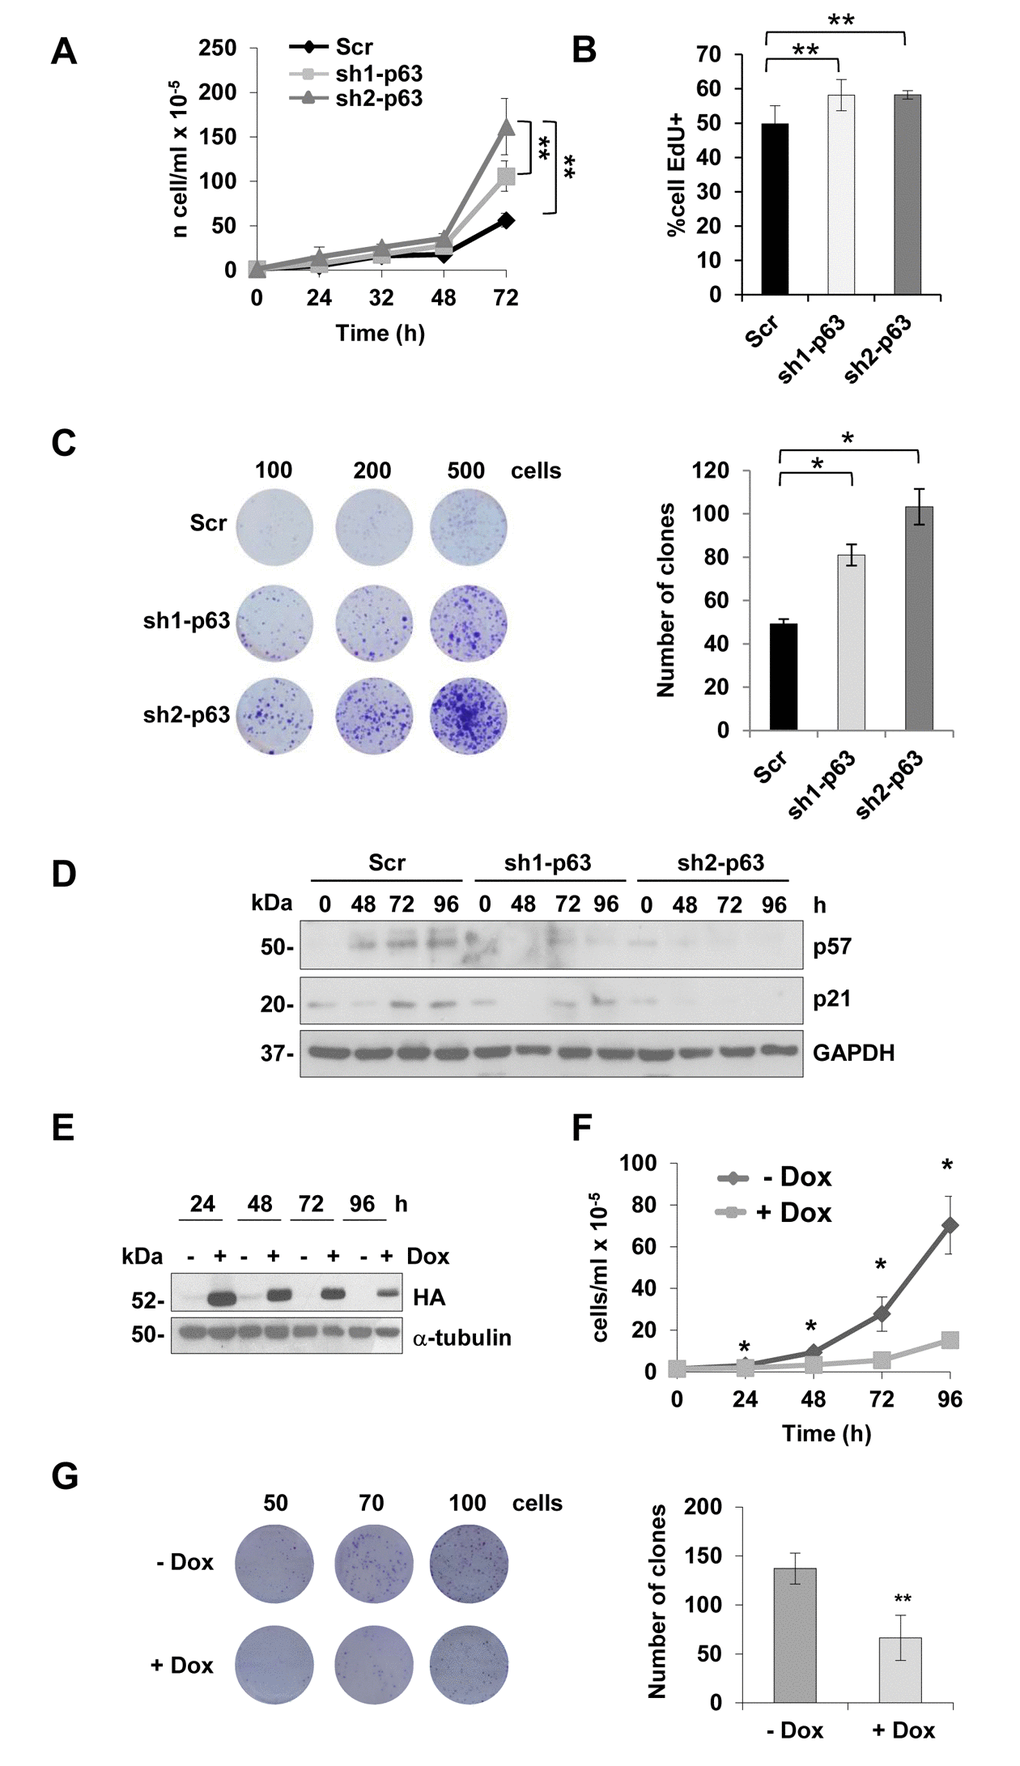
Figure 2. TAp63 knock-down increases myoblast proliferation. (A) Growth curve of C2C7 Scr, sh1- and sh2-p63 clones. One representative experiment of three is shown. (B) EdU-incorporation assay in proliferating C2C7 scramble Scr, sh1- and sh2-p63 clones. Data are shown as mean± S.D. **p<0,01 by T-student test. (C) Clonogenicity assay of C2C7 Scr, sh1- and sh2-p63 clones. Images of one experiment of three are shown. Colony number count/dish is reported in the histogram (right). *p< 0,05 by T-student test. Data are shown as mean ± S.D. of three independent experiments. (D) Western blot confirming reduced expression of p21 and p57 in sh1- and sh2-p63. One representative experiment of three is shown. (E) Western blot analysis of C2C12 upon doxycyclin treatments (Tet-ON, Dox). Tubulin is shown as loading control. One representative experiment of three is shown. (F) Growth curve of Tet-ON TAp63γ C2C12 cells after 24, 48, 72 and 96h of Dox (2µg/ml) induction. (G) Clonogenicity assay of Tet-ON TAp63γ C2C12 cells after 6 days doxycycline (2µg/ml) induction. Colony number count/dish is reported in the histogram (right). Data are shown as mean ± S.D. of three independent experiments. *p< 0,05; **p< 0,01.
TAp63 knock-down induces mitochondrial-derived oxidative stress
Since p63 depletion has been associated in different cell types to oxidative stress [43–45] in standard culturing conditions, we investigated mitochondrial functions, since they play an important role in oxidative metabolism and represent the cellular source of reactive oxygen species (ROS), as well as in several other essential physiological functions [46–53]. We measured superoxide anion levels production by Mitosox Red analysis by flow cytometry in C2C7 scramble and sh1- and sh2-p63 C2C7 cells. Depletion of p63 leads to an increase in mitochondrial oxidative stress, more specifically O2-, from 1 to 1.5 fold over control for both sh1- and sh2-p63 cells, respectively (Fig. 3A, p<0.01 and p<0.05), indicating that electrons can escape between complexes and become trapped in oxygen. Though, Mitotracker Red staining, to detect mitochondrial content and shape, did not show differences among Scr and both sh1- and sh2-p63 cells, respectively (Fig. 3B). Furthermore, mitochondrial DNA copy numbers did not change, as evaluated by measuring by RT-qPCR the expression of the mitochondrial genes Nd5 and 12S related to the expression of the single copy nuclear gene Sdha (Fig. 3C). In an attempt to understand the reason for the O2- increases upon p63 depletion, we evaluated by western blot the relative levels of mitochondrial OXPHOS (complexes I–V, Fig. 3D). Results indicate down-regulation of complex IV (MTCO1) and complex I (NDUFB8) proteins upon p63 depletion. These results suggest a link of TAp63 in controlling mitochondrial function in C2C7 myoblasts.
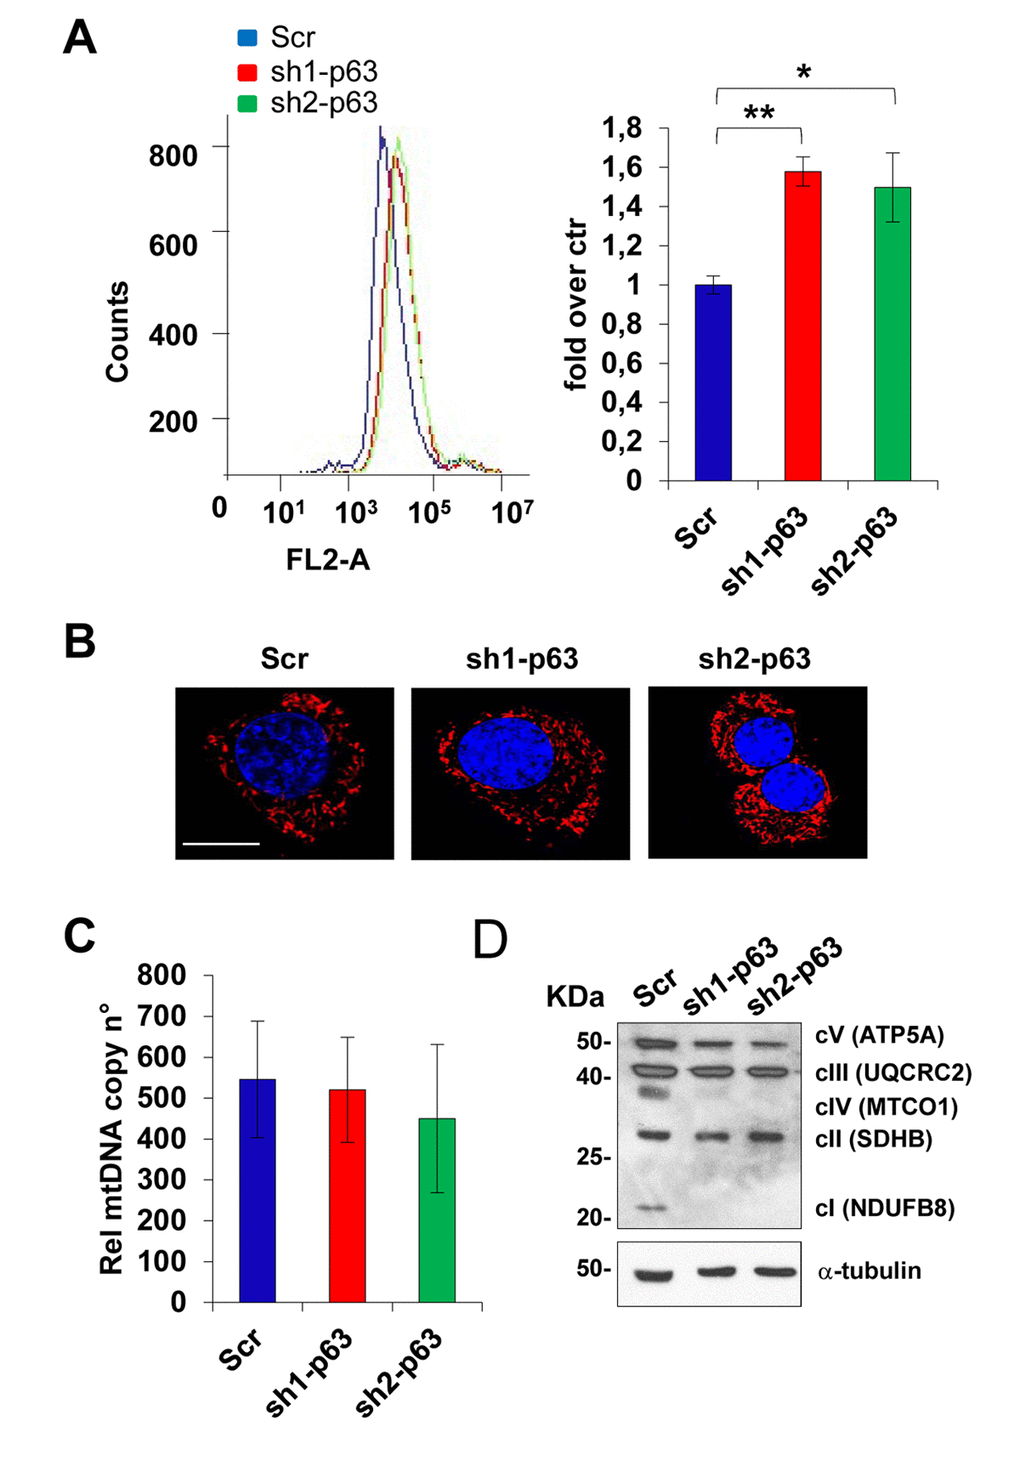
Figure 3. TAp63 knock-down affect mitochondrial functions. (A) Mitosox Red analysis by flow cytometry in C2C7 Scr, Sh1 and Sh2 clones to assay mitochondrial superoxide anion levels. One of three independent experiments is shown (left). Quantification of fluorescence intensity is shown in the histogram (right). Data are shown as mean ± S.D. from three independent experiments. *p< 0,05 and **p< 0,01 by T-student test. (B) Mitotracker Red staining to detect mitochondrial content and shape. One representative experiment is shown. Magnification bar: 10μm. (C) qPCR relative to mitochondrial DNA copy number quantificated by the expression level of mitochondrial gene Nd5 and 12S related to expression of single copy gene Sdha. One from three independent experiments is shown. (D) OXPHOS antibody mixture was used to detect mitochondrial protein level by western blot in C2C7 scramble control (Scr), sh1- and sh2-p63 clones. One of three independent experiments is shown.
TAp63 knock-down affects mitochondrial respiration
Keeping in mind that p53 is known to regulate oxygen consumption with different pathways, as well as its family members TAp73 and ΔNp63 [44,45,54,55], we decided to evaluate aerobic respiration in scramble and p63-depleted cells. We found that p63 depleted cells (sh1-and sh2-p63 clones) had an attenuated mitochondrial respiration with a significantly reduced oxygen consumption rate (OCR, Fig. 4A). Basal mitochondrial respiration is slightly changed between scramble control cells and p63-depleted clones as estimated by measuring OCR (pmol/min). Both the maximal respiratory capacity (MR) and the spare respiratory capacity (SRC) are significantly attenuated in the p63-depleted clones compared to scramble control cells; supporting the idea that mitochondria retain sensitivity to environmental stress (Fig. 4B). Yet, depletion of p63 resulted in the inability of C2C7 to relay on aerobic respiration. Oligomycin injection induced aerobic metabolism in scramble control cells, as underlined by the tendency to increase extracellular acidification rate (ECAR, Fig. 4C), while p63 depleted cells did not responded at all, failing to rescue the cells that were unable to reply on the glycolytic pathway. As matter of fact, ATP level strongly decrease in p63 depleted clones (23% and 45% inhibition in sh1- and sh2-p63 cells, respectively; Fig. 4D). Finally, decreases in NADP+/NADPH ratio in sh1- and sh2-p63 cells (from 33% in scramble cells to 27% and 19% in sh1- and sh2-p63 cells, respectively, p<0.05; Fig. 4E) suggested that the abnormalities in aerobic and anaerobic respiration direct the metabolism toward other metabolic pathways (ie. pentose phosphate). NADPH increases confirmed also the need of p63-depleted cells to maintain thigh the level of anti-oxidant defence molecules.
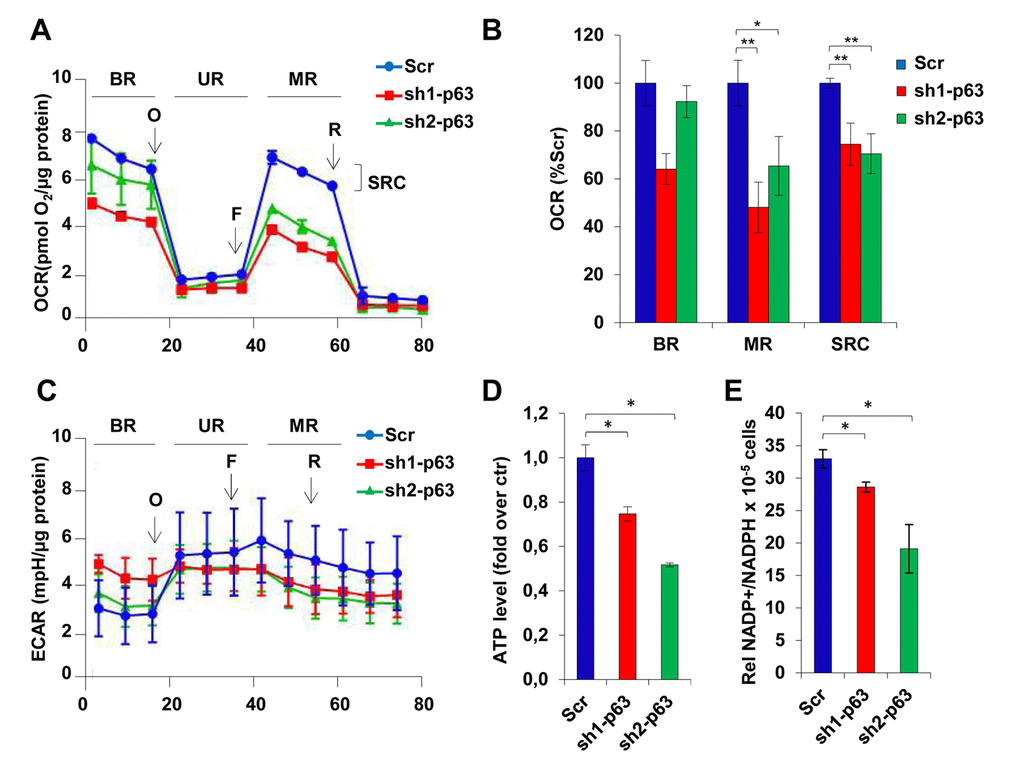
Figure 4. TAp63 knock-down affects mitochondrial respiration. (A) OCR performed in 6 well seahorse assay plates shows the cellular respiration profile in C2C7 Scr, Sh-1 and Sh2-p63 clones after treatment with the drugs oligomycin (40µg/µl), FCCP (50nM) and rotenone (25nM). One representative of three independent experiments is shown. (B) The relative quantification of the area below the curves corresponding to stage BR, UR, MR and SRC (basal respiration, uncoupled respiration, maximal respiration and spare respiratory capacity) is shown in histogram and reported as percentage of Scr. Data are shown as mean ± S.D. of three measures detected after drugs injection and normalized to µg of proteins *p< 0,05 and **p< 0,01. (C) ECAR performed in 6 well seahorse assay plates shows the cellular respiration profile in C2C7 Scr, sh1- and sh2-p63 clones after treatment with the drugs oligomycin (40µg/µl), FCCP (50nM) and rotenone (25nM). One representative of three independent experiments is shown. (D) ATP levels in C2C7 Scr, sh1- and sh2-p63 clones are normalized to the cell number and are reported as relative quantification to the Scr. Data are shown as mean ± S.D. from three independents experiments *p< 0,05 by Student T-test. (E) NADP+/NADPH ratio in Scr, sh1- and sh2-p63 C2C7 clones are normalized to the cell number. Data are shown as mean ± S.D. from three independent experiments *p<0,05; **p<0,01.
Discussion
Aging involves a complex set of genetic [56–58] and metabolic [59–65] pathways that engage all organs, including muscles [66,67]. In these pathways a role for p53 [68–72] and its family members [55,73] is well established. In particular, p63 is involved in senescence and aging [74,75]. The p63 gene, the ancestral member of the p53 family [32,55,76] clearly involved in cancer [77–80], is crucial for the development as well as for the adult homeostasis of the epidermis [34,81]. Here, through its transcriptional activity, it regulates the early differentiation and formation of the cornified envelope [82,83] as well as the apoptotic [84], senescence [85,86] and metabolic [36,44,87] activities of the skin. This function is directly and indirectly related to the barrier function of the skin, with its complex pathways [82,88–90] intended also at the immunological and inflammatory protection of the organism [91–95] and thus preventing unwanted immunopathologies [96–101]. Nonetheless, recent findings suggest also an additional role in myogenesis [16,19].
Several studies investigated the role of p53 and its family members in myoblasts differentiation, showing that while p53 directly regulated protein level of the retinoblastoma (RB) protein, p63 and p73 cooperates to RB activation, via their target gene cyclin kinase inhibitor p57KIP2, that maintains RB in an active hypo-phosphorylated state [13]. Previous studies generated in our laboratory point out at specific role of TAp63, specifically the TAp63γ isoform, during myoblast differentiation. Indeed, among the p53 family members the TAp63γ is the only one that accumulates during differentiation and knock-down of TAp63γ strongly delays and impairs myoblasts differentiation, as indicated by the reduction of specific markers and of the mitotic fusion index [16]. Here, we confirmed, using as model both sh-p63 C2C7 myoblasts and TAp63γ Tet-ON C2C12 myoblasts, the importance of TAp63γ in controlling cell cycle exit and proliferation. As matter of fact, sh-p63 clones present down-regulation of both p21 (CDKN1A) and p57 (CDKN1C) cyclin-dependent kinase inhibitors. Intriguingly, we found that genes usually expressed in proliferating cells (Gas6, Pold4 and Igf2) were down-regulated in p63-depleted myoblasts, indicating that additional pathways or compensatory mechanisms are engaged to limit cell proliferation in absence of p63. To find additional functions of TAp63γ in myoblasts we performed a gene array, comparing control C2C7 cells with p63-depleted C2C7 myoblasts. Our results demonstrated that in myoblasts lacking TAp63γ many genes related to metabolism are modulated. Furthermore, mitochondria activity appear altered as indicated by the increase of reactive oxygen species of mitochondrial origin and by alteration of the mitochondria function and respiratory capacities. Mitochondria are key organelles to provide, via oxidative phosphorylation, the energy necessary for cellular functions [102–107]. Several experimental evidences indicated that, in different cell types including myoblasts, mitochondria activity is strongly associated to cell differentiation [108–112]. Mitochondria function and activity is finely regulated during differentiation processes, including myogenesis, that was shown to be impaired in respiratory-deficient myoblasts [113]. Mitochondria play an important role also during myoblast proliferation [109,114]. In L6E9 muscle cells, for instance, the increase of mitochondrial oxidative metabolism by pyruvate blocks cells proliferation in G1 and S phases [115]. These data suggest that an oxidative metabolism and mitochondrial biogenesis are often associated to muscle cell differentiation, instead a glycolytic metabolism is required for myoblasts proliferation. Yet, in a different cellular system, it has been shown that p63, by directly controlling the expression of the mitochondrial-associated exokinase II enzyme, favours the coupling between glycolysis and oxidative metabolism [44], suggesting that also in myoblasts p63 could affect directly and/or indirectly both metabolisms. Interestingly, mitochondrial activity is altered in a rat Rhabdomyosarcoma cell line [116]. Rhabdomyosarcoma is the most common soft tissue sarcoma in childhood and adolescents; it arises from skeletal muscle that maintains myoblasts in a proliferative state [117]. As a matter of a fact, RH1 cell line shows a decrease in either ATP level, mitochondrial spare respiratory capacity [116] and a downregulation in CI [118], similarly to the sh-p63 depleted cells. Interestingly, deficiencies of the I-IV complexes expression have been reported in patients affected by several myopathies and neuromuscular diseases [119–123]. Furthermore, defects in mitochondrial ATP synthesis and complex I insufficiency have been also observed in isolated mitochondria from the diaphragm and tibialis anterior of 12 week-old dystrophin-deficient mdx mice [124]. These suggested to us that TAp63 expression and/or activity could be impaired in these pathologies, in keeping with the metabolic alterations observed in aging [125–130].
Overall, in line with the metabolic control in aging [104,131–133], these data indicate that, beside its anti-proliferative role, TAp63, controlling different sub-sets of target genes, may act in myoblasts modulating also mitochondria metabolism to provide the right metabolic platform necessary to allow myoblasts differentiation. These data expand the current knowledge about the involvement of p53 family members in muscle differentiation process, demonstrating that the function of the individual members, such as TAp63, are distinct from the other members. Further investigations will be necessary to address a possible role of TAp63 and its target genes in human myopathies.
Materials and Methods
Flow cytometer analysis
EdU incorporation during DNA synthesis was evaluated using the Click-it EdU flow cytometer assay according to manufacturer protocol. 10000 events were acquired using BD Accuri C6 Flow Cytometer and cell cycle was analyzed using BD Accuri C6 Software (BD Biosciences).
Tet-ON Tap63γ myoblasts were grown in presence or absence of doxycyclin (2µg/µl) for 8, 16 and 24 hours, fixed 30 minutes at 4 ̊C in methanol:aceton (4:1), incubated 20 minutes at 37̊C with RNAse A (20µg/ml) (Sigma, USA) and 20 minutes at room temperature with PI (50µg/ml) (Sigma, USA). 10000 events were acquired using BD FacsCalibur, cell cycle phases and subG1 populations were evaluated by ModFit LTTM software (BD Biosciences).
For the detection of mitochondrial anion superoxide, Scr, sh1-p63 and sh2-p63 cells were incubated with MitoSox Red dye (5µM, Invitrogen) for 10 minutes at 37°C and 10000 events were acquired using BD Accuri C6 Flow Cytometer and analyzed using BD Accuri C6 Software (BD Biosciences).
Growth curve and clonogenicity assay
Scr, sh1-p63 and sh2-p63 clones growth curves were obtained by counting cells 24, 32, 48, 60 and 72 hours after seeding while Tet-ON Tap63γ C2C12 cells were counted 24, 48, 72, and 96 hours after seeding. Cells were counted by TC20 Automated Cell Counter (BIO-RAD).
For clonogenicity assay 50, 100 and 200 Scr, sh1-p63 and sh2-p63 cells and 50, 70 and 100 Tet-ON TAp63γ cells were seeded. After 6 days cells were washed in PBS, fixed in glutaraldehyde (6.0% v/v) and stained by crystal violet (0.5% w/v). Colonies were counted after staining.
Western blotting
Myoblasts were lysed in RIPA buffer (50mM Tris-HCl pH 7.4, 150 mM NaCl, 1% NP40, 0.25%Na-deoxycolate, 1mM AEBSF, 1 mM DTT). 15-40 µg of total protein extracts were analysed by SDS PAGE and blotted onto Hybond PVDF membrane (GE Healthcare). Primary antibodies used were: Oxphos cocktail (MitoScience, 1:250), anti-HA (Biolegend, 1:500), anti-α-tubulin (Sigma, 1:10000). After appropriate horseradish peroxidise conjugated secondary antibodies incubation (Bio-Rad), signal detection was performed with ECL chemioluminescence kit (Perkin Elmer).
RNA-extraction, RT-qPCR, and whole transcriptome mRNA profiling
Total RNA was isolated using RNeasy Mini Kit (Qiagen) following the manufacturer protocol. 1µg of total RNA was used for cDNA synthesis by the GOScript Reverse Transcription System Kit (Promega). mRNAs relative quantification by Real time RT-qPCR was performed using GOTaq Real-Time PCR System (Promega) in Applied Biosystem 7500 Real-Time PCR System (Applied Biosystem). GAPDH was used as housekeeping gene for normalization. Primers used are reported in Table S2. Gene expression was defined from the threshold cycle (Ct), and relative expression levels were calculated by using the 2-ΔΔCt method.
Whole transcriptome mRNA profiling was performed by Biogazelle (Ghent, Belgium). Briefly 100ng of total RNA was processed using the Quick Amp labeling kit (Agilent), producing Cy3-labelled cRNA. cRNA was hybridized to a SurePrint G3 Mouse GE 8x60K Microarray (Agilent) and microarrays were analyzed using an Agilent microarray scanner and Feature Extraction software. Probe intensities were background subtracted and normalized using quantile normalization. Normalized probe intensities are log2-based. Normalized mRNA expression data and probe annotation are available on request.
Immunofluorecence and confocal microscopy
Cells were fixed in 4% paraformaldehyde in PBS for 15’ at RT, washed and permeabilized in 0.25% Triton-X-100 in PBS for 5’. Blocking was performed in 5% goat serum in PBS for 1 hour. Incubation with primary antibodies was at 4̊ C for 16h. Primary antibodies used was MHyC (Sigma, MY32, 1:500) and secondary antibody AlexaFluor 568 conjugated anti-mouse (Invitrogen, 1:1000). Nuclei were stained by DAPI (Sigma, 1µg/mL).
For the detection of mitochondrial shape Scr, sh1-p63 and sh2-p63 cells were incubated with Mitotracker dye (50nM, Invitrogen) together with Hoesch 33342 (1μM, Sigma-Aldrich) for nuclei staining, for 30 minutes at 37̊C.
Cell images were obtained by confocal laser microscope NIKON Eclipse Ti using EZ C.1 software (Nikon).
Seahorse flux analysis
Oxidative phosphorylation and glycolysis flux were analysed by measuring oxygen consumption rate (OCR) and lattic acid release (ECAR) by XF6 XF analyser (Seahorse Bioscience). 8x10⁴ Scr, sh1-p63 and sh2-p63 myoblast were seeded in XF 6 well-plate. Cells were washed with assay medium (DMEM 8.3 g/L, NaCl 30 mM, GlutaMax 2 mM, sodium pyruvate 1 mM, glucose 11.11 mM, phenol red, pH 7.4) and equilibrated at 37̊C (in CO2 free atmosphere). Injections of oligomycin 40 µg/ml, FCCP 50 nM, and rotenone 25 nM were set to analyse mitochondria response. Basal Respiration (BR), Maximal Respiration (MR) and Spare Respiratory Capacity (SRC) were quantified for three successive OCR measurement after each drug injection. Data collected were normalized to µg protein.
mtDNA copy number quantification
Genomic DNA extraction from Scr, sh1-p63 and sh2-p63 myoblasts was performed using Wizard genomic DNA purification kit (Promega) following manufacturer’s protocol. 10 ng of genomic DNA was used to perform mtDNA copy number evaluation by quantification of mitochondrial genes Nd5 and 12S by Real Time qPCR. SDHA nuclear gene was used for mtDNA copy number normalization. Primers used are reported in Table S2.
ATP assay and NADP+/NADPH assay
ATP was quantified by ATP Bioluminescent Somatic Cell Assay Kit (SIGMA) following manufacturer’s protocol. Light emission was measured using Lumat LB9507 luminometer (EG&GBerhtodl).
Colorimetric NADP/NADPH Assy Kit (Abcam) was used to detect NADP/NADPH ratio according to manufacturer’s protocol.
Details for all the other methods, including cell cultures, transfection, lentiviral infection, growth curve, clonogenicity assay, western blotting, RNA-extraction, RT-qPCR, whole transcriptome mRNA profiling immunofluorescence and confocal microscopy are described in Supporting Information.
Bioinformatic analysis
For gene ontology analysis, gene ontology consortium software available on-line was used (http://geneontology.org/).
Statistical analysis
Statistical analysis of grouped values was performed by T Student test. Differences with p<0.05 were considered significant.
Author Contributions
VC and AM performed the research, EC designed the research; EC, AG and GM analysed the data; EC wrote the paper and all the authors read the paper and made comments.
Acknowledgements
We thank Prof. Massimiliano Agostini and Dr Angelo Peschiaroli for scientific discussion. We thank Prof. Massimo Federici (University of Rome Tor Vergata, Rome, Italy) for Seahorse flux analyser and Illari Salvatori (Fondazione Santa Lucia, Rome, Italy) for providing C2C12 Tet/On cell line.
Conflicts of Interest
The authors declare no conflicts of interest.
Funding
This work was partially supported by Medical Research Council, UK, by grants from AIRC Grant IG-15653 to GM and partially supported by IDI-IRCCS, joint research program Italia-Cina.
References
- 1. Puri PL, Sartorelli V. Regulation of muscle regulatory factors by DNA-binding, interacting proteins, and post-transcriptional modifications. J Cell Physiol. 2000; 185:155–73. https://doi.org/10.1002/1097-4652(200011)185:2<155::AID-JCP1>3.0.CO;2-Z [PubMed]
- 2. Greschik H, Duteil D, Messaddeq N, Willmann D, Arrigoni L, Sum M, Jung M, Metzger D, Manke T, Günther T, Schüle R. The histone code reader Spin1 controls skeletal muscle development. Cell Death Dis. 2017; 8:e3173. https://doi.org/10.1038/cddis.2017.468 [PubMed]
- 3. Wei X, Li H, Yang J, Hao D, Dong D, Huang Y, Lan X, Plath M, Lei C, Lin F, Bai Y, Chen H. Circular RNA profiling reveals an abundant circLMO7 that regulates myoblasts differentiation and survival by sponging miR-378a-3p. Cell Death Dis. 2017; 8:e3153. https://doi.org/10.1038/cddis.2017.541 [PubMed]
- 4. Li G, Luo W, Abdalla BA, Ouyang H, Yu J, Hu F, Nie Q, Zhang X. miRNA-223 upregulated by MYOD inhibits myoblast proliferation by repressing IGF2 and facilitates myoblast differentiation by inhibiting ZEB1. Cell Death Dis. 2017; 8:e3094. https://doi.org/10.1038/cddis.2017.479 [PubMed]
- 5. Salsman J, Rapkin LM, Margam NN, Duncan R, Bazett-Jones DP, Dellaire G. Myogenic differentiation triggers PML nuclear body loss and DAXX relocalization to chromocentres. Cell Death Dis. 2017; 8:e2724. https://doi.org/10.1038/cddis.2017.151 [PubMed]
- 6. Zhai L, Wu R, Han W, Zhang Y, Zhu D. miR-127 enhances myogenic cell differentiation by targeting S1PR3. Cell Death Dis. 2017; 8:e2707. https://doi.org/10.1038/cddis.2017.128 [PubMed]
- 7. Lee SJ, Hwang J, Jeong HJ, Yoo M, Go GY, Lee JR, Leem YE, Park JW, Seo DW, Kim YK, Hahn MJ, Han JW, Kang JS, Bae GU. PKN2 and Cdo interact to activate AKT and promote myoblast differentiation. Cell Death Dis. 2016; 7:e2431. https://doi.org/10.1038/cddis.2016.296 [PubMed]
- 8. Tajhya RB, Hu X, Tanner MR, Huq R, Kongchan N, Neilson JR, Rodney GG, Horrigan FT, Timchenko LT, Beeton C. Functional KCa1.1 channels are crucial for regulating the proliferation, migration and differentiation of human primary skeletal myoblasts. Cell Death Dis. 2016; 7:e2426. https://doi.org/10.1038/cddis.2016.324 [PubMed]
- 9. Fiacco E, Castagnetti F, Bianconi V, Madaro L, De Bardi M, Nazio F, D’Amico A, Bertini E, Cecconi F, Puri PL, Latella L. Autophagy regulates satellite cell ability to regenerate normal and dystrophic muscles. Cell Death Differ. 2016; 23:1839–49. https://doi.org/10.1038/cdd.2016.70 [PubMed]
- 10. Fortini P, Ferretti C, Iorio E, Cagnin M, Garribba L, Pietraforte D, Falchi M, Pascucci B, Baccarini S, Morani F, Phadngam S, De Luca G, Isidoro C, Dogliotti E. The fine tuning of metabolism, autophagy and differentiation during in vitro myogenesis. Cell Death Dis. 2016; 7:e2168. https://doi.org/10.1038/cddis.2016.50 [PubMed]
- 11. Novitch BG, Mulligan GJ, Jacks T, Lassar AB. Skeletal muscle cells lacking the retinoblastoma protein display defects in muscle gene expression and accumulate in S and G2 phases of the cell cycle. J Cell Biol. 1996; 135:441–56. https://doi.org/10.1083/jcb.135.2.441 [PubMed]
- 12. Zacksenhaus E, Jiang Z, Chung D, Marth JD, Phillips RA, Gallie BL. pRb controls proliferation, differentiation, and death of skeletal muscle cells and other lineages during embryogenesis. Genes Dev. 1996; 10:3051–64. https://doi.org/10.1101/gad.10.23.3051 [PubMed]
- 13. Cam H, Griesmann H, Beitzinger M, Hofmann L, Beinoraviciute-Kellner R, Sauer M, Hüttinger-Kirchhof N, Oswald C, Friedl P, Gattenlöhner S, Burek C, Rosenwald A, Stiewe T. p53 family members in myogenic differentiation and rhabdomyosarcoma development. Cancer Cell. 2006; 10:281–93. https://doi.org/10.1016/j.ccr.2006.08.024 [PubMed]
- 14. Guo K, Wang J, Andrés V, Smith RC, Walsh K. MyoD-induced expression of p21 inhibits cyclin-dependent kinase activity upon myocyte terminal differentiation. Mol Cell Biol. 1995; 15:3823–29. https://doi.org/10.1128/MCB.15.7.3823 [PubMed]
- 15. Halevy O, Novitch BG, Spicer DB, Skapek SX, Rhee J, Hannon GJ, Beach D, Lassar AB. Correlation of terminal cell cycle arrest of skeletal muscle with induction of p21 by MyoD. Science. 1995; 267:1018–21. https://doi.org/10.1126/science.7863327 [PubMed]
- 16. Cefalù S, Lena AM, Vojtesek B, Musarò A, Rossi A, Melino G, Candi E. TAp63gamma is required for the late stages of myogenesis. Cell Cycle. 2015; 14:894–901. https://doi.org/10.4161/15384101.2014.988021 [PubMed]
- 17. Walsh K, Perlman H. Cell cycle exit upon myogenic differentiation. Curr Opin Genet Dev. 1997; 7:597–602. https://doi.org/10.1016/S0959-437X(97)80005-6 [PubMed]
- 18. Diao Y, Guo X, Jiang L, Wang G, Zhang C, Wan J, Jin Y, Wu Z. miR-203, a tumor suppressor frequently down-regulated by promoter hypermethylation in rhabdomyosarcoma. J Biol Chem. 2014; 289:529–39. https://doi.org/10.1074/jbc.M113.494716 [PubMed]
- 19. Belloni L, Moretti F, Merlo P, Damalas A, Costanzo A, Blandino G, Levrero M. DNp73α protects myogenic cells from apoptosis. Oncogene. 2006; 25:3606–12. https://doi.org/10.1038/sj.onc.1209321 [PubMed]
- 20. Vaccarello G, Figliola R, Cramerotti S, Novelli F, Maione R. p57Kip2 is induced by MyoD through a p73-dependent pathway. J Mol Biol. 2006; 356:578–88. https://doi.org/10.1016/j.jmb.2005.12.024 [PubMed]
- 21. Li CY, Zhu J, Wang JY. Ectopic expression of p73α, but not p73β, suppresses myogenic differentiation. J Biol Chem. 2005; 280:2159–64. https://doi.org/10.1074/jbc.M411194200 [PubMed]
- 22. Cai B, Ma M, Chen B, Li Z, Abdalla BA, Nie Q, Zhang X. MiR-16-5p targets SESN1 to regulate the p53 signaling pathway, affecting myoblast proliferation and apoptosis, and is involved in myoblast differentiation. Cell Death Dis. 2018; 9:367. https://doi.org/10.1038/s41419-018-0403-6 [PubMed]
- 23. Flamini V, Ghadiali RS, Antczak P, Rothwell A, Turnbull JE, Pisconti A. The Satellite Cell Niche Regulates the Balance between Myoblast Differentiation and Self-Renewal via p53. Stem Cell Reports. 2018; 10:970–83. https://doi.org/10.1016/j.stemcr.2018.01.007 [PubMed]
- 24. Harford TJ, Kliment G, Shukla GC, Weyman CM. The muscle regulatory transcription factor MyoD participates with p53 to directly increase the expression of the pro-apoptotic Bcl2 family member PUMA. Apoptosis. 2017; 22:1532–42. https://doi.org/10.1007/s10495-017-1423-x [PubMed]
- 25. Aggarwal M, Saxena R, Sinclair E, Fu Y, Jacobs A, Dyba M, Wang X, Cruz I, Berry D, Kallakury B, Mueller SC, Agostino SD, Blandino G, et al. Reactivation of mutant p53 by a dietary-related compound phenethyl isothiocyanate inhibits tumor growth. Cell Death Differ. 2016; 23:1615–27. https://doi.org/10.1038/cdd.2016.48 [PubMed]
- 26. Ghosh S, Salot S, Sengupta S, Navalkar A, Ghosh D, Jacob R, Das S, Kumar R, Jha NN, Sahay S, Mehra S, Mohite GM, Ghosh SK, et al. p53 amyloid formation leading to its loss of function: implications in cancer pathogenesis. Cell Death Differ. 2017; 24:1784–98. https://doi.org/10.1038/cdd.2017.105 [PubMed]
- 27. Alexandrova EM, Moll UM. Depleting stabilized GOF mutant p53 proteins by inhibiting molecular folding chaperones: a new promise in cancer therapy. Cell Death Differ. 2017; 24:3–5. https://doi.org/10.1038/cdd.2016.145 [PubMed]
- 28. Artigas N, Gámez B, Cubillos-Rojas M, Sánchez-de Diego C, Valer JA, Pons G, Rosa JL, Ventura F. p53 inhibits SP7/Osterix activity in the transcriptional program of osteoblast differentiation. Cell Death Differ. 2017; 24:2022–31. https://doi.org/10.1038/cdd.2017.113 [PubMed]
- 29. Van Nostrand JL, Bowen ME, Vogel H, Barna M, Attardi LD. The p53 family members have distinct roles during mammalian embryonic development. Cell Death Differ. 2017; 24:575–79. https://doi.org/10.1038/cdd.2016.128 [PubMed]
- 30. Charni M, Aloni-Grinstein R, Molchadsky A, Rotter V. p53 on the crossroad between regeneration and cancer. Cell Death Differ. 2017; 24:8–14. https://doi.org/10.1038/cdd.2016.117 [PubMed]
- 31. Belle JI, Petrov JC, Langlais D, Robert F, Cencic R, Shen S, Pelletier J, Gros P, Nijnik A. Repression of p53-target gene Bbc3/PUMA by MYSM1 is essential for the survival of hematopoietic multipotent progenitors and contributes to stem cell maintenance. Cell Death Differ. 2016; 23:759–75. https://doi.org/10.1038/cdd.2015.140 [PubMed]
- 32. Dötsch V, Bernassola F, Coutandin D, Candi E, Melino G. p63 and p73, the ancestors of p53. Cold Spring Harb Perspect Biol. 2010; 2:a004887. https://doi.org/10.1101/cshperspect.a004887 [PubMed]
- 33. Straub WE, Weber TA, Schäfer B, Candi E, Durst F, Ou HD, Rajalingam K, Melino G, Dötsch V. The C-terminus of p63 contains multiple regulatory elements with different functions. Cell Death Dis. 2010; 1:e5. https://doi.org/10.1038/cddis.2009.1 [PubMed]
- 34. Candi E, Cipollone R, Rivetti di Val Cervo P, Gonfloni S, Melino G, Knight R. p63 in epithelial development. Cell Mol Life Sci. 2008; 65:3126–33. https://doi.org/10.1007/s00018-008-8119-x [PubMed]
- 35. Vanbokhoven H, Melino G, Candi E, Declercq W. p63, a story of mice and men. J Invest Dermatol. 2011; 131:1196–207. https://doi.org/10.1038/jid.2011.84 [PubMed]
- 36. Candi E, Smirnov A, Panatta E, Lena AM, Novelli F, Mancini M, Viticchiè G, Piro MC, Di Daniele N, Annicchiarico-Petruzzelli M, Melino G. Metabolic pathways regulated by p63. Biochem Biophys Res Commun. 2017; 482:440–44. https://doi.org/10.1016/j.bbrc.2016.10.094 [PubMed]
- 37. Martin SE, Temm CJ, Goheen MP, Ulbright TM, Hattab EM. Cytoplasmic p63 immunohistochemistry is a useful marker for muscle differentiation: an immunohistochemical and immunoelectron microscopic study. Mod Pathol. 2011; 24:1320–26. https://doi.org/10.1038/modpathol.2011.89 [PubMed]
- 38. Novelli F, Lena AM, Panatta E, Nasser W, Shalom-Feuerstein R, Candi E, Melino G. Allele-specific silencing of EEC p63 mutant R304W restores p63 transcriptional activity. Cell Death Dis. 2016; 7:e2227. https://doi.org/10.1038/cddis.2016.118 [PubMed]
- 39. Di Franco S, Sala G, Todaro M. p63 role in breast cancer. Aging (Albany NY). 2016; 8:2256–57. https://doi.org/10.18632/aging.101042 [PubMed]
- 40. Xu-Monette ZY, Zhang S, Li X, Manyam GC, Wang XX, Xia Y, Visco C, Tzankov A, Zhang L, Montes-Moreno S, Dybkaer K, Chiu A, Orazi A, et al. p63 expression confers significantly better survival outcomes in high-risk diffuse large B-cell lymphoma and demonstrates p53-like and p53-independent tumor suppressor function. Aging (Albany NY). 2016; 8:345–65. https://doi.org/10.18632/aging.100898 [PubMed]
- 41. Baldelli S, Ciriolo MR. Altered S-nitrosylation of p53 is responsible for impaired antioxidant response in skeletal muscle during aging. Aging (Albany NY). 2016; 8:3450–67. https://doi.org/10.18632/aging.101139 [PubMed]
- 42. Yaffe D, Saxel O. Serial passaging and differentiation of myogenic cells isolated from dystrophic mouse muscle. Nature. 1977; 270:725–27. https://doi.org/10.1038/270725a0 [PubMed]
- 43. Smirnov A, Panatta E, Lena A, Castiglia D, Di Daniele N, Melino G, Candi E. FOXM1 regulates proliferation, senescence and oxidative stress in keratinocytes and cancer cells. Aging (Albany NY). 2016; 8:1384–97. https://doi.org/10.18632/aging.100988 [PubMed]
- 44. Viticchiè G, Agostini M, Lena AM, Mancini M, Zhou H, Zolla L, Dinsdale D, Saintigny G, Melino G, Candi E. p63 supports aerobic respiration through hexokinase II. Proc Natl Acad Sci USA. 2015; 112:11577–82. https://doi.org/10.1073/pnas.1508871112 [PubMed]
- 45. Latina A, Viticchiè G, Lena AM, Piro MC, Annicchiarico-Petruzzelli M, Melino G, Candi E. ΔNp63 targets cytoglobin to inhibit oxidative stress-induced apoptosis in keratinocytes and lung cancer. Oncogene. 2016; 35:1493–503. https://doi.org/10.1038/onc.2015.222 [PubMed]
- 46. Agostini M, Romeo F, Inoue S, Niklison-Chirou MV, Elia AJ, Dinsdale D, Morone N, Knight RA, Mak TW, Melino G. Metabolic reprogramming during neuronal differentiation. Cell Death Differ. 2016; 23:1502–14. https://doi.org/10.1038/cdd.2016.36 [PubMed]
- 47. Giacomello M, Pellegrini L. The coming of age of the mitochondria-ER contact: a matter of thickness. Cell Death Differ. 2016; 23:1417–27. https://doi.org/10.1038/cdd.2016.52 [PubMed]
- 48. Kagan VE, Jiang J, Huang Z, Tyurina YY, Desbourdes C, Cottet-Rousselle C, Dar HH, Verma M, Tyurin VA, Kapralov AA, Cheikhi A, Mao G, Stolz D, et al. NDPK-D (NM23-H4)-mediated externalization of cardiolipin enables elimination of depolarized mitochondria by mitophagy. Cell Death Differ. 2016; 23:1140–51. https://doi.org/10.1038/cdd.2015.160 [PubMed]
- 49. Gross A, Zaltsman Y, Maryanovich M. The ATM-BID pathway plays a critical role in the DNA damage response by regulating mitochondria metabolism. Cell Death Differ. 2016; 23:182. https://doi.org/10.1038/cdd.2015.154 [PubMed]
- 50. Zhao J, Yin M, Deng H, Jin FQ, Xu S, Lu Y, Mastrangelo MA, Luo H, Jin ZG. Cardiac Gab1 deletion leads to dilated cardiomyopathy associated with mitochondrial damage and cardiomyocyte apoptosis. Cell Death Differ. 2016; 23:695–706. https://doi.org/10.1038/cdd.2015.143 [PubMed]
- 51. Tóth B, Garabuczi E, Sarang Z, Vereb G, Vámosi G, Aeschlimann D, Blaskó B, Bécsi B, Erdõdi F, Lacy-Hulbert A, Zhang A, Falasca L, Birge RB, et al. Transglutaminase 2 is needed for the formation of an efficient phagocyte portal in macrophages engulfing apoptotic cells. J Immunol. 2009; 182:2084–92. https://doi.org/10.4049/jimmunol.0803444 [PubMed]
- 52. Lovat PE, Ranalli M, Annichiarrico-Petruzzelli M, Bernassola F, Piacentini M, Malcolm AJ, Pearson AD, Melino G, Redfern CP. Effector mechanisms of fenretinide-induced apoptosis in neuroblastoma. Exp Cell Res. 2000; 260:50–60. https://doi.org/10.1006/excr.2000.4988 [PubMed]
- 53. Galluzzi L, Vitale I, Aaronson SA, Abrams JM, Adam D, Agostinis P, Alnemri ES, Altucci L, Amelio I, Andrews DW, Annicchiarico-Petruzzelli M, Antonov AV, Arama E, et al. Molecular mechanisms of cell death: recommendations of the Nomenclature Committee on Cell Death 2018. Cell Death Differ. 2018; 25:486–541. https://doi.org/10.1038/s41418-017-0012-4 [PubMed]
- 54. Gottlieb E, Vousden KH. p53 regulation of metabolic pathways. Cold Spring Harb Perspect Biol. 2010; 2:a001040. https://doi.org/10.1101/cshperspect.a001040 [PubMed]
- 55. Rufini A, Niklison-Chirou MV, Inoue S, Tomasini R, Harris IS, Marino A, Federici M, Dinsdale D, Knight RA, Melino G, Mak TW. TAp73 depletion accelerates aging through metabolic dysregulation. Genes Dev. 2012; 26:2009–14. https://doi.org/10.1101/gad.197640.112 [PubMed]
- 56. Kuro-O M. Molecular Mechanisms Underlying Accelerated Aging by Defects in the FGF23-Klotho System. Int J Nephrol. 2018; 2018:9679841. https://doi.org/10.1155/2018/9679841 [PubMed]
- 57. Gan L, Cookson MR, Petrucelli L, La Spada AR. Converging pathways in neurodegeneration, from genetics to mechanisms. Nat Neurosci. 2018; 21:1300–09. https://doi.org/10.1038/s41593-018-0237-7 [PubMed]
- 58. Newcombe EA, Camats-Perna J, Silva ML, Valmas N, Huat TJ, Medeiros R. Inflammation: the link between comorbidities, genetics, and Alzheimer’s disease. J Neuroinflammation. 2018; 15:276. https://doi.org/10.1186/s12974-018-1313-3 [PubMed]
- 59. Ticinesi A, Tana C, Nouvenne A, Prati B, Lauretani F, Meschi T. Gut microbiota, cognitive frailty and dementia in older individuals: a systematic review. Clin Interv Aging. 2018; 13:1497–511. https://doi.org/10.2147/CIA.S139163 [PubMed]
- 60. Jęśko H, Stępień A, Lukiw WJ, Strosznajder RP. The Cross-Talk Between Sphingolipids and Insulin-Like Growth Factor Signaling: Significance for Aging and Neurodegeneration. Mol Neurobiol. 2018. https://doi.org/10.1007/s12035-018-1286-3 [PubMed]
- 61. Nagpal R, Mainali R, Ahmadi S, Wang S, Singh R, Kavanagh K, Kitzman DW, Kushugulova A, Marotta F, Yadav H. Gut microbiome and aging: physiological and mechanistic insights. Nutr Healthy Aging. 2018; 4:267–85. https://doi.org/10.3233/NHA-170030 [PubMed]
- 62. Baraibar MA, Hyzewicz J, Rogowska-Wrzesinska A, Bulteau AL, Prip-Buus C, Butler-Browne G, Friguet B. Impaired energy metabolism of senescent muscle satellite cells is associated with oxidative modifications of glycolytic enzymes. Aging (Albany NY). 2016; 8:3375–89. https://doi.org/10.18632/aging.101126 [PubMed]
- 63. Brzeszczyńska J, Johns N, Schilb A, Degen S, Degen M, Langen R, Schols A, Glass DJ, Roubenoff R, Greig CA, Jacobi C, Fearon KC, Ross JA. Loss of oxidative defense and potential blockade of satellite cell maturation in the skeletal muscle of patients with cancer but not in the healthy elderly. Aging (Albany NY). 2016; 8:1690–702. https://doi.org/10.18632/aging.101006 [PubMed]
- 64. Shao AW, Sun H, Geng Y, Peng Q, Wang P, Chen J, Xiong T, Cao R, Tang J. Bclaf1 is an important NF-κB signaling transducer and C/EBPβ regulator in DNA damage-induced senescence. Cell Death Differ. 2016; 23:865–75. https://doi.org/10.1038/cdd.2015.150 [PubMed]
- 65. Pihán P, Carreras-Sureda A, Hetz C. BCL-2 family: integrating stress responses at the ER to control cell demise. Cell Death Differ. 2017; 24:1478–87. https://doi.org/10.1038/cdd.2017.82 [PubMed]
- 66. Oh J, Sinha I, Tan KY, Rosner B, Dreyfuss JM, Gjata O, Tran P, Shoelson SE, Wagers AJ. Age-associated NF-κB signaling in myofibers alters the satellite cell niche and re-strains muscle stem cell function. Aging (Albany NY). 2016; 8:2871–96. https://doi.org/10.18632/aging.101098 [PubMed]
- 67. Choi JY, Hwang CY, Lee B, Lee SM, Bahn YJ, Lee KP, Kang M, Kim YS, Woo SH, Lim JY, Kim E, Kwon KS. Age-associated repression of type 1 inositol 1, 4, 5-triphosphate receptor impairs muscle regeneration. Aging (Albany NY). 2016; 8:2062–80. https://doi.org/10.18632/aging.101039 [PubMed]
- 68. Itahana Y, Itahana K. Emerging roles of p53 family members in glucose metabolism. Int J Mol Sci. 2018; 19:E776. https://doi.org/10.3390/ijms19030776 [PubMed]
- 69. Flores ER, Lozano G. The p53 family grows old. Genes Dev. 2012; 26:1997–2000. https://doi.org/10.1101/gad.202648.112 [PubMed]
- 70. Nicolai S, Rossi A, Di Daniele N, Melino G, Annicchiarico-Petruzzelli M, Raschellà G. DNA repair and aging: the impact of the p53 family. Aging (Albany NY). 2015; 7:1050–65. https://doi.org/10.18632/aging.100858 [PubMed]
- 71. Labuschagne CF, Zani F, Vousden KH. Control of metabolism by p53 – Cancer and beyond. Biochimica et Biophysica Acta - Reviews on Cancer. 2018. p. 32–42.
- 72. Bourgeois B, Madl T. Regulation of cellular senescence via the FOXO4-p53 axis. FEBS Lett. 2018; 592:2083–97. https://doi.org/10.1002/1873-3468.13057 [PubMed]
- 73. Marini A, Rotblat B, Sbarrato T, Niklison-Chirou MV, Knight JR, Dudek K, Jones C, Bushell M, Knight RA, Amelio I, Willis AE, Melino G. TAp73 contributes to the oxidative stress response by regulating protein synthesis. Proc Natl Acad Sci USA. 2018; 115:6219–24. https://doi.org/10.1073/pnas.1718531115 [PubMed]
- 74. Flores ER, Sengupta S, Miller JB, Newman JJ, Bronson R, Crowley D, Yang A, McKeon F, Jacks T. Tumor predisposition in mice mutant for p63 and p73: evidence for broader tumor suppressor functions for the p53 family. Cancer Cell. 2005; 7:363–73. https://doi.org/10.1016/j.ccr.2005.02.019 [PubMed]
- 75. Guo X, Keyes WM, Papazoglu C, Zuber J, Li W, Lowe SW, Vogel H, Mills AA. TAp63 induces senescence and suppresses tumorigenesis in vivo. Nat Cell Biol. 2009; 11:1451–57. https://doi.org/10.1038/ncb1988 [PubMed]
- 76. De Laurenzi V, Melino G. Evolution of functions within the p53/p63/p73 family. Ann N Y Acad Sci. 2000; 926:90–100. https://doi.org/10.1111/j.1749-6632.2000.tb05602.x [PubMed]
- 77. Matin RN, Chikh A, Chong SL, Mesher D, Graf M, Sanza’ P, Senatore V, Scatolini M, Moretti F, Leigh IM, Proby CM, Costanzo A, Chiorino G, et al. p63 is an alternative p53 repressor in melanoma that confers chemoresistance and a poor prognosis. J Exp Med. 2013; 210:581–603. https://doi.org/10.1084/jem.20121439 [PubMed]
- 78. Amelio I, Knight RA, Lisitsa A, Melino G, Antonov AV. p53MutaGene: an online tool to estimate the effect of p53 mutational status on gene regulation in cancer. Cell Death Dis. 2016; 7:e2148. https://doi.org/10.1038/cddis.2016.42 [PubMed]
- 79. Seitz SJ, Schleithoff ES, Koch A, Schuster A, Teufel A, Staib F, Stremmel W, Melino G, Krammer PH, Schilling T, Müller M. Chemotherapy-induced apoptosis in hepatocellular carcinoma involves the p53 family and is mediated via the extrinsic and the intrinsic pathway. Int J Cancer. 2010; 126:2049–66. [PubMed]
- 80. Martin-Lopez M, Maeso-Alonso L, Fuertes-Alvarez S, Balboa D, Rodríguez-Cortez V, Weltner J, Diez-Prieto I, Davis A, Wu Y, Otonkoski T, Flores ER, Menéndez P, Marques MM, Marin MC. p73 is required for appropriate BMP-induced mesenchymal-to-epithelial transition during somatic cell reprogramming. Cell Death Dis. 2017; 8:e3034. https://doi.org/10.1038/cddis.2017.432 [PubMed]
- 81. Candi E, Terrinoni A, Rufini A, Chikh A, Lena AM, Suzuki Y, Sayan BS, Knight RA, Melino G. p63 is upstream of IKK alpha in epidermal development. J Cell Sci. 2006; 119:4617–22. https://doi.org/10.1242/jcs.03265 [PubMed]
- 82. Candi E, Schmidt R, Melino G. The cornified envelope: a model of cell death in the skin. Nat Rev Mol Cell Biol. 2005; 6:328–40. https://doi.org/10.1038/nrm1619 [PubMed]
- 83. Regina C, Compagnone M, Peschiaroli A, Lena AM, Melino G, Candi E. ΔNp63α modulates histone methyl transferase SETDB1 to transcriptionally repress target genes in cancers. Cell Death Discov. 2016; 2:16015. https://doi.org/10.1038/cddiscovery.2016.15 [PubMed]
- 84. Gressner O, Schilling T, Lorenz K, Schulze Schleithoff E, Koch A, Schulze-Bergkamen H, Lena AM, Candi E, Terrinoni A, Catani MV, Oren M, Melino G, Krammer PH, et al. TAp63α induces apoptosis by activating signaling via death receptors and mitochondria. EMBO J. 2005; 24:2458–71. https://doi.org/10.1038/sj.emboj.7600708 [PubMed]
- 85. Rivetti di Val Cervo P, Lena AM, Nicoloso M, Rossi S, Mancini M, Zhou H, Saintigny G, Dellambra E, Odorisio T, Mahé C, Calin GA, Candi E, Melino G. p63-microRNA feedback in keratinocyte senescence. Proc Natl Acad Sci USA. 2012; 109:1133–38. https://doi.org/10.1073/pnas.1112257109 [PubMed]
- 86. Memmi EM, Sanarico AG, Giacobbe A, Peschiaroli A, Frezza V, Cicalese A, Pisati F, Tosoni D, Zhou H, Tonon G, Antonov A, Melino G, Pelicci PG, Bernassola F. p63 Sustains self-renewal of mammary cancer stem cells through regulation of Sonic Hedgehog signaling. Proc Natl Acad Sci USA. 2015; 112:3499–504. https://doi.org/10.1073/pnas.1500762112 [PubMed]
- 87. Compagnone M, Gatti V, Presutti D, Ruberti G, Fierro C, Markert EK, Vousden KH, Zhou H, Mauriello A, Anemone L, Bongiorno-Borbone L, Melino G, Peschiaroli A. ΔNp63-mediated regulation of hyaluronic acid metabolism and signaling supports HNSCC tumorigenesis. Proc Natl Acad Sci USA. 2017; 114:13254–59. https://doi.org/10.1073/pnas.1711777114 [PubMed]
- 88. Kanemaru K, Nakamura Y, Totoki K, Fukuyama T, Shoji M, Kaneko H, Shiratori K, Yoneda A, Inoue T, Iwakura Y, Kabashima K, Fukami K. Phospholipase Cδ1 regulates p38 MAPK activity and skin barrier integrity. Cell Death Differ. 2017; 24:1079–90. https://doi.org/10.1038/cdd.2017.56 [PubMed]
- 89. Palazzo E, Kellett MD, Cataisson C, Bible PW, Bhattacharya S, Sun HW, Gormley AC, Yuspa SH, Morasso MI. A novel DLX3-PKC integrated signaling network drives keratinocyte differentiation. Cell Death Differ. 2017; 24:717–30. https://doi.org/10.1038/cdd.2017.5 [PubMed]
- 90. Rizzo JM, Oyelakin A, Min S, Smalley K, Bard J, Luo W, Nyquist J, Guttman-Yassky E, Yoshida T, De Benedetto A, Beck LA, Sinha S, Romano RA. ΔNp63 regulates IL-33 and IL-31 signaling in atopic dermatitis. Cell Death Differ. 2016; 23:1073–85. https://doi.org/10.1038/cdd.2015.162 [PubMed]
- 91. Messemaker TC, Mikkers HM, Huizinga TW, Toes RE, van der Helm-van Mil AH, Kurreeman F. Inflammatory genes TNFα and IL6 display no signs of increased H3K4me3 in circulating monocytes from untreated rheumatoid arthritis patients. Genes Immun. 2017; 18:191–96. https://doi.org/10.1038/gene.2017.20 [PubMed]
- 92. Lareau CA, DeWeese CF, Adrianto I, Lessard CJ, Gaffney PM, Iannuzzi MC, Rybicki BA, Levin AM, Montgomery CG. Polygenic risk assessment reveals pleiotropy between sarcoidosis and inflammatory disorders in the context of genetic ancestry. Genes Immun. 2017; 18:88–94. https://doi.org/10.1038/gene.2017.3 [PubMed]
- 93. Hussman JP, Beecham AH, Schmidt M, Martin ER, McCauley JL, Vance JM, Haines JL, Pericak-Vance MA. GWAS analysis implicates NF-κB-mediated induction of inflammatory T cells in multiple sclerosis. Genes Immun. 2016; 17:305–12. https://doi.org/10.1038/gene.2016.23 [PubMed]
- 94. Ng GZ, Sutton P. The MUC1 mucin specifically inhibits activation of the NLRP3 inflammasome. Genes Immun. 2016; 17:203–06. https://doi.org/10.1038/gene.2016.10 [PubMed]
- 95. Nikolic T, Woittiez NJ, van der Slik A, Laban S, Joosten A, Gysemans C, Mathieu C, Zwaginga JJ, Koeleman B, Roep BO. Differential transcriptome of tolerogenic versus inflammatory dendritic cells points to modulated T1D genetic risk and enriched immune regulation. Genes Immun. 2017; 18:176–83. https://doi.org/10.1038/gene.2017.18 [PubMed]
- 96. Liu S, Hou XL, Sui WG, Lu QJ, Hu YL, Dai Y. Direct measurement of B-cell receptor repertoire’s composition and variation in systemic lupus erythematosus. Genes Immun. 2017; 18:22–27. https://doi.org/10.1038/gene.2016.45 [PubMed]
- 97. Xu Z, Xu J, Ju J, Morel L. A Skint6 allele potentially contributes to mouse lupus. Genes Immun. 2017; 18:111–17. https://doi.org/10.1038/gene.2017.8 [PubMed]
- 98. Gianfrancesco MA, Balzer L, Taylor KE, Trupin L, Nititham J, Seldin MF, Singer AW, Criswell LA, Barcellos LF. Genetic risk and longitudinal disease activity in systemic lupus erythematosus using targeted maximum likelihood estimation. Genes Immun. 2016; 17:358–62. https://doi.org/10.1038/gene.2016.33 [PubMed]
- 99. Dey-Rao R, Sinha AA. Interactome analysis of gene expression profile reveals potential novel key transcriptional regulators of skin pathology in vitiligo. Genes Immun. 2016; 17:30–45. https://doi.org/10.1038/gene.2015.48 [PubMed]
- 100. Ohkusu-Tsukada K, Yamashita T, Tsukada T, Takahashi K. Low expression of a Ddm7/Ldm7-hybrid mutant (D/Ldm7) in the novel haplotype H-2nc identified in atopic dermatitis model NC/Nga mice. Genes Immun. 2017. https://doi.org/10.1038/s41435-017-0003-y [PubMed]
- 101. Li Y, Cheng H, Xiao FL, Liang B, Zhou FS, Li P, Zheng XD, Sun LD, Yang S, Zhang XJ. Association of UBASH3A gene polymorphism and atopic dermatitis in the Chinese Han population. Genes Immun. 2017; 18:158–62. https://doi.org/10.1038/gene.2017.15 [PubMed]
- 102. Knupp J, Martinez-Montañés F, Van Den Bergh F, Cottier S, Schneiter R, Beard D, Chang A. Sphingolipid accumulation causes mitochondrial dysregulation and cell death. Cell Death Differ. 2017; 24:2044–53. https://doi.org/10.1038/cdd.2017.128 [PubMed]
- 103. Park HA, Licznerski P, Mnatsakanyan N, Niu Y, Sacchetti S, Wu J, Polster BM, Alavian KN, Jonas EA. Inhibition of Bcl-xL prevents pro-death actions of ΔN-Bcl-xL at the mitochondrial inner membrane during glutamate excitotoxicity. Cell Death Differ. 2017; 24:1963–74. https://doi.org/10.1038/cdd.2017.123 [PubMed]
- 104. Kaufman DM, Wu X, Scott BA, Itani OA, Van Gilst MR, Bruce JE, Crowder CM. Ageing and hypoxia cause protein aggregation in mitochondria. Cell Death Differ. 2017; 24:1730–38. https://doi.org/10.1038/cdd.2017.101 [PubMed]
- 105. Chiusolo V, Jacquemin G, Yonca Bassoy E, Vinet L, Liguori L, Walch M, Kozjak-Pavlovic V, Martinvalet D. Granzyme B enters the mitochondria in a Sam50-, Tim22- and mtHsp70-dependent manner to induce apoptosis. Cell Death Differ. 2017; 24:747–58. https://doi.org/10.1038/cdd.2017.3 [PubMed]
- 106. Honrath B, Matschke L, Meyer T, Magerhans L, Perocchi F, Ganjam GK, Zischka H, Krasel C, Gerding A, Bakker BM, Bünemann M, Strack S, Decher N, et al. SK2 channels regulate mitochondrial respiration and mitochondrial Ca2+ uptake. Cell Death Differ. 2017; 24:761–73. https://doi.org/10.1038/cdd.2017.2 [PubMed]
- 107. Vila MC, Rayavarapu S, Hogarth MW, Van der Meulen JH, Horn A, Defour A, Takeda S, Brown KJ, Hathout Y, Nagaraju K, Jaiswal JK. Mitochondria mediate cell membrane repair and contribute to Duchenne muscular dystrophy. Cell Death Differ. 2017; 24:330–42. https://doi.org/10.1038/cdd.2016.127 [PubMed]
- 108. Herzberg NH, Middelkoop E, Adorf M, Dekker HL, Van Galen MJ, Van den Berg M, Bolhuis PA, Van den Bogert C. Mitochondria in cultured human muscle cells depleted of mitochondrial DNA. Eur J Cell Biol. 1993; 61:400–08. [PubMed]
- 109. Hamai N, Nakamura M, Asano A. Inhibition of mitochondrial protein synthesis impaired C2C12 myoblast differentiation. Cell Struct Funct. 1997; 22:421–31. https://doi.org/10.1247/csf.22.421 [PubMed]
- 110. Rochard P, Rodier A, Casas F, Cassar-Malek I, Marchal-Victorion S, Daury L, Wrutniak C, Cabello G. Mitochondrial activity is involved in the regulation of myoblast differentiation through myogenin expression and activity of myogenic factors. J Biol Chem. 2000; 275:2733–44. https://doi.org/10.1074/jbc.275.4.2733 [PubMed]
- 111. Seyer P, Grandemange S, Busson M, Carazo A, Gamaléri F, Pessemesse L, Casas F, Cabello G, Wrutniak-Cabello C. Mitochondrial activity regulates myoblast differentiation by control of c-Myc expression. J Cell Physiol. 2006; 207:75–86. https://doi.org/10.1002/jcp.20539 [PubMed]
- 112. Seyer P, Grandemange S, Rochard P, Busson M, Pessemesse L, Casas F, Cabello G, Wrutniak-Cabello C. P43-dependent mitochondrial activity regulates myoblast differentiation and slow myosin isoform expression by control of Calcineurin expression. Exp Cell Res. 2011; 317:2059–71. https://doi.org/10.1016/j.yexcr.2011.05.020 [PubMed]
- 113. Wagatsuma A, Sakuma K. Mitochondria as a potential regulator of myogenesis. Sci World J. 2013; 2013:593267. https://doi.org/10.1155/2013/593267 [PubMed]
- 114. Herzberg NH, Zwart R, Wolterman RA, Ruiter JP, Wanders RJ, Bolhuis PA, van den Bogert C. Differentiation and proliferation of respiration-deficient human myoblasts. Biochim Biophys Acta. 1993; 1181:63–67. https://doi.org/10.1016/0925-4439(93)90091-E [PubMed]
- 115. Duguez S, Sabido O, Freyssenet D. Mitochondrial-dependent regulation of myoblast proliferation. Exp Cell Res. 2004; 299:27–35. https://doi.org/10.1016/j.yexcr.2004.05.017 [PubMed]
- 116. Jahnke VE, Sabido O, Defour A, Castells J, Lefai E, Roussel D, Freyssenet D. Evidence for mitochondrial respiratory deficiency in rat rhabdomyosarcoma cells. PLoS One. 2010; 5:e8637. https://doi.org/10.1371/journal.pone.0008637 [PubMed]
- 117. Merlino G, Helman LJ. Rhabdomyosarcoma--working out the pathways. Oncogene. 1999; 18:5340–48. https://doi.org/10.1038/sj.onc.1203038 [PubMed]
- 118. Kuhnt T, Pelz T, Qu X, Hänsgen G, Dunst J, Gellerich FN. Mitochondrial OXPHOS functions in R1H rhabdomyosarcoma and skeletal muscles of the rat. Neurochem Res. 2007; 32:973–80. https://doi.org/10.1007/s11064-006-9254-0 [PubMed]
- 119. Korenke GC, Bentlage HA, Ruitenbeek W, Sengers RC, Sperl W, Trijbels JM, Gabreels FJ, Wijburg FA, Wiedermann V, Hanefeld F, Wendel U, Reckmann M, Griebel V, Wölk H. Isolated and combined deficiencies of NADH dehydrogenase (complex I) in muscle tissue of children with mitochondrial myopathies. Eur J Pediatr. 1990; 150:104–08. https://doi.org/10.1007/BF02072049 [PubMed]
- 120. van Straaten HL, van Tintelen JP, Trijbels JM, van den Heuvel LP, Troost D, Rozemuller JM, Duran M, de Vries LS, Schuelke M, Barth PG. Neonatal lactic acidosis, complex I/IV deficiency, and fetal cerebral disruption. Neuropediatrics. 2005; 36:193–99. https://doi.org/10.1055/s-2005-865713 [PubMed]
- 121. Jongpiputvanich S, Sueblinvong T, Norapucsunton T. Mitochondrial respiratory chain dysfunction in various neuromuscular diseases. J Clin Neurosci. 2005; 12:426–28. https://doi.org/10.1016/j.jocn.2004.06.014 [PubMed]
- 122. Moulin M, Ferreiro A. Muscle redox disturbances and oxidative stress as pathomechanisms and therapeutic targets in early-onset myopathies. Semin Cell Dev Biol. 2017; 64:213–23. https://doi.org/10.1016/j.semcdb.2016.08.003 [PubMed]
- 123. Ling H, Vincent K, Pichler M, Fodde R, Berindan-Neagoe I, Slack FJ, Calin GA. Junk DNA and the long non-coding RNA twist in cancer genetics. Oncogene. 2015; 34:5003–11. https://doi.org/10.1038/onc.2014.456 [PubMed]
- 124. Rybalka E, Timpani CA, Cooke MB, Williams AD, Hayes A. Defects in mitochondrial ATP synthesis in dystrophin-deficient mdx skeletal muscles may be caused by complex I insufficiency. PLoS One. 2014; 9:e115763. https://doi.org/10.1371/journal.pone.0115763 [PubMed]
- 125. Lang A, Anand R, Altinoluk-Hambüchen S, Ezzahoini H, Stefanski A, Iram A, Bergmann L, Urbach J, Böhler P, Hänsel J, Franke M, Stühler K, Krutmann J, et al. SIRT4 interacts with OPA1 and regulates mitochondrial quality control and mitophagy. Aging (Albany NY). 2017; 9:2163–89. https://doi.org/10.18632/aging.101307 [PubMed]
- 126. Lalia AZ, Dasari S, Robinson MM, Abid H, Morse DM, Klaus KA, Lanza IR. Influence of omega-3 fatty acids on skeletal muscle protein metabolism and mitochondrial bioenergetics in older adults. Aging (Albany NY). 2017; 9:1096–129. https://doi.org/10.18632/aging.101210 [PubMed]
- 127. Uzhachenko R, Boyd K, Olivares-Villagomez D, Zhu Y, Goodwin JS, Rana T, Shanker A, Tan WJ, Bondar T, Medzhitov R, Ivanova AV. Mitochondrial protein Fus1/Tusc2 in premature aging and age-related pathologies: critical roles of calcium and energy homeostasis. Aging (Albany NY). 2017; 9:627–49. https://doi.org/10.18632/aging.101213 [PubMed]
- 128. Pollard AK, Ortori CA, Stöger R, Barrett DA, Chakrabarti L. Mouse mitochondrial lipid composition is defined by age in brain and muscle. Aging (Albany NY). 2017; 9:986–98. https://doi.org/10.18632/aging.101204 [PubMed]
- 129. Stoll EA, Karapavlovic N, Rosa H, Woodmass M, Rygiel K, White K, Turnbull DM, Faulkes CG. Naked mole-rats maintain healthy skeletal muscle and Complex IV mitochondrial enzyme function into old age. Aging (Albany NY). 2016; 8:3468–85. https://doi.org/10.18632/aging.101140 [PubMed]
- 130. Ingram T, Chakrabarti L. Proteomic profiling of mitochondria: what does it tell us about the ageing brain? Aging (Albany NY). 2016; 8:3161–79. https://doi.org/10.18632/aging.101131 [PubMed]
- 131. Kaestner L, Minetti G. The potential of erythrocytes as cellular aging models. Cell Death Differ. 2017; 24:1475–77. https://doi.org/10.1038/cdd.2017.100 [PubMed]
- 132. Pinto M, Pickrell AM, Wang X, Bacman SR, Yu A, Hida A, Dillon LM, Morton PD, Malek TR, Williams SL, Moraes CT. Transient mitochondrial DNA double strand breaks in mice cause accelerated aging phenotypes in a ROS-dependent but p53/p21-independent manner. Cell Death Differ. 2017; 24:288–99. https://doi.org/10.1038/cdd.2016.123 [PubMed]
- 133. Qi Y, Liu H, Daniels MP, Zhang G, Xu H. Loss of Drosophila i-AAA protease, dYME1L, causes abnormal mitochondria and apoptotic degeneration. Cell Death Differ. 2016; 23:291–302. https://doi.org/10.1038/cdd.2015.94 [PubMed]