


Introduction
Aging-related diseases have surpassed infectious diseases as the main cause of premature death in developed countries. Cancer, diabetes, cardiovascular diseases (CVD), Alzheimer’s (AD), Parkinson’s (PD) and other neurodegenerative diseases (NDs) are the most common aging-related pathologies. The incidence of these diseases increases rapidly with age, leading to morbidity and very often death [1]. These diseases have a highly negative economic impact on patients, their families, and society. Numerous data have demonstrated that the clinical manifestation of aging-associated diseases is preceded by prolonged (10-20 years) asymptomatic periods of pathological development [2–5]. Thus, a better understanding of the underlying processes of aging could clarify the nature of triggers involved in the initiation of these processes and the early stages of development. Despite the significant efforts made in recent years that focused on elucidating the mechanisms of aging-related disease progression, much more work is needed to develop effective assays for early detection and treatment of these diseases. Furthermore, successful treatment of one disease does not necessarily lead to significant gains in life span [6–8] because patients can die from other pathologies. As a result, a popular emerging concept is that focusing on the development of drugs targeting aging early and at its core may be more beneficial than treatment of particular diseases [9,10].
Aging has been described as “the time-dependent decline of functional capacity and stress resistance, associated with increased risk of morbidity and mortality” [11]. The data regarding the increase in longevity of various species via low-calorie diets and modulation of the IGF, sirtuin, mTOR and other pathways, as well as recent results from studies of parabiosis, indicate that a significant delay in aging is possible in principle [12,13]. Critical for developing and testing approaches to sustaining healthy living and delaying aging is the development and validation of minimally invasive, cost-effective biomarkers of aging. In addition, a quantitative definition of biomarker ranges that are characteristic of normal aging is also important for early detection of aging-related diseases. For example, synapse dysfunction and loss, ultimately followed by neuronal death, accompany normal aging [14–16]. However, rapid progression of these processes in a particular brain region could be an early indication of a neurodegenerative disease affecting this region. The same is true for other organs and tissues.
The American Federation for Aging Research [17] and the European MARK-AGE Consortium [11] have proposed several criteria for a successful biomarker of aging: (1) it must predict the rate of aging and assess where a person is in his/her lifespan better than the person’s chronological age; (2) an assay for measuring such a biomarker should be minimally invasive; and (3) the biomarker should be useful in animal models, as well as in humans, since preliminary testing of essentially all drug candidates and many therapeutic regimens is performed in non-human subjects. Traditional biomarkers of aging are based on evaluations of an individual’s general physical status, function and health of various organ systems (cardiovascular, pulmonary), cognitive function, etc. The potentially promising biomarkers of aging, which are currently being investigated, can be divided into several general groups [11–13]: (1) genetic biomarkers, including the length of telomeres in lymphocytes and other cells, age-related epigenetic changes mainly in DNA methylation, and changes in mitochondrial DNA; (2) protein-based biomarkers, including markers based on protein glycation and levels of metal-binding proteins; (3) metabolic parameters, such as hormones, lipids, and creatinine; (4) immunological and inflammatory markers, including concentrations of immunoglobulins, cytokines, and C-reactive protein in the bloodstream; (5) markers of oxidative stress; and (6) imaging biomarkers capable of registering aging-associated brain changes. To date, there is no biomarker that satisfies the three criteria listed above; some biomarker candidates are not optimal for broad clinical use because they are highly variable, invasive, laborious and/or expensive or they cannot be used in animal models.
In the current study, we assessed whether aging-associated processes in various brain regions can be detected in vitro via quantitative analysis of circulating brain-enriched miRNAs detectable in the bloodstream. miRNAs play important roles in the regulation of target genes by binding to complementary regions of messenger transcripts and repressing their translation or by regulating degradation [18,19]. Over 2000 miRNAs have been discovered in human cells to date, and many of these miRNAs are specific to or are overexpressed in certain organs/tissues/cells [20–23]. Some miRNAs, including those that are cell-specific, are enriched in certain cellular compartments, for example, in neurites and synapses [21–28]. Intracellular concentrations and rates of secretion of miRNAs can be dramatically affected by physiological and pathological cellular processes [29–31]. The presence of miRNAs from various organs and cell types in the blood is well documented [32–35]. Because these cell-free, circulating miRNAs can be organ-specific and are relatively stable in the blood, they are attractive biomarker candidates for various physiological and pathological processes. miRNAs appear in extracellular space and in bodily fluids due to a variety of mechanisms that remain not fully understood; these mechanisms include secretion, excretion, and blebbing [36–38]. Our studies that have been performed to date suggested that various processes, such as cell dysfunction and neurite/synapse loss, can lead to changes in miRNA concentrations in plasma, representing a rich source of potential biomarkers that detect pathology in the corresponding organ [39–44]. In addition, many publications have demonstrated that miRNA secretion, circulation in bodily fluids, and uptake by other cells are relatively common mechanisms of cell-to-cell communication, particularly in carcinogenesis, metastasis formation and other processes [45–49]. Recently, it was also demonstrated that stem cells of the hypothalamus secrete miRNAs that are transported to the CSF and potentially reach the bloodstream [50]. These miRNAs play an important role in aging-related processes. In this study, we pursue a targeted approach based on quantitative RT-PCR (qRT-PCR) analysis of a relatively small number of pre-selected miRNAs that are (1) enriched in different brain regions and (2) are present at detectable levels in plasma [21,22,51–57]. In addition, we used a miRNA-pair approach [39–44,58–61]. The concentration ratios of all miRNA pairs from the same sample were calculated, and the most promising pairs for effective differentiation of two populations or correlation with the parameter of interest, e.g. age, were selected for further testing and validation. This approach has proven to be particularly effective in the analysis of plasma concentrations of brain-enriched miRNAs to compensate not only for technical variability but also for physiological variability, e.g. changes in blood supply or blood-brain barrier permeability. Subject-to-subject variability is further decreased if a miRNA biomarker pair is comprised of two miRNAs, the plasma concentrations of which are highly correlated [39].
In this study, we evaluated the age- and sex-dependence of plasma concentrations of miRNAs enriched in different brain regions.
Results
The study was conducted in two stages. In the first set of experiments, the concentrations of 38 miRNAs (see Table 1) were measured by qRT-PCR in plasma samples from two groups of subjects: 26-35-year-olds (“young”) and 56-65-year-olds (“old”). The pre-selected set of miRNAs included brain-enriched miRNAs identified in our previous studies as potential biomarkers of neurodegenerative diseases [39,40,42] and additional miRNAs that are (i) enriched in different brain regions, neurons and glial cells, and (ii) reported in the literature and/or determined in our previous studies to be detectable in plasma. In this experiment we found miR-149, miR-154, miR-184, miR-369-3p, and miR-129-3p to be barely detectable and, hence, excluded these miRNAs from the analysis. The Cts for miR-204, miR-212, and miR-96 in many samples were higher than 36; although these data were included in the initial analysis, these miRNAs were not selected for the second set of experiments.
Table 1. miRNAs tested in the first study.
| miRNA | Brain enrichment [21,22,51–57] | Present in synapses | Family | ||||||||||||||||||||||||||||||||||||||||||||||||||||||||||||||||||||||||||||||||||||||||||||||||
| 1 | Let-7e | Cer, MB, PG | + | miR-132 | |||||||||||||||||||||||||||||||||||||||||||||||||||||||||||||||||||||||||||||||||||||||||||||||
| 2 | miR-7 | PG, FC, Hip | + | ||||||||||||||||||||||||||||||||||||||||||||||||||||||||||||||||||||||||||||||||||||||||||||||||
| 3 | miR-9 | FC, MB, Hip, Cer | miR-132 | ||||||||||||||||||||||||||||||||||||||||||||||||||||||||||||||||||||||||||||||||||||||||||||||||
| 4 | miR-16 | Ubiquitous, PG | |||||||||||||||||||||||||||||||||||||||||||||||||||||||||||||||||||||||||||||||||||||||||||||||||
| 5 | miR-96 | PG | |||||||||||||||||||||||||||||||||||||||||||||||||||||||||||||||||||||||||||||||||||||||||||||||||
| 6 | miR-99a | PG, MB, FC | |||||||||||||||||||||||||||||||||||||||||||||||||||||||||||||||||||||||||||||||||||||||||||||||||
| 7 | miR-107 | FC, PG, Hip, MB | miR-132 | ||||||||||||||||||||||||||||||||||||||||||||||||||||||||||||||||||||||||||||||||||||||||||||||||
| 8 | miR-127-3p | PG, MB, FC | + | miR-134 | |||||||||||||||||||||||||||||||||||||||||||||||||||||||||||||||||||||||||||||||||||||||||||||||
| 9 | miR-128a | FC, Hip, Cer | + | miR-132 | |||||||||||||||||||||||||||||||||||||||||||||||||||||||||||||||||||||||||||||||||||||||||||||||
| 10 | miR-129-3p | FC, MB | |||||||||||||||||||||||||||||||||||||||||||||||||||||||||||||||||||||||||||||||||||||||||||||||||
| 11 | miR-132 | PG, Hip, FC, MB | + | miR-132 | |||||||||||||||||||||||||||||||||||||||||||||||||||||||||||||||||||||||||||||||||||||||||||||||
| 12 | miR-134 | MB, Hip, PG | + | miR-134 | |||||||||||||||||||||||||||||||||||||||||||||||||||||||||||||||||||||||||||||||||||||||||||||||
| 13 | miR-135a | PG, Hip | + | miR-132 | |||||||||||||||||||||||||||||||||||||||||||||||||||||||||||||||||||||||||||||||||||||||||||||||
| 14 | miR-149 | FC, MB | |||||||||||||||||||||||||||||||||||||||||||||||||||||||||||||||||||||||||||||||||||||||||||||||||
| 15 | miR-153 | Hip, FC | |||||||||||||||||||||||||||||||||||||||||||||||||||||||||||||||||||||||||||||||||||||||||||||||||
| 16 | miR-154 | PG, FC, MB | |||||||||||||||||||||||||||||||||||||||||||||||||||||||||||||||||||||||||||||||||||||||||||||||||
| 17 | miR-181a | MB, FC | miR-132 | ||||||||||||||||||||||||||||||||||||||||||||||||||||||||||||||||||||||||||||||||||||||||||||||||
| 18 | miR-182 | PG | |||||||||||||||||||||||||||||||||||||||||||||||||||||||||||||||||||||||||||||||||||||||||||||||||
| 19 | miR-184 | Hip, PG | |||||||||||||||||||||||||||||||||||||||||||||||||||||||||||||||||||||||||||||||||||||||||||||||||
| 20 | miR-195 | PG, MB | |||||||||||||||||||||||||||||||||||||||||||||||||||||||||||||||||||||||||||||||||||||||||||||||||
| 21 | miR-200a | PG | |||||||||||||||||||||||||||||||||||||||||||||||||||||||||||||||||||||||||||||||||||||||||||||||||
| 22 | miR-204 | Cer, MB, PG | |||||||||||||||||||||||||||||||||||||||||||||||||||||||||||||||||||||||||||||||||||||||||||||||||
| 23 | miR-323-3p | FC, Hip, MB | + | miR-134 | |||||||||||||||||||||||||||||||||||||||||||||||||||||||||||||||||||||||||||||||||||||||||||||||
| 24 | miR-335-5p | PG, Hip | miR-132 | ||||||||||||||||||||||||||||||||||||||||||||||||||||||||||||||||||||||||||||||||||||||||||||||||
| 25 | miR-338 | FC, Hip, MB, Cer | |||||||||||||||||||||||||||||||||||||||||||||||||||||||||||||||||||||||||||||||||||||||||||||||||
| 26 | miR-370 | FC, PG | + | miR-134 | |||||||||||||||||||||||||||||||||||||||||||||||||||||||||||||||||||||||||||||||||||||||||||||||
| 27 | miR-369 | PG | |||||||||||||||||||||||||||||||||||||||||||||||||||||||||||||||||||||||||||||||||||||||||||||||||
| 28 | miR-375 | PG | |||||||||||||||||||||||||||||||||||||||||||||||||||||||||||||||||||||||||||||||||||||||||||||||||
| 29 | miR-382 | Hip, FC | + | miR-134 | |||||||||||||||||||||||||||||||||||||||||||||||||||||||||||||||||||||||||||||||||||||||||||||||
| 30 | miR-410 | PG, MB | miR-134 | ||||||||||||||||||||||||||||||||||||||||||||||||||||||||||||||||||||||||||||||||||||||||||||||||
| 31 | miR-411 | PG, Hip, FC | miR-134 | ||||||||||||||||||||||||||||||||||||||||||||||||||||||||||||||||||||||||||||||||||||||||||||||||
| 32 | miR-433 | PG, MB | + | miR-134 | |||||||||||||||||||||||||||||||||||||||||||||||||||||||||||||||||||||||||||||||||||||||||||||||
| 33 | miR-451 | Ubiquitous / PG, MB, FC | |||||||||||||||||||||||||||||||||||||||||||||||||||||||||||||||||||||||||||||||||||||||||||||||||
| 34 | miR-485-5p | Hip | + | miR-134 | |||||||||||||||||||||||||||||||||||||||||||||||||||||||||||||||||||||||||||||||||||||||||||||||
| 35 | miR-487b | PG, FC, MB | miR-134 | ||||||||||||||||||||||||||||||||||||||||||||||||||||||||||||||||||||||||||||||||||||||||||||||||
| 36 | miR-488 | Hip, Cer | |||||||||||||||||||||||||||||||||||||||||||||||||||||||||||||||||||||||||||||||||||||||||||||||||
| 37 | miR-491-5p | MB, FC | + | miR-132 | |||||||||||||||||||||||||||||||||||||||||||||||||||||||||||||||||||||||||||||||||||||||||||||||
| 38 | miR-874 | Cer, Hip | + | miR-132 | |||||||||||||||||||||||||||||||||||||||||||||||||||||||||||||||||||||||||||||||||||||||||||||||
| Cer: cerebellum; FC: frontal cortex; Hip: hippocampus; MB: midbrain; PG: pituitary gland. | |||||||||||||||||||||||||||||||||||||||||||||||||||||||||||||||||||||||||||||||||||||||||||||||||||
Age-related changes and sex-dependent differences in the concentrations of circulating brain-enriched miRNAs in plasma were compared as follows: (1) “young” vs. “old” males; (2) “young” vs. “old” females; (3) “young” males vs. “young” females; and (4) “old” males vs. “old” females. Although the number of samples in each group was relatively small, Figure 1, Table 2 and Table S1 demonstrate that the groups were effectively distinguished from each other by the miRNA pairs and their combinations (classifiers). These data indicated that the plasma concentrations of certain brain-enriched miRNAs are sex- and age-dependent. miRNAs comprising the most effective pairs were chosen for more detailed analyses in the larger second stage of the study. Our previous data were also considered. In particular, in Sheinerman et al. [39], the miR-134 family most effectively differentiated “young” (21-50 y.o.) and “old” (71-85 y.o.) control groups.
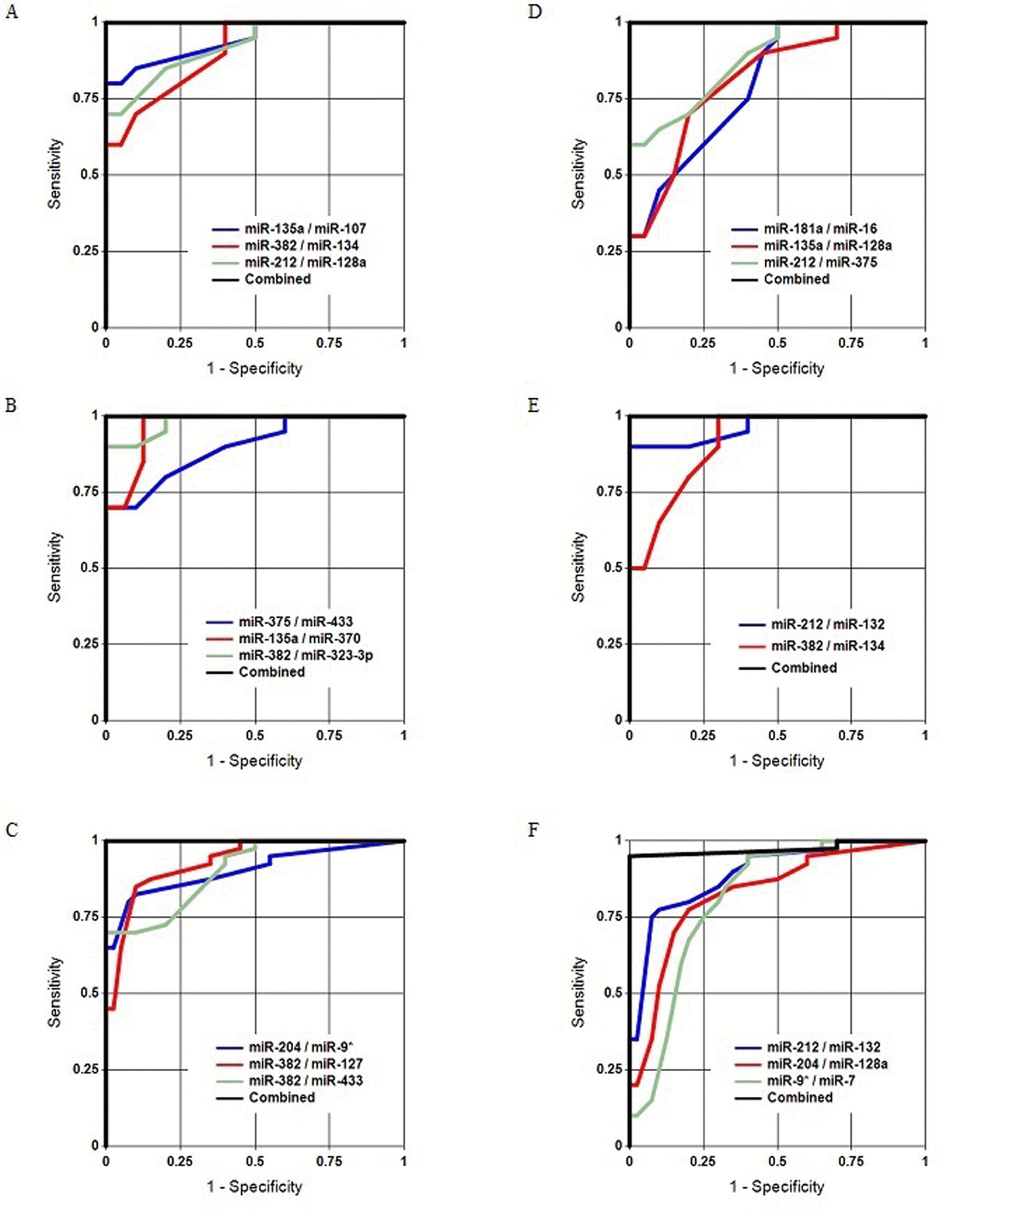
Figure 1. Separation of the analyzed groups in Study 1. (A, B, C) Old males vs. young males, old females vs. young females, and all old subjects vs. all young subjects, respectively. (D, E, F) Young females vs. young males, old females vs. old males, and all females vs. all males, respectively.
Table 2. Separation of the analyzed groups in Study 1.
| Old males vs. young males | |||||
| Pairs | Sens | Spec | Accur | AUC | P-Value |
| miR-135a / miR-128a | 0.90 | 0.90 | 0.90 | 0.99 | 1.20E-04 |
| miR-382 / miR-127 | 1.00 | 0.70 | 0.85 | 0.99 | 1.20E-04 |
| miR-212 / miR-9* | 0.90 | 1.00 | 0.95 | 0.98 | 2.90E-04 |
| miR-181a / miR-9* | 1.00 | 0.90 | 0.95 | 0.98 | 2.20E-04 |
| miR-132 / miR-9* | 0.90 | 0.90 | 0.90 | 0.98 | 2.20E-04 |
| miR-135a / miR-129-3p | 0.84 | 0.84 | 0.84 | 0.97 | 3.80E-04 |
| miR-135a / miR-107 | 0.86 | 0.86 | 0.86 | 0.97 | 3.80E-04 |
| miR-99a / miR-9* | 0.94 | 0.73 | 0.83 | 0.97 | 3.80E-04 |
| miR-212 / miR-129-3p | 0.77 | 0.87 | 0.82 | 0.96 | 3.80E-04 |
| miR-181a / miR-107 | 0.78 | 0.78 | 0.78 | 0.96 | 8.50E-04 |
| miR-411 / miR-127 | 0.88 | 0.69 | 0.79 | 0.96 | 6.60E-04 |
| miR-212 / miR-128a | 0.86 | 0.77 | 0.81 | 0.95 | 6.60E-04 |
| miR-382 / miR-134 | 0.82 | 0.72 | 0.77 | 0.94 | 1.10E-03 |
| miR-135a / miR-107 + miR-382 / miR-134 + miR-212 / miR-128a | 1.00 | 1.00 | 1.00 | 1.00 | 6.70E-05 |
| Old females vs. young females | |||||
| Pairs | Sens | Spec | Accur | AUC | P-Value |
| miR-382 / miR-323-3p | 0.60 | 1.00 | 0.80 | 0.99 | 1.20E-04 |
| miR-99a / miR-370 | 0.70 | 1.00 | 0.83 | 0.98 | 4.20E-04 |
| miR-195 / miR-16 | 0.90 | 0.90 | 0.90 | 0.98 | 2.90E-04 |
| miR-135a / miR-370 | 0.70 | 1.00 | 0.83 | 0.98 | 4.20E-04 |
| miR-382 / miR-127 | 0.90 | 0.90 | 0.90 | 0.98 | 2.20E-04 |
| miR-382 / miR-433 | 0.90 | 0.80 | 0.85 | 0.98 | 2.20E-04 |
| miR-99a / miR-433 | 0.80 | 0.90 | 0.85 | 0.96 | 8.50E-04 |
| miR-99a / miR-154 | 0.62 | 0.90 | 0.74 | 0.96 | 1.10E-03 |
| miR-181a / miR-370 | 1.00 | 0.75 | 0.89 | 0.96 | 7.80E-04 |
| miR-181a / miR-9* | 0.86 | 0.86 | 0.86 | 0.96 | 5.00E-04 |
| miR-181a / miR-491 | 0.80 | 0.90 | 0.85 | 0.96 | 6.60E-04 |
| miR-382 / miR-370 | 0.88 | 0.73 | 0.81 | 0.96 | 1.10E-03 |
| miR-375 / miR-433 | 0.80 | 0.80 | 0.80 | 0.94 | 1.10E-03 |
| miR-375 / miR-433 + miR-135a / miR-370 + miR-382 / miR-323-3p | 1.00 | 1.00 | 1.00 | 1.00 | 6.70E-05 |
| All old subjects vs. all young subjects | |||||
| Pairs | Sens | Spec | Accur | AUC | P-Value |
| miR-181a / miR-9* | 1.00 | 0.85 | 0.93 | 0.96 | 6.00E-07 |
| miR-135a / miR-9* | 0.85 | 1.00 | 0.93 | 0.95 | 2.30E-06 |
| miR-382 / miR-127 | 0.88 | 0.83 | 0.86 | 0.95 | 1.30E-06 |
| miR-382 / miR-134 | 0.86 | 0.81 | 0.84 | 0.95 | 1.70E-06 |
| miR-382 / miR-323-3p | 0.82 | 0.82 | 0.82 | 0.94 | 2.90E-06 |
| miR-99a / miR-9* | 0.80 | 0.80 | 0.80 | 0.92 | 7.00E-06 |
| miR-204 / miR-9* | 0.84 | 0.84 | 0.84 | 0.92 | 9.00E-06 |
| miR-181a / miR-107 | 0.75 | 0.80 | 0.78 | 0.91 | 1.60E-05 |
| miR-382 / miR-433 | 0.84 | 0.69 | 0.76 | 0.91 | 7.00E-06 |
| miR-135a / miR-128a | 0.80 | 0.70 | 0.75 | 0.89 | 5.80E-05 |
| miR-487b / miR-127 | 0.75 | 0.75 | 0.75 | 0.88 | 4.60E-05 |
| miR-135a / miR-338-3p | 0.79 | 0.74 | 0.77 | 0.87 | 1.50E-04 |
| miR-99a / miR-338-3p | 0.80 | 0.65 | 0.73 | 0.87 | 1.40E-04 |
| miR-204 / miR-9* + miR-382 / miR-127 + miR-382 / miR-323-3p | 1.00 | 1.00 | 1.00 | 1.00 | 2.90E-08 |
| Young females vs. young males | |||||
| Pairs / Combos | Sens | Spec | Accur | AUC | P-Value |
| miR-212 / miR-874 | 0.86 | 0.86 | 0.86 | 0.97 | 2.90E-04 |
| miR-212 / miR-7 | 0.82 | 0.93 | 0.88 | 0.95 | 8.50E-04 |
| miR-212 / miR-195 | 0.83 | 0.73 | 0.78 | 0.94 | 1.40E-03 |
| miR-212 / miR-128a | 0.79 | 0.69 | 0.74 | 0.93 | 2.30E-03 |
| miR-212 / miR-375 | 0.80 | 0.70 | 0.75 | 0.92 | 1.80E-03 |
| miR-212 / miR-16 | 0.77 | 0.68 | 0.73 | 0.90 | 2.90E-03 |
| miR-204 / miR-128a | 0.78 | 0.78 | 0.78 | 0.90 | 2.90E-03 |
| miR-135a / miR-128a | 0.74 | 0.74 | 0.74 | 0.89 | 5.70E-03 |
| miR-212 / miR-184 | 0.67 | 0.74 | 0.70 | 0.89 | 1.70E-02 |
| miR-411 / miR-323-3p | 0.76 | 0.76 | 0.76 | 0.89 | 7.00E-03 |
| miR-181a / miR-107 | 0.62 | 0.73 | 0.68 | 0.88 | 7.00E-03 |
| miR-212 / miR-182 | 0.80 | 0.70 | 0.75 | 0.88 | 5.70E-03 |
| miR-212 / miR-491 | 0.80 | 0.60 | 0.70 | 0.88 | 4.60E-03 |
| miR-181a / miR-16 + miR-135a / miR-128a + miR-212 / miR-375 | 1.00 | 1.00 | 1.00 | 1.00 | 6.70E-05 |
| Old females vs. old males | |||||
| Pairs / Combos | Sens | Spec | Accur | AUC | P-Value |
| miR-212 / miR-132 | 0.90 | 1.00 | 0.95 | 0.98 | 2.20E-04 |
| miR-375 / miR-7 | 0.90 | 0.80 | 0.85 | 0.97 | 3.80E-04 |
| miR-200a / miR-7 | 0.90 | 0.90 | 0.90 | 0.97 | 5.00E-04 |
| miR-204 / miR-7 | 0.77 | 0.86 | 0.82 | 0.96 | 5.00E-04 |
| miR-204 / let-7e | 0.84 | 0.73 | 0.79 | 0.95 | 6.60E-04 |
| miR-195 / miR-7 | 0.74 | 0.84 | 0.79 | 0.95 | 8.50E-04 |
| miR-382 / miR-134 | 0.85 | 0.75 | 0.80 | 0.95 | 8.50E-04 |
| miR-200a / let-7e | 0.71 | 0.80 | 0.76 | 0.94 | 1.80E-03 |
| miR-9* / miR-7 | 0.83 | 0.83 | 0.83 | 0.94 | 8.50E-04 |
| miR-9* / miR-135a | 0.80 | 0.70 | 0.75 | 0.94 | 1.40E-03 |
| miR-212 / miR-7 | 0.80 | 0.80 | 0.80 | 0.94 | 8.50E-04 |
| miR-181a / miR-7 | 0.82 | 0.72 | 0.77 | 0.94 | 8.50E-04 |
| miR-874 / miR-7 | 0.90 | 0.70 | 0.80 | 0.94 | 6.60E-04 |
| miR-212 / miR-132 + miR-382 / miR-134 | 1.00 | 1.00 | 1.00 | 1.00 | 6.70E-05 |
| All females vs. all males | |||||
| Pairs / Combos | SENS | SPEC | ACCUR | AUC | P-Value |
| miR-212 / miR-7 | 0.84 | 0.84 | 0.84 | 0.93 | 8.00E-06 |
| miR-212 / miR-132 | 0.82 | 0.77 | 0.79 | 0.92 | 1.10E-05 |
| miR-212 / miR-16 | 0.82 | 0.77 | 0.79 | 0.89 | 6.40E-05 |
| miR-204 / miR-128a | 0.76 | 0.81 | 0.78 | 0.86 | 2.10E-04 |
| miR-874 / miR-7 | 0.67 | 0.77 | 0.72 | 0.85 | 2.80E-04 |
| miR-212 / miR-107 | 0.73 | 0.68 | 0.71 | 0.84 | 4.60E-04 |
| miR-212 / miR-128a | 0.70 | 0.70 | 0.70 | 0.84 | 5.10E-04 |
| miR-212 / miR-195 | 0.64 | 0.79 | 0.72 | 0.84 | 4.60E-04 |
| miR-204 / miR-7 | 0.82 | 0.56 | 0.69 | 0.84 | 2.80E-04 |
| miR-9* / miR-7 | 0.75 | 0.75 | 0.75 | 0.84 | 3.80E-04 |
| miR-181a / miR-7 | 0.62 | 0.72 | 0.67 | 0.84 | 2.50E-04 |
| miR-212 / miR-874 | 0.69 | 0.69 | 0.69 | 0.83 | 7.40E-04 |
| miR-204 / miR-107 | 0.71 | 0.76 | 0.74 | 0.83 | 8.10E-04 |
| miR-212 / miR-195 + miR-204 / miR-128a + miR-9* / miR-7 | 0.85 | 0.95 | 0.90 | 0.97 | 5.20E-07 |
Nineteen miRNAs (see Table S1) were selected for the analysis of the plasma samples from 100 subjects: 5 groups, namely, 26-35, 36-45, 46-55, 56-65 and 66-75-year-olds, with 10 females and 10 males in each group. Figure 2 presents the age-dependent changes in the plasma concentrations of individual miRNAs in females and males (averages for 10 subjects in each group). Several observations are of interest here: (1) among the tested miRNAs, the concentration of no single miRNA correlated with age in all (female and male) subjects; (2) the age-dependent changes in miRNA concentrations were different in male and female subjects; (3) the age-dependent changes in the concentrations of some miRNAs, e.g. members of the miR-134 family, were similar across the sex-stratified groups; and (4) there were peaks in the plasma concentrations of many miRNAs in the 46-55-year-old females and the 56-65-years-old males.
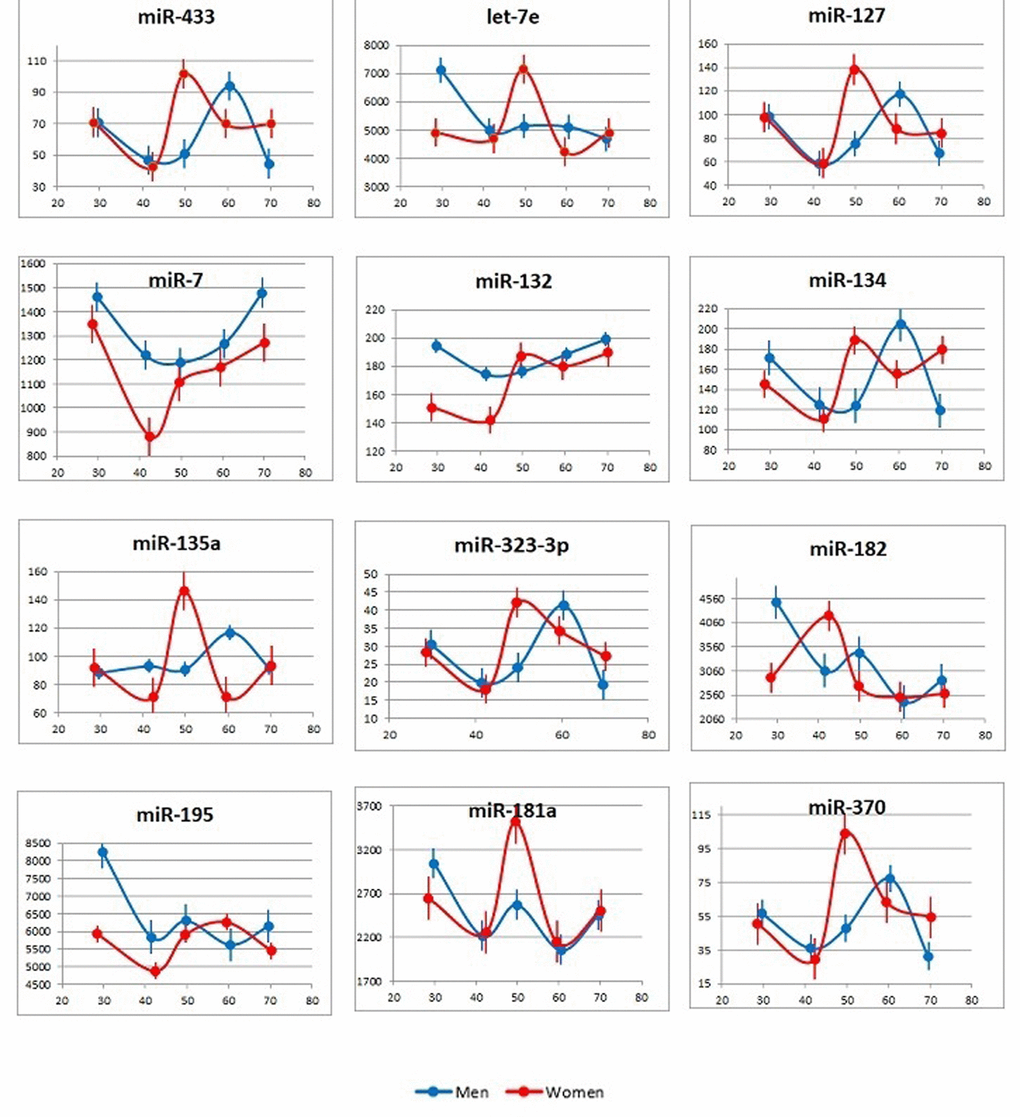
Figure 2. Age-dependent changes in plasma concentrations of the tested brain-enriched miRNAs. Data are presented as the average and standard deviation for each age group.
X axis: age; Y axis: number of miRNA copies per 1 μl of plasma.
One key finding of the study was that, among the tested miRNAs, no single one could be used as an age biomarker for the entire tested age continuum. More detailed analyses also revealed that there was no miRNA pair formed by the tested miRNAs that correlated with a subject’s age over a prolonged time period. We further analyzed the correlations of individual miRNAs with age across 10-year spans in the sex-stratified groups (Figure 3 and Figure S1 and Table S2). As expected, from the dynamics of miRNA plasma concentrations (Figure 2), the age spans, during which correlations between the levels of certain individual miRNAs and subject age are observed, were significantly different for female and male subjects. Further, although the division of age groups was done arbitrarily by 10-year spans, and additional studies are needed to assess the physiological relevance of the present findings, the age groups were effectively separated from each other by multiple miRNA pairs and their combinations (Figure S2, Tables 3).

Figure 3. Correlation of miRNA plasma concentrations with age in male and female subjects. Data are presented as average and standard deviation for each age cohort.
X axis: age; Y axis: correlation of miRNA plasma concentrations with subject age in the analyzed groups (r).
Table 3. Males. miRNA pairs and their combinations that differentiated consecutively aged males from each other.
| M_36/M_26 group | |||||||||||||||||||||||||||||||||||||||||||||||||||||||||||||||||||||||||||||||||||||||||||||||||||
| Pairs / Combos | SENS | SPEC | ACCUR | AUC | P-Value | ||||||||||||||||||||||||||||||||||||||||||||||||||||||||||||||||||||||||||||||||||||||||||||||
| miR-135a / let-7e | 0.77 | 0.86 | 0.82 | 0.94 | 1.40E-03 | ||||||||||||||||||||||||||||||||||||||||||||||||||||||||||||||||||||||||||||||||||||||||||||||
| miR-135a / miR-487b | 0.86 | 0.76 | 0.81 | 0.9 | 4.60E-03 | ||||||||||||||||||||||||||||||||||||||||||||||||||||||||||||||||||||||||||||||||||||||||||||||
| miR-132 / miR-411 | 0.67 | 0.9 | 0.79 | 0.89 | 1.00E-02 | ||||||||||||||||||||||||||||||||||||||||||||||||||||||||||||||||||||||||||||||||||||||||||||||
| miR-132 / miR-127 | 0.76 | 0.76 | 0.76 | 0.83 | 1.90E-02 | ||||||||||||||||||||||||||||||||||||||||||||||||||||||||||||||||||||||||||||||||||||||||||||||
| miR-382 / miR-487b | 0.76 | 0.76 | 0.76 | 0.87 | 1.60E-02 | ||||||||||||||||||||||||||||||||||||||||||||||||||||||||||||||||||||||||||||||||||||||||||||||
| miR-135a / miR-411 | 0.78 | 0.7 | 0.74 | 0.87 | 1.20E-02 | ||||||||||||||||||||||||||||||||||||||||||||||||||||||||||||||||||||||||||||||||||||||||||||||
| miR-135a / miR-127 | 0.82 | 0.64 | 0.73 | 0.86 | 8.60E-03 | ||||||||||||||||||||||||||||||||||||||||||||||||||||||||||||||||||||||||||||||||||||||||||||||
| miR-132 / miR-487b | 0.77 | 0.68 | 0.73 | 0.82 | 1.90E-02 | ||||||||||||||||||||||||||||||||||||||||||||||||||||||||||||||||||||||||||||||||||||||||||||||
| miR-134 / miR-127 | 0.77 | 0.68 | 0.73 | 0.83 | 2.30E-02 | ||||||||||||||||||||||||||||||||||||||||||||||||||||||||||||||||||||||||||||||||||||||||||||||
| miR-135a / miR-134 | 0.72 | 0.72 | 0.72 | 0.86 | 1.60E-02 | ||||||||||||||||||||||||||||||||||||||||||||||||||||||||||||||||||||||||||||||||||||||||||||||
| miR-135a / miR-181a | 0.8 | 0.6 | 0.7 | 0.84 | 1.90E-02 | ||||||||||||||||||||||||||||||||||||||||||||||||||||||||||||||||||||||||||||||||||||||||||||||
| miR-99a / miR-487b | 0.58 | 0.78 | 0.68 | 0.81 | 2.70E-02 | ||||||||||||||||||||||||||||||||||||||||||||||||||||||||||||||||||||||||||||||||||||||||||||||
| miR-99a / miR-127 | 0.58 | 0.77 | 0.68 | 0.81 | 2.70E-02 | ||||||||||||||||||||||||||||||||||||||||||||||||||||||||||||||||||||||||||||||||||||||||||||||
| miR-135a / miR-382 | 0.67 | 0.67 | 0.67 | 0.82 | 1.90E-02 | ||||||||||||||||||||||||||||||||||||||||||||||||||||||||||||||||||||||||||||||||||||||||||||||
| miR-135a / miR-7 | 0.77 | 0.58 | 0.67 | 0.83 | 4.40E-02 | ||||||||||||||||||||||||||||||||||||||||||||||||||||||||||||||||||||||||||||||||||||||||||||||
| miR-134 / miR-487b | 0.57 | 0.76 | 0.66 | 0.8 | 2.70E-02 | ||||||||||||||||||||||||||||||||||||||||||||||||||||||||||||||||||||||||||||||||||||||||||||||
| miR-135a / miR-370 | 0.88 | 0.44 | 0.65 | 0.81 | 3.80E-02 | ||||||||||||||||||||||||||||||||||||||||||||||||||||||||||||||||||||||||||||||||||||||||||||||
| miR-491-5p / miR-411 | 0.74 | 0.57 | 0.65 | 0.8 | 4.70E-02 | ||||||||||||||||||||||||||||||||||||||||||||||||||||||||||||||||||||||||||||||||||||||||||||||
| miR-874 / miR-487b | 0.6 | 0.7 | 0.65 | 0.81 | 4.40E-02 | ||||||||||||||||||||||||||||||||||||||||||||||||||||||||||||||||||||||||||||||||||||||||||||||
| miR-135a / miR-433 | 0.67 | 0.6 | 0.63 | 0.8 | 4.00E-02 | ||||||||||||||||||||||||||||||||||||||||||||||||||||||||||||||||||||||||||||||||||||||||||||||
| miR-135a /let-7e + miR-132 / miR-411 | 0.90 | 0.80 | 0.85 | 0.95 | 8.50E-04 | ||||||||||||||||||||||||||||||||||||||||||||||||||||||||||||||||||||||||||||||||||||||||||||||
| M_46 / M36 | |||||||||||||||||||||||||||||||||||||||||||||||||||||||||||||||||||||||||||||||||||||||||||||||||||
| Pairs / Combos | SENS | SPEC | ACCUR | AUC | P-Value | ||||||||||||||||||||||||||||||||||||||||||||||||||||||||||||||||||||||||||||||||||||||||||||||
| miR-370 / miR-134 | 0.78 | 0.78 | 0.78 | 0.91 | 6.60E-03 | ||||||||||||||||||||||||||||||||||||||||||||||||||||||||||||||||||||||||||||||||||||||||||||||
| miR-127 / miR-135a | 0.77 | 0.67 | 0.72 | 0.83 | 2.30E-02 | ||||||||||||||||||||||||||||||||||||||||||||||||||||||||||||||||||||||||||||||||||||||||||||||
| miR-127 / miR-134 | 0.66 | 0.76 | 0.71 | 0.8 | 2.70E-02 | ||||||||||||||||||||||||||||||||||||||||||||||||||||||||||||||||||||||||||||||||||||||||||||||
| miR-134 / miR-135a | 0.62 | 0.73 | 0.68 | 0.83 | 4.40E-02 | ||||||||||||||||||||||||||||||||||||||||||||||||||||||||||||||||||||||||||||||||||||||||||||||
| miR-323-3p / miR-135a | 0.8 | 0.5 | 0.65 | 0.82 | 3.20E-02 | ||||||||||||||||||||||||||||||||||||||||||||||||||||||||||||||||||||||||||||||||||||||||||||||
| miR-7 / miR-135a | 0.63 | 0.63 | 63.00 | 0.78 | 1.10E-02 | ||||||||||||||||||||||||||||||||||||||||||||||||||||||||||||||||||||||||||||||||||||||||||||||
| miR-487b / miR-134 | 0.66 | 0.56 | 0.61 | 0.78 | 8.10E-02 | ||||||||||||||||||||||||||||||||||||||||||||||||||||||||||||||||||||||||||||||||||||||||||||||
| miR-7 / miR-135a + miR-127 / miR-134 + miR-487b / miR-134 | 0.90 | 0.80 | 0.85 | 0.92 | 3.60E-03 | ||||||||||||||||||||||||||||||||||||||||||||||||||||||||||||||||||||||||||||||||||||||||||||||
| M_56 / M46 | |||||||||||||||||||||||||||||||||||||||||||||||||||||||||||||||||||||||||||||||||||||||||||||||||||
| Pairs / Combos | SENS | SPEC | ACCUR | AUC | P-Value | ||||||||||||||||||||||||||||||||||||||||||||||||||||||||||||||||||||||||||||||||||||||||||||||
| miR-433 / miR-182 | 0.88 | 0.7 | 0.78 | 0.84 | 1.80E-02 | ||||||||||||||||||||||||||||||||||||||||||||||||||||||||||||||||||||||||||||||||||||||||||||||
| miR-433 / miR-411 | 0.75 | 0.8 | 0.78 | 0.91 | 4.30E-03 | ||||||||||||||||||||||||||||||||||||||||||||||||||||||||||||||||||||||||||||||||||||||||||||||
| miR-433 / miR-132 | 0.78 | 0.73 | 0.75 | 0.81 | 5.00E-02 | ||||||||||||||||||||||||||||||||||||||||||||||||||||||||||||||||||||||||||||||||||||||||||||||
| miR-382 / miR-411 | 0.72 | 0.76 | 0.74 | 0.86 | 1.50E-02 | ||||||||||||||||||||||||||||||||||||||||||||||||||||||||||||||||||||||||||||||||||||||||||||||
| miR-433 / miR-195 | 0.63 | 0.8 | 0.72 | 0.86 | 3.40E-02 | ||||||||||||||||||||||||||||||||||||||||||||||||||||||||||||||||||||||||||||||||||||||||||||||
| miR-491-5p / miR-181a | 0.7 | 0.7 | 0.7 | 0.81 | 3.20E-02 | ||||||||||||||||||||||||||||||||||||||||||||||||||||||||||||||||||||||||||||||||||||||||||||||
| miR-135a / miR-182 | 0.59 | 0.79 | 0.69 | 0.84 | 1.60E-02 | ||||||||||||||||||||||||||||||||||||||||||||||||||||||||||||||||||||||||||||||||||||||||||||||
| miR-491-5p / let-7e | 0.74 | 0.63 | 0.69 | 0.81 | 3.20E-02 | ||||||||||||||||||||||||||||||||||||||||||||||||||||||||||||||||||||||||||||||||||||||||||||||
| miR-433 / miR-181a | 0.71 | 0.66 | 0.68 | 0.83 | 2.80E-02 | ||||||||||||||||||||||||||||||||||||||||||||||||||||||||||||||||||||||||||||||||||||||||||||||
| miR-135a / miR-181a | 0.62 | 0.73 | 0.68 | 0.82 | 2.70E-02 | ||||||||||||||||||||||||||||||||||||||||||||||||||||||||||||||||||||||||||||||||||||||||||||||
| miR-370 / miR-182 | 0.48 | 0.83 | 0.67 | 0.85 | 2.80E-02 | ||||||||||||||||||||||||||||||||||||||||||||||||||||||||||||||||||||||||||||||||||||||||||||||
| miR-487b / miR-411 | 0.59 | 0.73 | 0.67 | 0.89 | 2.30E-02 | ||||||||||||||||||||||||||||||||||||||||||||||||||||||||||||||||||||||||||||||||||||||||||||||
| miR-135a / miR-7 | 0.49 | 0.78 | 0.64 | 0.81 | 2.70E-02 | ||||||||||||||||||||||||||||||||||||||||||||||||||||||||||||||||||||||||||||||||||||||||||||||
| miR-433 / miR-370 | 0.47 | 0.68 | 0.58 | 0.8 | 4.60E-02 | ||||||||||||||||||||||||||||||||||||||||||||||||||||||||||||||||||||||||||||||||||||||||||||||
| miR-433 / miR-411 + miR-433 / miR-370 + miR-370 / miR-182 | 0.88 | 0.90 | 0.89 | 0.96 | 6.60E-04 | ||||||||||||||||||||||||||||||||||||||||||||||||||||||||||||||||||||||||||||||||||||||||||||||
| M_66 / M56 | |||||||||||||||||||||||||||||||||||||||||||||||||||||||||||||||||||||||||||||||||||||||||||||||||||
| Pairs / Combos | SENS | SPEC | ACCUR | AUC | P-Value | ||||||||||||||||||||||||||||||||||||||||||||||||||||||||||||||||||||||||||||||||||||||||||||||
| miR-182 / miR-370 | 0.69 | 0.83 | 0.76 | 0.93 | 7.50E-03 | ||||||||||||||||||||||||||||||||||||||||||||||||||||||||||||||||||||||||||||||||||||||||||||||
| miR-134 / miR-382 | 0.8 | 0.67 | 0.74 | 0.84 | 1.50E-02 | ||||||||||||||||||||||||||||||||||||||||||||||||||||||||||||||||||||||||||||||||||||||||||||||
| miR-7 / miR-370 | 0.71 | 0.71 | 0.71 | 0.87 | 2.00E-02 | ||||||||||||||||||||||||||||||||||||||||||||||||||||||||||||||||||||||||||||||||||||||||||||||
| miR-195 / miR-370 | 0.78 | 0.65 | 0.71 | 0.87 | 2.00E-02 | ||||||||||||||||||||||||||||||||||||||||||||||||||||||||||||||||||||||||||||||||||||||||||||||
| miR-411 / miR-382 | 0.67 | 0.75 | 0.71 | 0.84 | 2.40E-02 | ||||||||||||||||||||||||||||||||||||||||||||||||||||||||||||||||||||||||||||||||||||||||||||||
| miR-182 / miR-433 | 0.58 | 0.85 | 0.7 | 0.9 | 7.10E-03 | ||||||||||||||||||||||||||||||||||||||||||||||||||||||||||||||||||||||||||||||||||||||||||||||
| miR-195 / miR-433 | 0.63 | 0.79 | 0.7 | 0.84 | 3.40E-02 | ||||||||||||||||||||||||||||||||||||||||||||||||||||||||||||||||||||||||||||||||||||||||||||||
| miR-874 / miR-433 | 0.84 | 0.53 | 0.7 | 0.84 | 2.80E-02 | ||||||||||||||||||||||||||||||||||||||||||||||||||||||||||||||||||||||||||||||||||||||||||||||
| miR-181a / miR-370 | 0.63 | 0.76 | 0.69 | 0.88 | 2.70E-02 | ||||||||||||||||||||||||||||||||||||||||||||||||||||||||||||||||||||||||||||||||||||||||||||||
| miR-874 / miR-370 | 0.77 | 0.62 | 0.69 | 0.82 | 4.80E-02 | ||||||||||||||||||||||||||||||||||||||||||||||||||||||||||||||||||||||||||||||||||||||||||||||
| miR-132 / miR-433 | 0.56 | 0.82 | 0.68 | 0.86 | 1.50E-02 | ||||||||||||||||||||||||||||||||||||||||||||||||||||||||||||||||||||||||||||||||||||||||||||||
| miR-127 / miR-370 | 0.6 | 0.75 | 0.68 | 0.82 | 4.80E-02 | ||||||||||||||||||||||||||||||||||||||||||||||||||||||||||||||||||||||||||||||||||||||||||||||
| miR-181a / miR-433 | 0.6 | 0.75 | 0.67 | 0.83 | 2.80E-02 | ||||||||||||||||||||||||||||||||||||||||||||||||||||||||||||||||||||||||||||||||||||||||||||||
| miR-7 / miR-433 | 0.6 | 0.75 | 0.67 | 0.83 | 2.30E-02 | ||||||||||||||||||||||||||||||||||||||||||||||||||||||||||||||||||||||||||||||||||||||||||||||
| miR-134 / miR-370 | 0.6 | 0.74 | 0.67 | 0.85 | 3.70E-02 | ||||||||||||||||||||||||||||||||||||||||||||||||||||||||||||||||||||||||||||||||||||||||||||||
| miR-99a / miR-382 | 0.66 | 0.66 | 0.66 | 0.83 | 1.90E-02 | ||||||||||||||||||||||||||||||||||||||||||||||||||||||||||||||||||||||||||||||||||||||||||||||
| miR-181a / miR-874 | 0.66 | 0.66 | 0.66 | 0.8 | 3.80E-02 | ||||||||||||||||||||||||||||||||||||||||||||||||||||||||||||||||||||||||||||||||||||||||||||||
| miR-182 / miR-411 | 0.52 | 0.82 | 0.66 | 0.86 | 1.90E-02 | ||||||||||||||||||||||||||||||||||||||||||||||||||||||||||||||||||||||||||||||||||||||||||||||
| miR-127 / miR-382 | 0.51 | 0.81 | 0.66 | 0.85 | 1.10E-02 | ||||||||||||||||||||||||||||||||||||||||||||||||||||||||||||||||||||||||||||||||||||||||||||||
| miR-181a / let-7e | 0.7 | 0.6 | 0.65 | 0.81 | 3.20E-02 | ||||||||||||||||||||||||||||||||||||||||||||||||||||||||||||||||||||||||||||||||||||||||||||||
| miR-132 / miR-370 | 0.57 | 0.71 | 0.64 | 0.87 | 2.70E-02 | ||||||||||||||||||||||||||||||||||||||||||||||||||||||||||||||||||||||||||||||||||||||||||||||
| miR-182 / miR-433 + miR-127 / miR-382 + miR-134 / miR-370 | 0.90 | 1.00 | 0.95 | 0.98 | 2.20E-04 | ||||||||||||||||||||||||||||||||||||||||||||||||||||||||||||||||||||||||||||||||||||||||||||||
| SENS: sensitivity; SPEC: specificity; ACCUR: accuracy; AUC: area under the ROC curve; M: males; F: females. Numbers indicate the youngest age of each respective group (e.g. F_26 is the female 26-35-year-old group). | |||||||||||||||||||||||||||||||||||||||||||||||||||||||||||||||||||||||||||||||||||||||||||||||||||
Table 3. Females. miRNA pairs and their combinations that differentiated consecutively aged females from each other.
| F_36 / F_26 | |||||||||||||||||||||||||||||||||||||||||||||||||||||||||||||||||||||||||||||||||||||||||||||||||||
| Pairs / Combos | SENS | SPEC | ACCUR | AUC | P-Value | ||||||||||||||||||||||||||||||||||||||||||||||||||||||||||||||||||||||||||||||||||||||||||||||
| miR-182 / miR-375 | 0.76 | 0.76 | 0.76 | 0.83 | 2.30E-02 | ||||||||||||||||||||||||||||||||||||||||||||||||||||||||||||||||||||||||||||||||||||||||||||||
| miR-487b / miR-370 | 0.8 | 0.73 | 0.76 | 0.87 | 2.20E-02 | ||||||||||||||||||||||||||||||||||||||||||||||||||||||||||||||||||||||||||||||||||||||||||||||
| miR-134 / miR-370 | 0.68 | 0.76 | 0.73 | 0.83 | 2.90E-02 | ||||||||||||||||||||||||||||||||||||||||||||||||||||||||||||||||||||||||||||||||||||||||||||||
| miR-132 / miR-375 | 0.67 | 0.77 | 0.72 | 0.83 | 2.30E-02 | ||||||||||||||||||||||||||||||||||||||||||||||||||||||||||||||||||||||||||||||||||||||||||||||
| miR-874 / miR-375 | 0.72 | 0.72 | 0.72 | 0.85 | 2.30E-02 | ||||||||||||||||||||||||||||||||||||||||||||||||||||||||||||||||||||||||||||||||||||||||||||||
| miR-99a / miR-375 | 0.67 | 0.75 | 0.71 | 0.92 | 4.60E-03 | ||||||||||||||||||||||||||||||||||||||||||||||||||||||||||||||||||||||||||||||||||||||||||||||
| let-7e / miR-375 | 0.71 | 0.71 | 0.71 | 0.85 | 2.30E-02 | ||||||||||||||||||||||||||||||||||||||||||||||||||||||||||||||||||||||||||||||||||||||||||||||
| miR-134 / miR-127 | 0.7 | 0.7 | 0.7 | 0.81 | 2.70E-02 | ||||||||||||||||||||||||||||||||||||||||||||||||||||||||||||||||||||||||||||||||||||||||||||||
| miR-433 / miR-370 | 0.52 | 0.8 | 0.69 | 0.87 | 2.00E-02 | ||||||||||||||||||||||||||||||||||||||||||||||||||||||||||||||||||||||||||||||||||||||||||||||
| miR-182 / miR-382 | 0.54 | 0.78 | 0.67 | 0.82 | 3.30E-02 | ||||||||||||||||||||||||||||||||||||||||||||||||||||||||||||||||||||||||||||||||||||||||||||||
| miR-874 / miR-7 | 0.54 | 0.64 | 0.59 | 0.8 | 2.30E-02 | ||||||||||||||||||||||||||||||||||||||||||||||||||||||||||||||||||||||||||||||||||||||||||||||
| miR-135a / miR-7 | 0.42 | 0.74 | 0.58 | 0.8 | 3.80E-02 | ||||||||||||||||||||||||||||||||||||||||||||||||||||||||||||||||||||||||||||||||||||||||||||||
| let-7e / miR-375 + miR-134 / miR-127 + miR-487b / miR-370 | 0.90 | 0.80 | 0.85 | 0.96 | 6.60E-04 | ||||||||||||||||||||||||||||||||||||||||||||||||||||||||||||||||||||||||||||||||||||||||||||||
| F_46 / F_36 | |||||||||||||||||||||||||||||||||||||||||||||||||||||||||||||||||||||||||||||||||||||||||||||||||||
| Pairs / Combos | SENS | SPEC | ACCUR | AUC | P-Value | ||||||||||||||||||||||||||||||||||||||||||||||||||||||||||||||||||||||||||||||||||||||||||||||
| miR-370 / miR-323-3p | 0.68 | 0.82 | 0.75 | 0.87 | 2.00E-02 | ||||||||||||||||||||||||||||||||||||||||||||||||||||||||||||||||||||||||||||||||||||||||||||||
| miR-491-5p / miR-182 | 0.73 | 0.73 | 0.73 | 0.86 | 8.60E-03 | ||||||||||||||||||||||||||||||||||||||||||||||||||||||||||||||||||||||||||||||||||||||||||||||
| miR-375 / miR-99a | 0.83 | 0.62 | 0.73 | 0.82 | 3.20E-02 | ||||||||||||||||||||||||||||||||||||||||||||||||||||||||||||||||||||||||||||||||||||||||||||||
| miR-411 / miR-182 | 0.8 | 0.63 | 0.72 | 0.86 | 9.10E-03 | ||||||||||||||||||||||||||||||||||||||||||||||||||||||||||||||||||||||||||||||||||||||||||||||
| miR-370 / miR-382 | 0.66 | 0.77 | 0.71 | 0.89 | 1.90E-02 | ||||||||||||||||||||||||||||||||||||||||||||||||||||||||||||||||||||||||||||||||||||||||||||||
| miR-370 / miR-134 | 0.71 | 0.71 | 0.71 | 0.87 | 2.00E-02 | ||||||||||||||||||||||||||||||||||||||||||||||||||||||||||||||||||||||||||||||||||||||||||||||
| miR-370 / miR-127 | 0.71 | 0.71 | 0.71 | 0.92 | 1.50E-02 | ||||||||||||||||||||||||||||||||||||||||||||||||||||||||||||||||||||||||||||||||||||||||||||||
| miR-135a / miR-182 | 0.71 | 0.71 | 0.71 | 0.83 | 2.30E-02 | ||||||||||||||||||||||||||||||||||||||||||||||||||||||||||||||||||||||||||||||||||||||||||||||
| miR-491-5p / miR-874 | 0.81 | 0.61 | 0.71 | 0.86 | 1.60E-02 | ||||||||||||||||||||||||||||||||||||||||||||||||||||||||||||||||||||||||||||||||||||||||||||||
| miR-375 / miR-182 | 0.66 | 0.76 | 0.71 | 0.83 | 1.60E-02 | ||||||||||||||||||||||||||||||||||||||||||||||||||||||||||||||||||||||||||||||||||||||||||||||
| miR-370 / miR-487b | 0.64 | 0.77 | 0.7 | 0.85 | 3.70E-02 | ||||||||||||||||||||||||||||||||||||||||||||||||||||||||||||||||||||||||||||||||||||||||||||||
| miR-132 / miR-874 | 0.54 | 0.86 | 0.7 | 0.87 | 7.00E-03 | ||||||||||||||||||||||||||||||||||||||||||||||||||||||||||||||||||||||||||||||||||||||||||||||
| miR-370 / miR-182 | 0.62 | 0.77 | 0.69 | 0.83 | 3.70E-02 | ||||||||||||||||||||||||||||||||||||||||||||||||||||||||||||||||||||||||||||||||||||||||||||||
| miR-127 / miR-182 | 0.68 | 0.68 | 0.68 | 0.81 | 2.30E-02 | ||||||||||||||||||||||||||||||||||||||||||||||||||||||||||||||||||||||||||||||||||||||||||||||
| miR-135a / miR-874 | 0.53 | 0.84 | 0.68 | 0.85 | 1.10E-02 | ||||||||||||||||||||||||||||||||||||||||||||||||||||||||||||||||||||||||||||||||||||||||||||||
| miR-195 / miR-182 | 0.67 | 0.67 | 0.67 | 0.83 | 1.90E-02 | ||||||||||||||||||||||||||||||||||||||||||||||||||||||||||||||||||||||||||||||||||||||||||||||
| miR-370 / miR-874 | 0.66 | 0.66 | 0.66 | 0.84 | 4.80E-02 | ||||||||||||||||||||||||||||||||||||||||||||||||||||||||||||||||||||||||||||||||||||||||||||||
| miR-433 / miR-182 | 0.57 | 0.76 | 0.66 | 0.82 | 4.00E-02 | ||||||||||||||||||||||||||||||||||||||||||||||||||||||||||||||||||||||||||||||||||||||||||||||
| miR-411 / miR-134 | 0.86 | 0.4 | 0.65 | 0.81 | 3.40E-02 | ||||||||||||||||||||||||||||||||||||||||||||||||||||||||||||||||||||||||||||||||||||||||||||||
| miR-375 / miR-874 | 0.5 | 0.8 | 0.65 | 0.86 | 1.30E-02 | ||||||||||||||||||||||||||||||||||||||||||||||||||||||||||||||||||||||||||||||||||||||||||||||
| miR-411 / miR-182 + miR-135a / miR-874 + miR-375 / miR-99a | 0.9 | 0.9 | 0.9 | 0.99 | 1.60E-04 | ||||||||||||||||||||||||||||||||||||||||||||||||||||||||||||||||||||||||||||||||||||||||||||||
| F_56 / F_46 | |||||||||||||||||||||||||||||||||||||||||||||||||||||||||||||||||||||||||||||||||||||||||||||||||||
| Pairs / Combos | SENS | SPEC | ACCUR | AUC | P-Value | ||||||||||||||||||||||||||||||||||||||||||||||||||||||||||||||||||||||||||||||||||||||||||||||
| miR-491-5p / miR-411 | 0.73 | 0.73 | 0.73 | 0.82 | 3.20E-02 | ||||||||||||||||||||||||||||||||||||||||||||||||||||||||||||||||||||||||||||||||||||||||||||||
| miR-195 / miR-135a | 0.8 | 0.6 | 0.7 | 0.86 | 8.60E-03 | ||||||||||||||||||||||||||||||||||||||||||||||||||||||||||||||||||||||||||||||||||||||||||||||
| miR-195 / miR-99a | 0.74 | 0.63 | 0.69 | 0.86 | 8.60E-03 | ||||||||||||||||||||||||||||||||||||||||||||||||||||||||||||||||||||||||||||||||||||||||||||||
| miR-182 / miR-135a | 0.63 | 0.74 | 0.69 | 0.83 | 1.90E-02 | ||||||||||||||||||||||||||||||||||||||||||||||||||||||||||||||||||||||||||||||||||||||||||||||
| miR-323-3p / miR-411 | 0.74 | 0.63 | 0.68 | 0.82 | 1.90E-02 | ||||||||||||||||||||||||||||||||||||||||||||||||||||||||||||||||||||||||||||||||||||||||||||||
| miR-382 / miR-411 | 0.74 | 0.63 | 0.68 | 0.82 | 2.70E-02 | ||||||||||||||||||||||||||||||||||||||||||||||||||||||||||||||||||||||||||||||||||||||||||||||
| miR-132 / miR-135a | 0.67 | 0.67 | 0.67 | 0.87 | 2.30E-02 | ||||||||||||||||||||||||||||||||||||||||||||||||||||||||||||||||||||||||||||||||||||||||||||||
| miR-132 / let-7e | 0.66 | 0.66 | 0.66 | 0.81 | 4.40E-02 | ||||||||||||||||||||||||||||||||||||||||||||||||||||||||||||||||||||||||||||||||||||||||||||||
| miR-195 / miR-411 | 0.8 | 0.5 | 0.65 | 0.83 | 2.30E-02 | ||||||||||||||||||||||||||||||||||||||||||||||||||||||||||||||||||||||||||||||||||||||||||||||
| miR-132 / miR-411 | 0.79 | 0.49 | 0.64 | 0.84 | 3.20E-02 | ||||||||||||||||||||||||||||||||||||||||||||||||||||||||||||||||||||||||||||||||||||||||||||||
| miR-323-3p / miR-370 | 0.57 | 0.71 | 0.64 | 0.83 | 4.80E-02 | ||||||||||||||||||||||||||||||||||||||||||||||||||||||||||||||||||||||||||||||||||||||||||||||
| miR-195 / miR-135a + miR-195 / miR-99a + miR-382 / miR-411 | 1.00 | 0.90 | 0.95 | 0.99 | 1.60E-04 | ||||||||||||||||||||||||||||||||||||||||||||||||||||||||||||||||||||||||||||||||||||||||||||||
| F_66 / F_56 | |||||||||||||||||||||||||||||||||||||||||||||||||||||||||||||||||||||||||||||||||||||||||||||||||||
| Pairs / Combos | SENS | SPEC | ACCUR | AUC | P-Value | ||||||||||||||||||||||||||||||||||||||||||||||||||||||||||||||||||||||||||||||||||||||||||||||
| miR-135a / miR-195 | 0.7 | 0.7 | 0.7 | 0.83 | 1.30E-02 | ||||||||||||||||||||||||||||||||||||||||||||||||||||||||||||||||||||||||||||||||||||||||||||||
| miR-181a / miR-195 | 0.69 | 0.69 | 0.69 | 0.84 | 1.90E-02 | ||||||||||||||||||||||||||||||||||||||||||||||||||||||||||||||||||||||||||||||||||||||||||||||
| miR-134 / miR-323-3p | 0.69 | 0.62 | 0.66 | 0.8 | 3.30E-02 | ||||||||||||||||||||||||||||||||||||||||||||||||||||||||||||||||||||||||||||||||||||||||||||||
| miR-874 / miR-195 | 0.66 | 0.66 | 0.66 | 0.82 | 3.20E-02 | ||||||||||||||||||||||||||||||||||||||||||||||||||||||||||||||||||||||||||||||||||||||||||||||
| miR-134 / miR-382 | 0.77 | 0.54 | 0.63 | 0.8 | 4.40E-02 | ||||||||||||||||||||||||||||||||||||||||||||||||||||||||||||||||||||||||||||||||||||||||||||||
| miR-134 / miR-323-3p + miR-135a / miR-195 + miR-874 / miR-195 | 0.80 | 0.80 | 0.80 | 0.92 | 1.80E-03 | ||||||||||||||||||||||||||||||||||||||||||||||||||||||||||||||||||||||||||||||||||||||||||||||
| SENS: sensitivity; SPEC: specificity; ACCUR: accuracy; AUC: area under the ROC curve; M: males; F: females. Numbers indicate the youngest age of each respective group (e.g. F_26 is the female 26-35-year-old group). | |||||||||||||||||||||||||||||||||||||||||||||||||||||||||||||||||||||||||||||||||||||||||||||||||||
miRNA pairs whose correlations with age, particularly in the sex-stratified groups, were found to be statistically significant are presented in Figure S3 and Table 4.
Table 4. Spearman correlations of the miRNA pair combinations with subject ages in each of the 10 groups.
| Female | Male | ||||||||||||||||||||||||||||||||||||||||||||||||||||||||||||||||||||||||||||||||||||||||||||||||||
| Age Range | Pairs / Combos | Corr | RSD | P-Val | Pairs / Combos | Corr | RSD | P-Val | |||||||||||||||||||||||||||||||||||||||||||||||||||||||||||||||||||||||||||||||||||||||||||
| 26-35 | miR-135a / miR-323-3p | 0.57 | 0.96 | 0.04 | miR-135a / miR-491-5p | 0.77 | 1.90 | <0.01 | |||||||||||||||||||||||||||||||||||||||||||||||||||||||||||||||||||||||||||||||||||||||||||
| miR-411 / miR-370 | 0.65 | 0.88 | 0.02 | miR-135a / miR-195 | 0.64 | 2.27 | 0.02 | ||||||||||||||||||||||||||||||||||||||||||||||||||||||||||||||||||||||||||||||||||||||||||||
| miR-411 / miR-127 | 0.58 | 0.95 | 0.04 | miR-411 / miR-323-3p | 0.70 | 2.10 | 0.01 | ||||||||||||||||||||||||||||||||||||||||||||||||||||||||||||||||||||||||||||||||||||||||||||
| miR-127 / miR-323-3p | 0.71 | 2.08 | 0.01 | ||||||||||||||||||||||||||||||||||||||||||||||||||||||||||||||||||||||||||||||||||||||||||||||||
| miR-135a / miR-323-3p + miR-411 / miR-370 + miR-411 / miR-127 | 0.77 | 0.74 | <0.01 | miR-135a / miR-491-5p + miR-135a / miR-195 + miR-411 / miR-323-3p + miR-127 / miR-323-3p | 0.95 | 0.96 | <0.01 | ||||||||||||||||||||||||||||||||||||||||||||||||||||||||||||||||||||||||||||||||||||||||||||
| 36-45 | miR-134 / miR-135a | 0.59 | 2.73 | 0.04 | miR-127 / miR-134 | 0.53 | 1.66 | 0.06 | |||||||||||||||||||||||||||||||||||||||||||||||||||||||||||||||||||||||||||||||||||||||||||
| miR-375 / let-7e | 0.61 | 2.70 | 0.03 | miR-382 / let-7e | 0.59 | 1.57 | 0.04 | ||||||||||||||||||||||||||||||||||||||||||||||||||||||||||||||||||||||||||||||||||||||||||||
| miR-375 / miR-135a | 0.60 | 2.70 | 0.03 | miR-132 / let-7e | 0.53 | 1.65 | 0.06 | ||||||||||||||||||||||||||||||||||||||||||||||||||||||||||||||||||||||||||||||||||||||||||||
| miR-134 / miR-135a + miR-375 / let-7e + miR-375 / miR-135a | 0.91 | 1.42 | <0.01 | miR-127 / miR-134 + miR-382 / let-7e + miR-132 / let-7e | 0.73 | 1.34 | <0.01 | ||||||||||||||||||||||||||||||||||||||||||||||||||||||||||||||||||||||||||||||||||||||||||||
| 46-55 | miR-182 / miR-195 | 0.58 | 2.04 | 0.04 | miR-135a / miR-99a | 0.73 | 2.23 | 0.01 | |||||||||||||||||||||||||||||||||||||||||||||||||||||||||||||||||||||||||||||||||||||||||||
| miR-433 / miR-411 | 0.74 | 1.68 | <0.01 | miR-323-3p / miR-127 | 0.78 | 2.05 | <0.01 | ||||||||||||||||||||||||||||||||||||||||||||||||||||||||||||||||||||||||||||||||||||||||||||
| let-7e / miR-135a | 0.53 | 2.13 | 0.06 | miR-181a / miR-411 | 0.73 | 2.24 | <0.01 | ||||||||||||||||||||||||||||||||||||||||||||||||||||||||||||||||||||||||||||||||||||||||||||
| miR-182 / miR-195 + miR-433 / miR-411 + let-7e / miR-135a | 0.85 | 1.34 | <0.01 | miR-135a / miR-99a + miR-323-3p / miR-127 + miR-181a / miR-411 | 0.93 | 1.24 | <0.01 | ||||||||||||||||||||||||||||||||||||||||||||||||||||||||||||||||||||||||||||||||||||||||||||
| 56-65 | miR-323-3p / miR-433 | 0.64 | 1.69 | 0.02 | miR-182 / miR-491-5p | 0.70 | 2.82 | 0.01 | |||||||||||||||||||||||||||||||||||||||||||||||||||||||||||||||||||||||||||||||||||||||||||
| miR-382 / miR-134 | 0.65 | 1.68 | 0.02 | miR-135a / miR-99a | 0.74 | 2.65 | <0.01 | ||||||||||||||||||||||||||||||||||||||||||||||||||||||||||||||||||||||||||||||||||||||||||||
| miR-132 / miR-135a | 0.70 | 1.58 | 0.01 | ||||||||||||||||||||||||||||||||||||||||||||||||||||||||||||||||||||||||||||||||||||||||||||||||
| miR-323-3p / miR-433 + miR-382 / miR-134 + miR-132 / miR-135a | 0.93 | 0.79 | <0.01 | miR-182 / miR-491-5p + miR-135a / miR-99a | 0.73 | 1.95 | <0.01 | ||||||||||||||||||||||||||||||||||||||||||||||||||||||||||||||||||||||||||||||||||||||||||||
| 66-75 | miR-132 / miR-181a | 0.69 | 2.16 | 0.01 | miR-874 / miR-491-5p | 0.68 | 2.08 | 0.02 | |||||||||||||||||||||||||||||||||||||||||||||||||||||||||||||||||||||||||||||||||||||||||||
| miR-874 / miR-132 | 0.92 | 1.57 | <0.01 | ||||||||||||||||||||||||||||||||||||||||||||||||||||||||||||||||||||||||||||||||||||||||||||||||
| miR-127 / miR-487b | 0.70 | 2.14 | 0.01 | miR-127 / miR-433 | 0.67 | 2.11 | 0.02 | ||||||||||||||||||||||||||||||||||||||||||||||||||||||||||||||||||||||||||||||||||||||||||||
| miR-132 / miR-181a + miR-127 / miR-487b | 0.76 | 1.94 | <0.01 | miR-874 / miR-132 + miR-874 / miR-491-5p + miR-127 / miR-433 | 0.84 | 1.53 | <0.01 | ||||||||||||||||||||||||||||||||||||||||||||||||||||||||||||||||||||||||||||||||||||||||||||
| Corr: correlation; RSD: residual standard deviation; P-Val: P-value. | |||||||||||||||||||||||||||||||||||||||||||||||||||||||||||||||||||||||||||||||||||||||||||||||||||
These data demonstrated that miRNA pairs and classifiers of brain-enriched miRNAs circulating in plasma can be potentially used as aging biomarkers during specific age spans. Larger studies are needed to validate these findings and to better define the specific age spans.
Discussion
The data obtained in this feasibility study demonstrated the potential use of circulating brain-enriched miRNAs as biomarkers of brain aging. Although we did not find a brain-enriched miRNA (or a miRNA pair) whose levels in plasma correlated with the wide age range of 26-75 years, we established miRNA pairs that correlated with age in sex-stratified groups covering 10-year spans. Larger studies are needed to better define the exact age spans when the miRNA levels change.
Age-associated changes in plasma concentrations of the brain-enriched miRNAs tested in this study are likely reflective of molecular and physiological processes in the brain, such as the following: (i) miRNA expression; (ii) miRNA secretion/excretion (this possibility is discussed in the accompanying paper [62]); (iii) rate of synapse dysfunction and loss, especially in older subjects; (iv) neuronal death; (v) blood supply; and (vi) blood-brain barrier permeability. Substantially identical and overlapping patterns of decreases and increases in plasma levels of multiple brain-enriched miRNAs indirectly indicated that these are centrally regulated phenomena. The different dynamics in the plasma concentrations of brain-enriched miRNAs in female and male subjects, which were particularly prominent in the 46-65-year-old group, coincided with the changes in sex hormone levels. Maximum levels of miR-134 family members and certain other miRNAs in the plasma of female subjects were reached in the 46-55-year-old group. Interestingly, this result corresponds to perimenopause and menopause in women, when a significant drop in circulating estradiol occurs. In males, peaks in the miRNA concentrations were reached in the 56-65-year-old group, possibly reflecting slower changes in testosterone decreases. Thus, one can hypothesize that sex hormones modulate miRNA synthesis and/or secretion. This concept is in agreement with the recently reported inhibition of members of the miR-134 family (miR-127, miR-134, miR-370, miR-432) and other miRNAs by estradiol in the neonatal hypothalamus [63]. The miRNA biomarker candidates established in this study should be further evaluated alongside other molecular biomarkers of aging, such as telomerase length shortening and DNA methylation [11–13]. Larger studies, including longitudinal ones, will be necessary for determining the use of miRNA biomarker classifiers in clinical research. Further, we propose testing other circulating organ-enriched miRNAs as biomarkers of aging in respective organs and tissues. As was recently demonstrated [41–43], significant changes in the normal values of such biomarkers can signal more serious pathologic processes than aging alone.
Methods
Subjects and plasma collection
All subjects in the study were blood donors at the New York Blood Center who were without known neurodegenerative or neurological conditions. Two sets of blood collection were performed: 1) 40 subjects, 26-35 years of age (10 “young females” and 10 “young males”) and 56–65 years of age (10 “old females” and 10 “old males”); and 2) 100 subjects, 26-35, 36-45, 46-55, 56-65 and 66-75 years of age, with 10 females and 10 males in each age group.
Samples for the study were collected from blood donors at the New York Blood Center. Blood was collected in 6-ml lavender-top K2EDTA tubes and then centrifuged at 4oC at 2,000xg. Plasma was aliquoted into RNase-free, 2 ml round-bottom microcentrifuge tubes (Biotix, San Diego, CA and frozen at -80oC within 2 hours of the blood collection. The demographic characteristics of the study groups are summarized in Table 5.
Table 5. Age groups of the normal subjects analyzed in both studies.
| Sex | Age (y.o.) | Study | |
| 1st | 2nd | ||
| Male | 26-35 | 10 | 10 |
| 36-45 | - | 10 | |
| 46-55 | - | 10 | |
| 56-65 | 10 | 10 | |
| 66-75 | - | 10 | |
| Female | 26-35 | 10 | 10 |
| 36-45 | - | 10 | |
| 46-55 | - | 10 | |
| 56-65 | 10 | 10 | |
| 66-75 | - | 10 | |
Plasma RNA purification and qRT-PCR miRNA analysis
miRNA isolation and qRT-PCR analysis were performed in accordance with the following protocol (Asuragen, Austin, TX). RNA was extracted from 1 ml of plasma using a TRIzol treatment and silica (Ambion Glass Fiber Microcolumn)-binding protocol (http://asuragen.com/wp-content/uploads/2016/05/biomarkers.pdf). Single-target qRT-PCR was performed using the TaqMan Reverse Transcription Kit and miRNA-specific stem-loop primers (Thermo Fisher). QC of miRNA preps was performed by testing two ubiquitous miRNAs in each plasma prep; all samples with values within two standard deviations of the average value qualified as acceptable for analysis. miRNAs with cycle thresholds (Ct)>37 were excluded from the analysis of each respective sample. The RT step for generation of cDNA from selected miRNAs was performed in triplicate using miRNA-specific primers, and 2-µl plasma equivalents were present in the final PCR. Calibration curves for each miRNA were generated to calculate the miRNA concentration in copy numbers.
Statistical methods
All statistical calculations were performed through the use of custom software developed at DiamiR [39]. The application was designed in .NET technology using a set of .NET statistical packages. Mann-Whitney U-tests were used to evaluate the significance of the differences between the two groups of subjects in the various miRNA pairs. Receiver operating characteristic (ROC) curves were constructed, and the area under the ROC curves (AUC), sensitivity, specificity, and accuracy of the miRNA pairs and their combinations were calculated. To reduce instrumental errors, calibration curves for each miRNA were generated using synthetic miRNAs. Average miRNA concentrations and correlations between individual miRNAs or miRNA pairs and age were calculated using copy numbers. Effective pair combinations (miRNA classifiers) were defined using logistic regression. The residual standard deviation (RSD) of the linear regression was used to estimate the age prediction power of the miRNA biomarker pairs. Effective pair combinations that correlated with age were created using pair data averaging.
Acknowledgements
The authors would like to thank Drs. M. Kiefer and B. Martinez for providing helpful comments and editing the manuscript.
Conflicts of Interest
Drs. Sheinerman, Tsivinsky, and Umansky are employees and shareholders of DiamiR.
Funding
This experimental work was supported by a grant from the National Institute of Health/National Institute of Aging (Grant No. 1R43AG053116-01FAIN).
References
- 1. Xu J, Murphy SL, Kochanek KD, Arias E. Mortality in the United States, 2015. NCHS Data Brief. 2016; 267:1–8. [PubMed]
- 2. Jack CR
Jr , Holtzman DM. Biomarker modeling of Alzheimer’s disease. Neuron. 2013; 80:1347–58. https://doi.org/10.1016/j.neuron.2013.12.003 [PubMed] - 3. Aisen PS, Cummings J, Jack CR
Jr , Morris JC, Sperling R, Frölich L, Jones RW, Dowsett SA, Matthews BR, Raskin J, Scheltens P, Dubois B. On the path to 2025: understanding the Alzheimer’s disease continuum. Alzheimers Res Ther. 2017; 9:60. https://doi.org/10.1186/s13195-017-0283-5 [PubMed] - 4. Hodes RJ, Sierra F, Austad SN, Epel E, Neigh GN, Erlandson KM, Schafer MJ, LeBrasseur NK, Wiley C, Campisi J, Sehl ME, Scalia R, Eguchi S, et al. Disease drivers of aging. Ann N Y Acad Sci. 2016; 1386:45–68. https://doi.org/10.1111/nyas.13299 [PubMed]
- 5. López-Otín C, Blasco MA, Partridge L, Serrano M, Kroemer G. The hallmarks of aging. Cell. 2013; 153:1194–217. https://doi.org/10.1016/j.cell.2013.05.039 [PubMed]
- 6. Olshansky SJ, Carnes BA, Cassel C. In search of Methuselah: estimating the upper limits to human longevity. Science. 1990; 250:634–40. https://doi.org/10.1126/science.2237414 [PubMed]
- 7. Scott CT, DeFrancesco L. Selling long life. Nat Biotechnol. 2015; 33:31–40. https://doi.org/10.1038/nbt.3108 [PubMed]
- 8. Butler RN, Miller RA, Perry D, Carnes BA, Williams TF, Cassel C, Brody J, Bernard MA, Partridge L, Kirkwood T, Martin GM, Olshansky SJ. New model of health promotion and disease prevention for the 21st century. BMJ. 2008; 337:a399. https://doi.org/10.1136/bmj.a399 [PubMed]
- 9. Longo VD, Antebi A, Bartke A, Barzilai N, Brown-Borg HM, Caruso C, Curiel TJ, de Cabo R, Franceschi C, Gems D, Ingram DK, Johnson TE, Kennedy BK, et al. Interventions to Slow Aging in Humans: Are We Ready? Aging Cell. 2015; 14:497–510. https://doi.org/10.1111/acel.12338 [PubMed]
- 10. Kennedy BK, Berger SL, Brunet A, Campisi J, Cuervo AM, Epel ES, Franceschi C, Lithgow GJ, Morimoto RI, Pessin JE, Rando TA, Richardson A, Schadt EE, et al. Geroscience: linking aging to chronic disease. Cell. 2014; 159:709–13. https://doi.org/10.1016/j.cell.2014.10.039 [PubMed]
- 11. Bürkle A, Moreno-Villanueva M, Bernhard J, Blasco M, Zondag G, Hoeijmakers JH, Toussaint O, Grubeck-Loebenstein B, Mocchegiani E, Collino S, Gonos ES, Sikora E, Gradinaru D, et al. MARK-AGE biomarkers of ageing. Mech Ageing Dev. 2015; 151:2–12. https://doi.org/10.1016/j.mad.2015.03.006 [PubMed]
- 12. López-Otín C, Blasco MA, Partridge L, Serrano M, Kroemer G. The hallmarks of aging. Cell. 2013; 153:1194–217. https://doi.org/10.1016/j.cell.2013.05.039 [PubMed]
- 13. Scott CT, DeFrancesco L. Selling long life. Nat Biotechnol. 2015; 33:31–40. https://doi.org/10.1038/nbt.3108 [PubMed]
- 14. Deak F, Freeman WM, Ungvari Z, Csiszar A, Sonntag WE. Recent Developments in Understanding Brain Aging: Implications for Alzheimer’s Disease and Vascular Cognitive Impairment. J Gerontol A Biol Sci Med Sci. 2016; 71:13–20. https://doi.org/10.1093/gerona/glv206 [PubMed]
- 15. Lu AT, Hannon E, Levine ME, Crimmins EM, Lunnon K, Mill J, Geschwind DH, Horvath S. Genetic architecture of epigenetic and neuronal ageing rates in human brain regions. Nat Commun. 2017; 8:15353. https://doi.org/10.1038/ncomms15353 [PubMed]
- 16. Delgado-Morales R, Agís-Balboa RC, Esteller M, Berdasco M. Epigenetic mechanisms during ageing and neurogenesis as novel therapeutic avenues in human brain disorders. Clin Epigenetics. 2017; 9:67. https://doi.org/10.1186/s13148-017-0365-z [PubMed]
- 17. http://www.afar.org/docs/migrated/111213_BIOMARKERS_OF_AGING-web.pdf.
- 18. Griffiths-Jones S, Grocock RJ, van Dongen S, Bateman A, Enright AJ. miRBase: microRNA sequences, targets and gene nomenclature. Nucleic Acids Res. 2006; 34:D140–44. https://doi.org/10.1093/nar/gkj112 [PubMed]
- 19. Bartel DP. MicroRNAs: target recognition and regulatory functions. Cell. 2009; 136:215–33. https://doi.org/10.1016/j.cell.2009.01.002 [PubMed]
- 20. Hua YJ, Tang ZY, Tu K, Zhu L, Li YX, Xie L, Xiao HS. Identification and target prediction of miRNAs specifically expressed in rat neural tissue. BMC Genomics. 2009; 10:214. https://doi.org/10.1186/1471-2164-10-214 [PubMed]
- 21. Liang Y, Ridzon D, Wong L, Chen C. Characterization of microRNA expression profiles in normal human tissues. BMC Genomics. 2007; 8:166. https://doi.org/10.1186/1471-2164-8-166 [PubMed]
- 22. Landgraf P, Rusu M, Sheridan R, Sewer A, Iovino N, Aravin A, Pfeffer S, Rice A, Kamphorst AO, Landthaler M, Lin C, Socci ND, Hermida L, et al. A mammalian microRNA expression atlas based on small RNA library sequencing. Cell. 2007; 129:1401–14. https://doi.org/10.1016/j.cell.2007.04.040 [PubMed]
- 23. Lee EJ, Baek M, Gusev Y, Brackett DJ, Nuovo GJ, Schmittgen TD. Systematic evaluation of microRNA processing patterns in tissues, cell lines, and tumors. RNA. 2008; 14:35–42. https://doi.org/10.1261/rna.804508 [PubMed]
- 24. Schratt GM, Tuebing F, Nigh EA, Kane CG, Sabatini ME, Kiebler M, Greenberg ME. A brain-specific microRNA regulates dendritic spine development. Nature. 2006; 439:283–89. https://doi.org/10.1038/nature04367 [PubMed]
- 25. Lugli G, Torvik VI, Larson J, Smalheiser NR. Expression of microRNAs and their precursors in synaptic fractions of adult mouse forebrain. J Neurochem. 2008; 106:650–61. https://doi.org/10.1111/j.1471-4159.2008.05413.x [PubMed]
- 26. Kye MJ, Liu T, Levy SF, Xu NL, Groves BB, Bonneau R, Lao K, Kosik KS. Somatodendritic microRNAs identified by laser capture and multiplex RT-PCR. RNA. 2007; 13:1224–34. https://doi.org/10.1261/rna.480407 [PubMed]
- 27. Cougot N, Bhattacharyya SN, Tapia-Arancibia L, Bordonné R, Filipowicz W, Bertrand E, Rage F. Dendrites of mammalian neurons contain specialized P-body-like structures that respond to neuronal activation. J Neurosci. 2008; 28:13793–804. https://doi.org/10.1523/JNEUROSCI.4155-08.2008 [PubMed]
- 28. Schratt G. microRNAs at the synapse. Nat Rev Neurosci. 2009; 10:842–49. https://doi.org/10.1038/nrn2763 [PubMed]
- 29. Pigati L, Yaddanapudi SC, Iyengar R, Kim DJ, Hearn SA, Danforth D, Hastings ML, Duelli DM. Selective release of microRNA species from normal and malignant mammary epithelial cells. PLoS One. 2010; 5:e13515. https://doi.org/10.1371/journal.pone.0013515 [PubMed]
- 30. Palma J, Yaddanapudi SC, Pigati L, Havens MA, Jeong S, Weiner GA, Weimer KM, Stern B, Hastings ML, Duelli DM. MicroRNAs are exported from malignant cells in customized particles. Nucleic Acids Res. 2012; 40:9125–38. https://doi.org/10.1093/nar/gks656 [PubMed]
- 31. Bellingham SA, Coleman BM, Hill AF. Small RNA deep sequencing reveals a distinct miRNA signature released in exosomes from prion-infected neuronal cells. Nucleic Acids Res. 2012; 40:10937–49. https://doi.org/10.1093/nar/gks832 [PubMed]
- 32. Turchinovich A, Tonevitsky AG, Burwinkel B. Extracellular miRNA: A Collision of Two Paradigms. Trends Biochem Sci. 2016; 41:883–92. https://doi.org/10.1016/j.tibs.2016.08.004 [PubMed]
- 33. Chevillet JR, Kang Q, Ruf IK, Briggs HA, Vojtech LN, Hughes SM, Cheng HH, Arroyo JD, Meredith EK, Gallichotte EN, Pogosova-Agadjanyan EL, Morrissey C, Stirewalt DL, et al. Quantitative and stoichiometric analysis of the microRNA content of exosomes. Proc Natl Acad Sci USA. 2014; 111:14888–93. https://doi.org/10.1073/pnas.1408301111 [PubMed]
- 34. Matsuzaki J, Ochiya T. Circulating microRNAs and extracellular vesicles as potential cancer biomarkers: a systematic review. Int J Clin Oncol. 2017; 22:413–20. https://doi.org/10.1007/s10147-017-1104-3 [PubMed]
- 35. Olivieri F, Capri M, Bonafè M, Morsiani C, Jung HJ, Spazzafumo L, Viña J, Suh Y. Circulating miRNAs and miRNA shuttles as biomarkers: perspective trajectories of healthy and unhealthy aging. Mech Ageing Dev. 2017; 165:162–70. https://doi.org/10.1016/j.mad.2016.12.004 [PubMed]
- 36. Weiland M, Gao XH, Zhou L, Mi QS. Small RNAs have a large impact: circulating microRNAs as biomarkers for human diseases. RNA Biol. 2012; 9:850–59. https://doi.org/10.4161/rna.20378 [PubMed]
- 37. Hoy AM, Buck AH. Extracellular small RNAs: what, where, why? Biochem Soc Trans. 2012; 40:886–90. https://doi.org/10.1042/BST20120019 [PubMed]
- 38. Kosaka N, Yoshioka Y, Hagiwara K, Tominaga N, Katsuda T, Ochiya T. Trash or Treasure: extracellular microRNAs and cell-to-cell communication. Front Genet. 2013; 4:173. https://doi.org/10.3389/fgene.2013.00173 [PubMed]
- 39. Sheinerman KS, Tsivinsky VG, Crawford F, Mullan MJ, Abdullah L, Umansky SR. Plasma microRNA biomarkers for detection of mild cognitive impairment. Aging (Albany NY). 2012; 4:590–605. https://doi.org/10.18632/aging.100486 [PubMed]
- 40. Sheinerman KS, Tsivinsky VG, Abdullah L, Crawford F, Umansky SR. Plasma microRNA biomarkers for detection of mild cognitive impairment: biomarker validation study. Aging (Albany NY). 2013; 5:925–38. https://doi.org/10.18632/aging.100624 [PubMed]
- 41. Sheinerman KS, Tsivinsky VG, Umansky SR. Analysis of organ-enriched microRNAs in plasma as an approach to development of Universal Screening Test: feasibility study. J Transl Med. 2013; 11:304–15. https://doi.org/10.1186/1479-5876-11-304 [PubMed]
- 42. Sheinerman KS, Umansky SR. Circulating cell-free microRNA as biomarkers for screening, diagnosis and monitoring of neurodegenerative diseases and other neurologic pathologies. Front Cell Neurosci. 2013; 7:150. https://doi.org/10.3389/fncel.2013.00150 [PubMed]
- 43. Sheinerman KS, Umansky S. Universal screening test based on analysis of circulating organ-enriched microRNAs: a novel approach to diagnostic screening. Expert Rev Mol Diagn. 2015; 15:329–38. https://doi.org/10.1586/14737159.2014.973858 [PubMed]
- 44. Umansky S, Sheinerman K. Methods of using small RNA from bodily fluids for diagnosis and monitoring of neurodegenerative diseases. 2014; US Patent 8,648,017.
- 45. Guay C, Menoud V, Rome S, Regazzi R. Horizontal transfer of exosomal microRNAs transduce apoptotic signals between pancreatic beta-cells. Cell Commun Signal. 2015; 13:17. https://doi.org/10.1186/s12964-015-0097-7 [PubMed]
- 46. Singh R, Pochampally R, Watabe K, Lu Z, Mo YY. Exosome-mediated transfer of miR-10b promotes cell invasion in breast cancer. Mol Cancer. 2014; 13:256. https://doi.org/10.1186/1476-4598-13-256 [PubMed]
- 47. Silva M, Melo SA. Non-coding RNAs in Exosomes: New Players in Cancer Biology. Curr Genomics. 2015; 16:295–303. https://doi.org/10.2174/1389202916666150707154719 [PubMed]
- 48. Taylor MA. Circulating MicroRNAs as Biomarkers and Mediators of Cell-Cell Communication in Cancer. Biomedicines. 2015; 3:270–81. https://doi.org/10.3390/biomedicines3040270 [PubMed]
- 49. Takahashi RU, Prieto-Vila M, Hironaka A, Ochiya T. The role of extracellular vesicle microRNAs in cancer biology. Clin Chem Lab Med. 2017; 55:648–56. https://doi.org/10.1515/cclm-2016-0708 [PubMed]
- 50. Zhang Y, Kim MS, Jia B, Yan J, Zuniga-Hertz JP, Han C, Cai D. Hypothalamic stem cells control ageing speed partly through exosomal miRNAs. Nature. 2017; 548:52–57. https://doi.org/10.1038/nature23282 [PubMed]
- 51. Olsen L, Klausen M, Helboe L, Nielsen FC, Werge T. MicroRNAs show mutually exclusive expression patterns in the brain of adult male rats. PLoS One. 2009; 4:e7225. https://doi.org/10.1371/journal.pone.0007225 [PubMed]
- 52. Rao YS, Mott NN, Wang Y, Chung WC, Pak TR. MicroRNAs in the aging female brain: a putative mechanism for age-specific estrogen effects. Endocrinology. 2013; 154:2795–806. https://doi.org/10.1210/en.2013-1230 [PubMed]
- 53. Jovičić A, Roshan R, Moisoi N, Pradervand S, Moser R, Pillai B, Luthi-Carter R. Comprehensive expression analyses of neural cell-type-specific miRNAs identify new determinants of the specification and maintenance of neuronal phenotypes. J Neurosci. 2013; 33:5127–37. https://doi.org/10.1523/JNEUROSCI.0600-12.2013 [PubMed]
- 54. Ziats MN, Rennert OM. Identification of differentially expressed microRNAs across the developing human brain. Mol Psychiatry. 2014; 19:848–52. https://doi.org/10.1038/mp.2013.93 [PubMed]
- 55. Ludwig N, Leidinger P, Becker K, Backes C, Fehlmann T, Pallasch C, Rheinheimer S, Meder B, Stähler C, Meese E, Keller A. Distribution of miRNA expression across human tissues. Nucleic Acids Res. 2016; 44:3865–77. https://doi.org/10.1093/nar/gkw116 [PubMed]
- 56. de Rie D, Abugessaisa I, Alam T, Arner E, Arner P, Ashoor H, Åström G, Babina M, Bertin N, Burroughs AM, Carlisle AJ, Daub CO, Detmar M, et al, and FANTOM Consortium. An integrated expression atlas of miRNAs and their promoters in human and mouse. Nat Biotechnol. 2017; 35:872–78. https://doi.org/10.1038/nbt.3947 [PubMed]
- 57. https://ccb-web.cs.uni-saarland.de/tissueatlas/.
- 58. Kadri F, LaPlante A, De Luca M, Doyle L, Velasco-Gonzalez C, Patterson JR, Molina PE, Nelson S, Zea AH, Parsons CH, Peruzzi F. Defining plasma microRNAs associated with cognitive impairment in HIV-infected patients. J Cell Physiol. 2016; 231:829–36. https://doi.org/10.1002/jcp.25131 [PubMed]
- 59. Boeri M, Verri C, Conte D, Roz L, Modena P, Facchinetti F, Calabrò E, Croce CM, Pastorino U, Sozzi G. MicroRNA signatures in tissues and plasma predict development and prognosis of computed tomography detected lung cancer. Proc Natl Acad Sci USA. 2011; 108:3713–18. https://doi.org/10.1073/pnas.1100048108 [PubMed]
- 60. Hennessey PT, Sanford T, Choudhary A, Mydlarz WW, Brown D, Adai AT, Ochs MF, Ahrendt SA, Mambo E, Califano JA. Serum microRNA biomarkers for detection of non-small cell lung cancer. PLoS One. 2012; 7:e32307. https://doi.org/10.1371/journal.pone.0032307 [PubMed]
- 61. Matthaei H, Wylie D, Lloyd MB, Dal Molin M, Kemppainen J, Mayo SC, Wolfgang CL, Schulick RD, Langfield L, Andruss BF, Adai AT, Hruban RH, Szafranska-Schwarzbach AE, Maitra A. miRNA biomarkers in cyst fluid augment the diagnosis and management of pancreatic cysts. Clin Cancer Res. 2012; 18:4713–24. https://doi.org/10.1158/1078-0432.CCR-12-0035 [PubMed]
- 62. Umansky S. Aging and aging-associated diseases: A microRNA-based endocrine regulation hypothesis. Aging (Albany NY). Epub ahead of print.
- 63. Morgan CP, Bale TL. Sex differences in microRNA-mRNA networks: examination of novel epigenetic programming mechanisms in the sexually dimorphic neonatal hypothalamus. Biol Sex Differ. 2017; 8:27. https://doi.org/10.1186/s13293-017-0149-3 [PubMed]