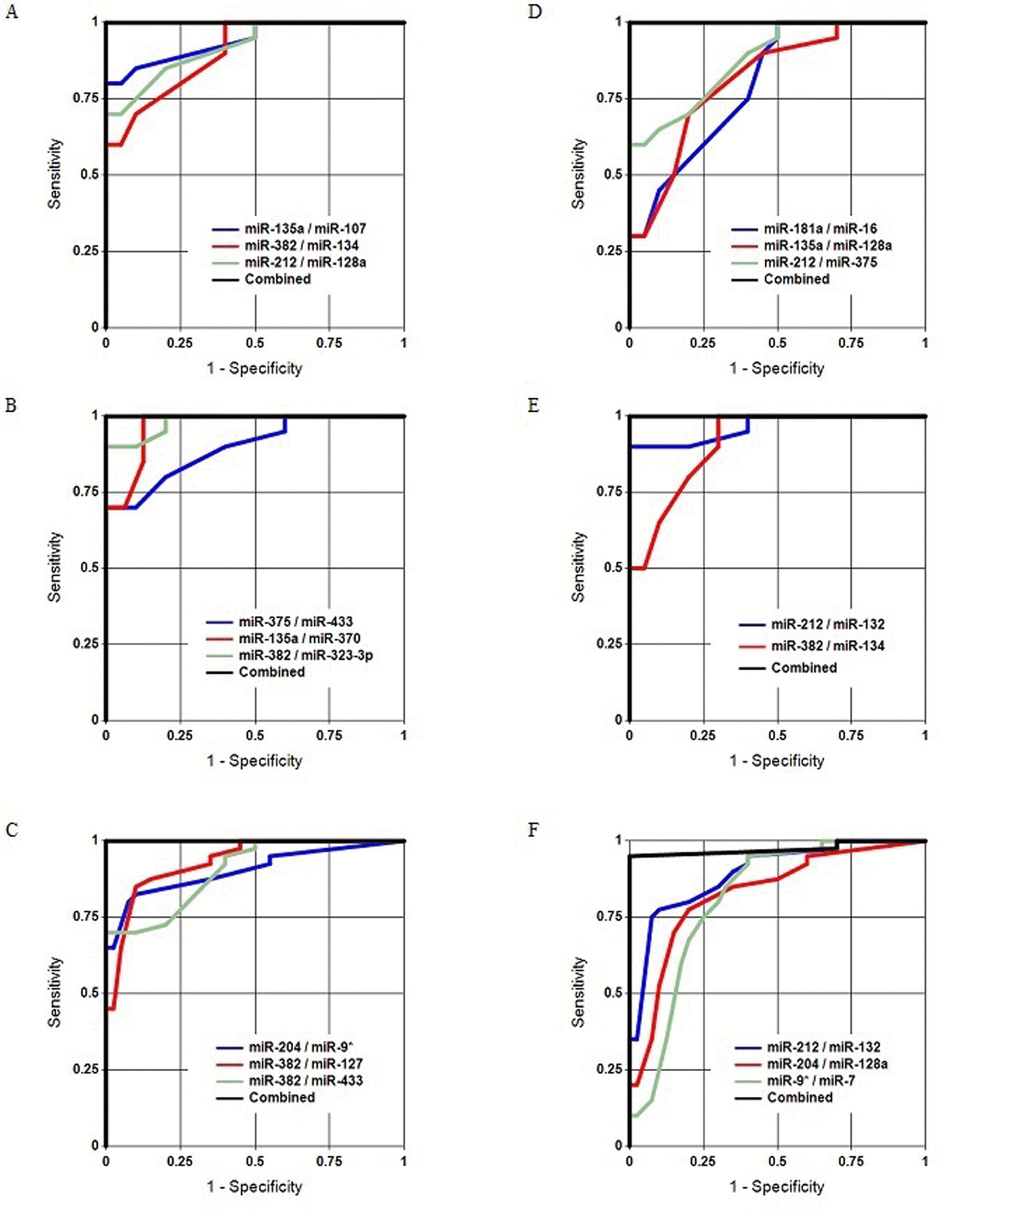
Figure 1.Separation of the analyzed groups in Study 1. (A, B, C) Old males vs. young males, old females vs. young females, and all old subjects vs. all young subjects, respectively. (D, E, F) Young females vs. young males, old females vs. old males, and all females vs. all males, respectively.