


Introduction
Fluorine is one of the essential trace elements for human health, and is widely used as a cofactor in medicine, e.g., anesthetics, antibiotics, anti-cancer and anti-inflammatory agents, and psychopharmaceuticals [1,2]. However, excessive fluoride intake can cause tissue damage and lead to multiple organ dysfunction [3,4], which depends not only on the concentration and exposed duration [5], but also on the absorption capacity, age, and nutritional status of the individual [6]. It has been demonstrated that fluoride can induce skeletal and non-skeletal fluorosis [4,7–9]. We have also confirmed that sodium fluoride (NaF) inhibits cell proliferation and induces cell apoptosis in splenic lymphocytes from mice in vivo and in vitro [10–14], and causes blood immunotoxicity from mice [15]. Other studies have also shown the fluoride-caused cytotoxicity, apoptosis and DNA damage in human and animals [16–19].
Autophagy is a degradative process by which cytoplasmic constituents of cells are engulfed within a cytoplasmic vacuole and delivered to the lysosome for degradation [20]. Autophagy plays key roles in cellular homeostasis during embryonic development, postnatal cell survival, and death [21]. Moreover, autophagy can be induced by various stress stimuli, such as oxidative stress and environmental factors [22,23]. Fluoride, as an environmental and dietary factor, had been reported to induce oxidative stress [24] and endoplasmic reticulum stress [14] in the spleen. Several studies have shown that fluoride activates autophagy via diverse signaling [25–27] in different cell lines [26,28,29], and fluoride exposure is associated with autophagy and autophagy exerts its miscellaneous function to protect or impair organism [30,31]. However, the molecular mechanism of autophagy induced by fluoride in spleen is still poorly understood. Also, there are no reports focused on fluoride-induced autophagy in the animal and human spleen at present.
In this study, mice were used to explore how sodium fluoride (NaF) induced splenic autophagy. And we demonstrated that NaF changed genes and proteins expressions of autophagy markers, including Beclin1, autophagy-related protein (Atg):16-like1(Atg16L1), 12 (Atg12), 5 (Atg5), microtubuleassociatedprotein1 light chain 3 (LC3) and p62 (SQSTM1) and increased numbers of autophagosomes or autolysosomes, and LC3 brown punctate staining in spleen by transmission electron microscopy (TEM) and by immunohistochemistry (IHC), respectively.
Further, the critical molecular regulator genes, including phosphorylations of mammalian targets of rapamycin (p-mTOR), phosphorylations of unc-51 like kinase 1(p-ULK1), Atg13, phosphatidylinositol 3-kinase (PI3K) and protein kinase B, PKB (Akt) in spleen were investigated to elucidate the association between fluoride-induced autophagy and the regulation of mTOR phosphorylation. The results may provide new insights for further understanding the role of autophagy in fluoride-induced splenic damage and toxicity.
Results
Effects of NaF on morphological changes in mice spleen
Detection of autophagosomes and autolysosome in spleen
The splenic ultrastructure determined by TEM (Figure1) demonstrated that numbers of autophagosomes or autolysosomes were distinctly increased in NaF-treated groups when compared to the control group at 42 days of the experiment (Figure 1B-1D).
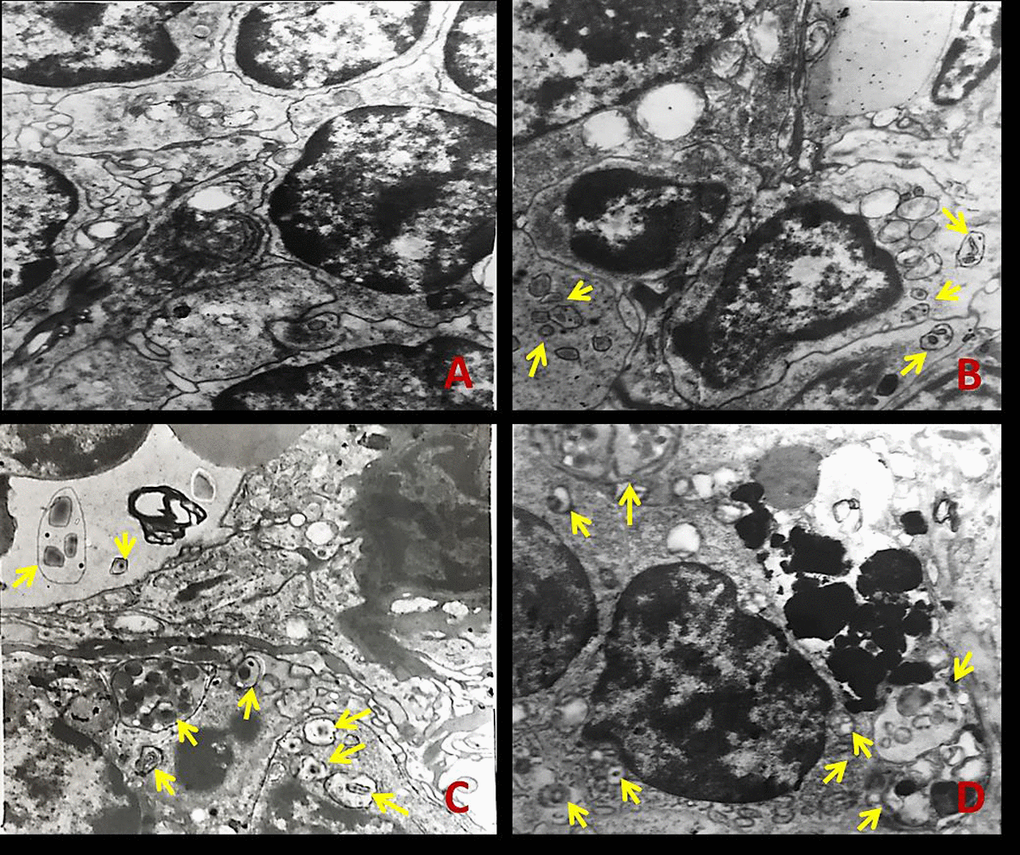
Figure 1. The ultrastructure of spleen tissue by transmission electron microscopy (TEM) at 42 days of the experiment. The yellow arrows represent autophagosome or autolysosome. (A) Control group; (B) 12 mg/kg group; (C) 24 mg/kg group; (D) 48 mg/kg group.
Detection of autophagy marker LC3 in spleen
Immunohistochemistry for LC3 was showed in Figures 2 and 3. In control groups, there was no punctate staining (Figures 2A and 3A). In NaF-treatment groups, the numbers of brown punctate staining were obviously increased, especially at 42 days of the experiment (Figures 2B-2D and 3B-3D).
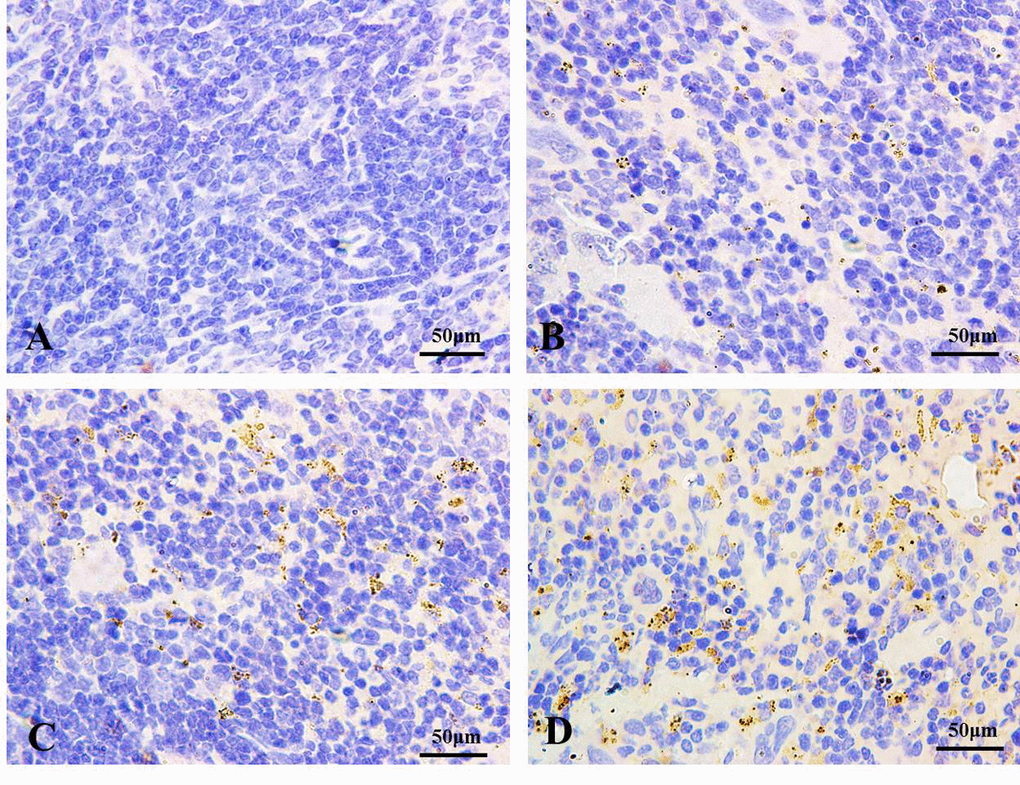
Figure 2. The autophagy marker LC3 detection by immunohistochemistry (IHC) at 21 days of the experiment (100X). The brown punctate staining represents LC3 expression. (A) Control group; (B) 12 mg/kg group; (C) 24 mg/kg group; (D) 48 mg/kg group.
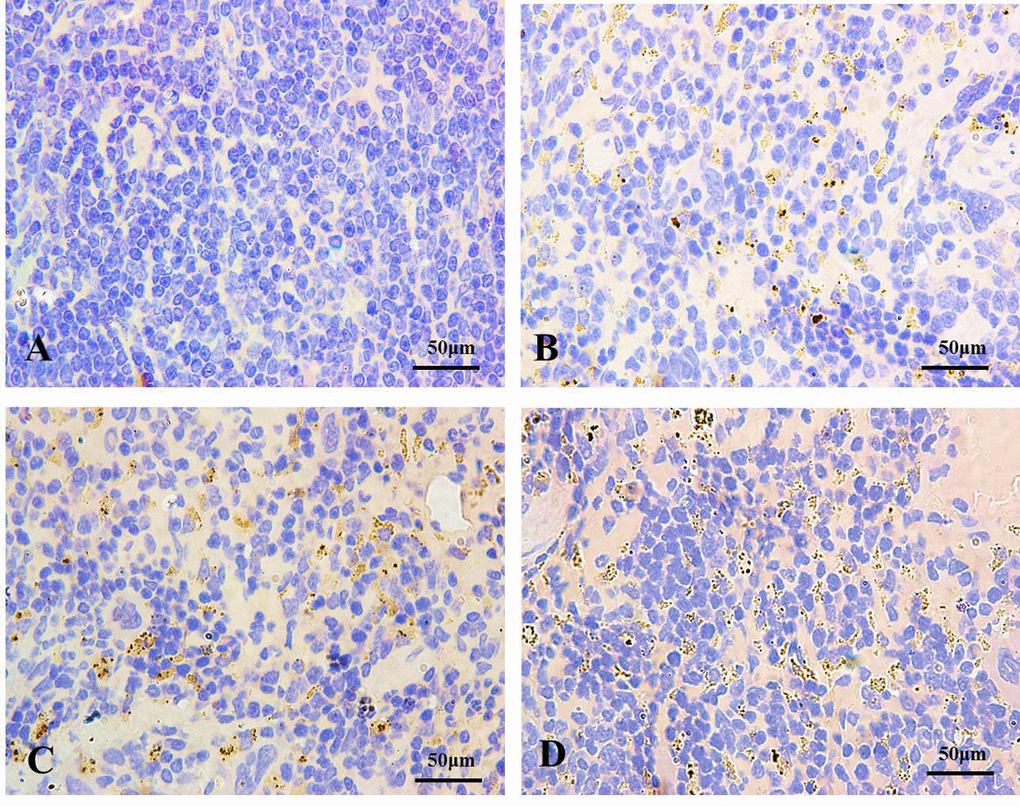
Figure 3. The autophagy marker LC3 detection by immunohistochemistry (IHC) at 42 days of the experiment (100X). The brown punctate staining represents LC3 expression. (A) Control group; (B) 12 mg/kg group; (C) 24 mg/kg group; (D) 48 mg/kg group.
Effects of NaF on autophagy markers mRNA and protein expression in spleen
Changes of mRNA and protein expression levels of LC3, p62 and Beclin1 in spleen
The mRNA and protein levels of autophagy markers, e.g LC3, Beclin1, and p62 were examined by qRT-PCR and WB (Figures 4-6).
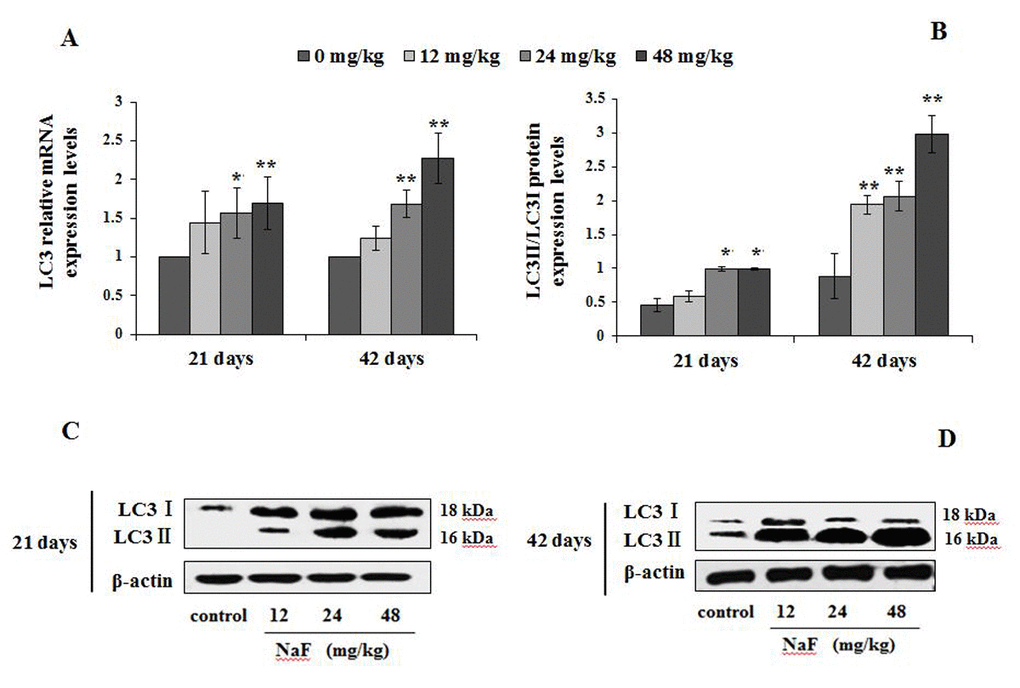
Figure 4. Changes of mRNA and protein expression levels of LC3 in the spleen at 21 and 42 days of the experiment. (A) The relative mRNA expression levels. (B) The ratio of LC3II/LC3I protein expression. (C, D) The western blot assay. Data are presented with the mean + standard deviation (n=8), *p < 0.05, compared with the control group; **p < 0.01, compared with the control group.
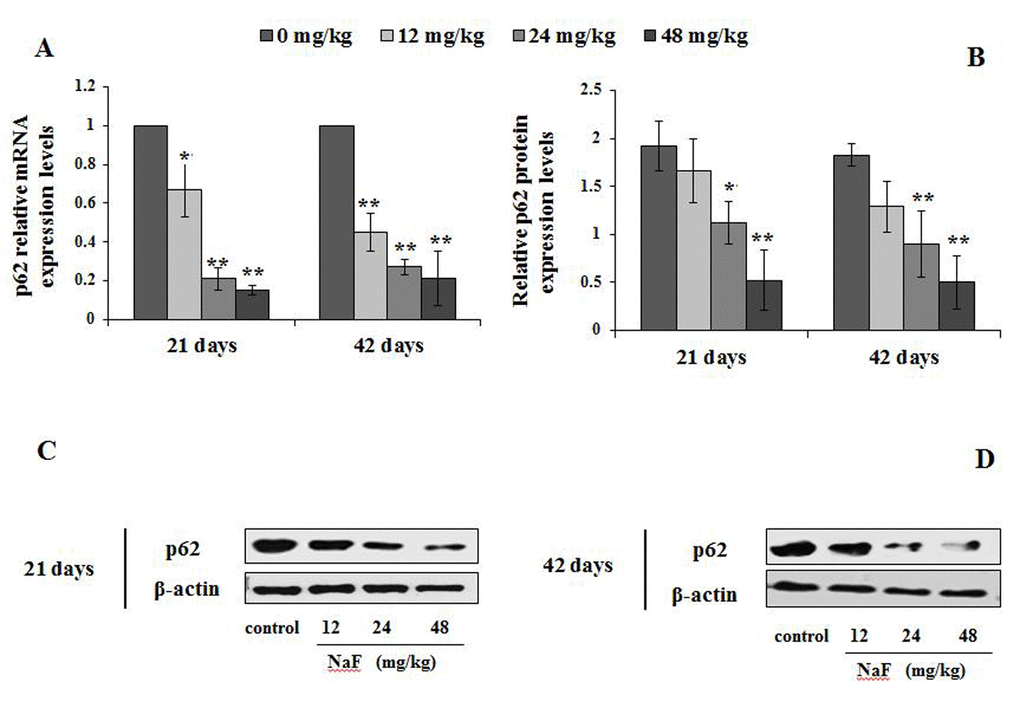
Figure 5. Changes of mRNA and protein expression levels of p62 in the spleen at 21 and 42 days of the experiment. (A) The relative mRNA expression levels. (B) The relative protein expression levels. (C, D) The western blot assay. Data are presented with the mean + standard deviation (n=8), *p < 0.05, compared with the control group; **p < 0.01, compared with the control group.
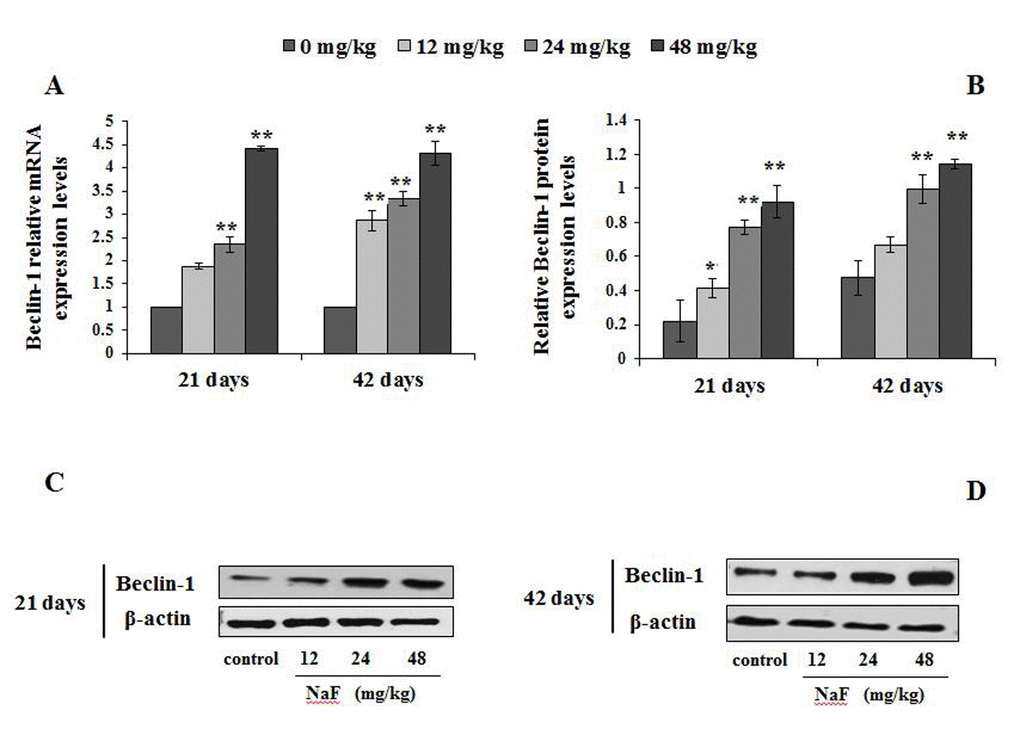
Figure 6. Changes of mRNA and protein expression levels of Beclin-1 in the spleen at 21 and 42 days of the experiment. (A) The relative mRNA expression levels. (B) The relative protein expression levels. (C, D) The western blot assay. Data are presented with the mean + standard deviation (n=8), *p < 0.05, compared with the control group; **p < 0.01, compared with the control group.
A significantly increase in the LC3 mRNA expression levels were noted in splenocytes of the 24 and 48 mg/kg groups (P<0.05 or p<0.01) at 21 and 42 days of the experiment (Figure 4A). The ratio of LC3II/LC3I protein expression (Figure 4B-4D) was increased significantly in 24 and 48 mg/kg groups (P<0.05) at 21 days of age, and in the three NaF-treated groups (P<0.01) at 42 days of the experiment when compared to control group.
The p62 mRNA expression levels were significantly declined (P<0.05 or P<0.01) in the 12, 24 and 48 mg/kg groups (Figure 5A), and its protein expression levels were significantly decreased (P<0.05 or P<0.01) in 24 and 48 mg/kg groups (Figure 5B-5D) at 21 days and 42 days of the experiment when compared to the control group.
Figure 6A-6D showed the mRNA and protein expression levels of Beclin1. From Figure 6A, the Beclin1 mRNA expression levels were higher (P<0.05 or P<0.01) in the 12, 24 and 48 mg/kg groups than those in the control group from 21 to 42 days of the experiment. Similarly, Beclin1 protein expression levels were markedly increased (P<0.05 or P<0.01) in the 12, 24 and 48 mg/kg groups (Figure 6B-6D).
Changes of mRNA and protein expression levels of Atg12, Atg5 and Atg16L1 in spleen
Next, we analyzed other autophagy markers including Atg12, Atg5 and Atg16L1, which also serve as a critical node in the autophagy signaling pathway (Figures 7-9).
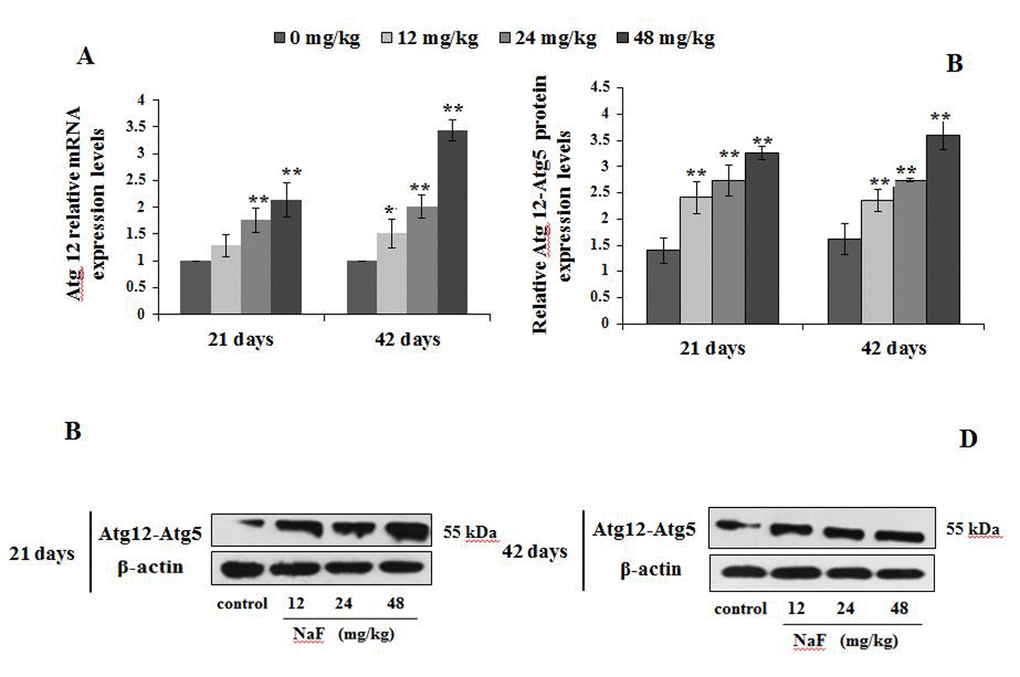
Figure 7. Changes of mRNA and protein expression levels of Atg12 in the spleen at 21 and 42 days of the experiment. (A) The relative mRNA expression levels. (B) The relative protein expression levels of Atg12-Atg5. (C, D) The western blot assay of Atg12-Atg5. Data are presented with the mean + standard deviation (n=8), *p < 0.05, compared with the control group; **p < 0.01, compared with the control group.
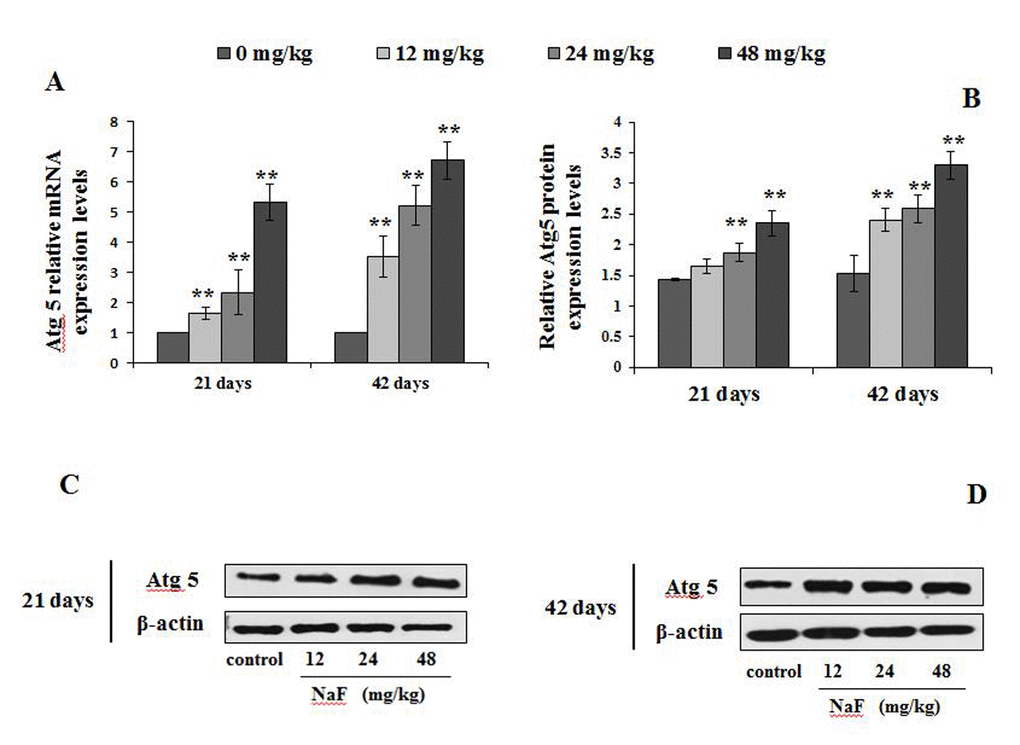
Figure 8. Changes of mRNA and protein expression levels of Atg5 in the spleen at 21 and 42 days of the experiment. (A) The relative mRNA expression levels. (B) The relative protein expression levels. (C, D) The western blot assay. Data are presented with the mean + standard deviation (n=8), *p < 0.05, compared with the control group; **p < 0.01, compared with the control group.
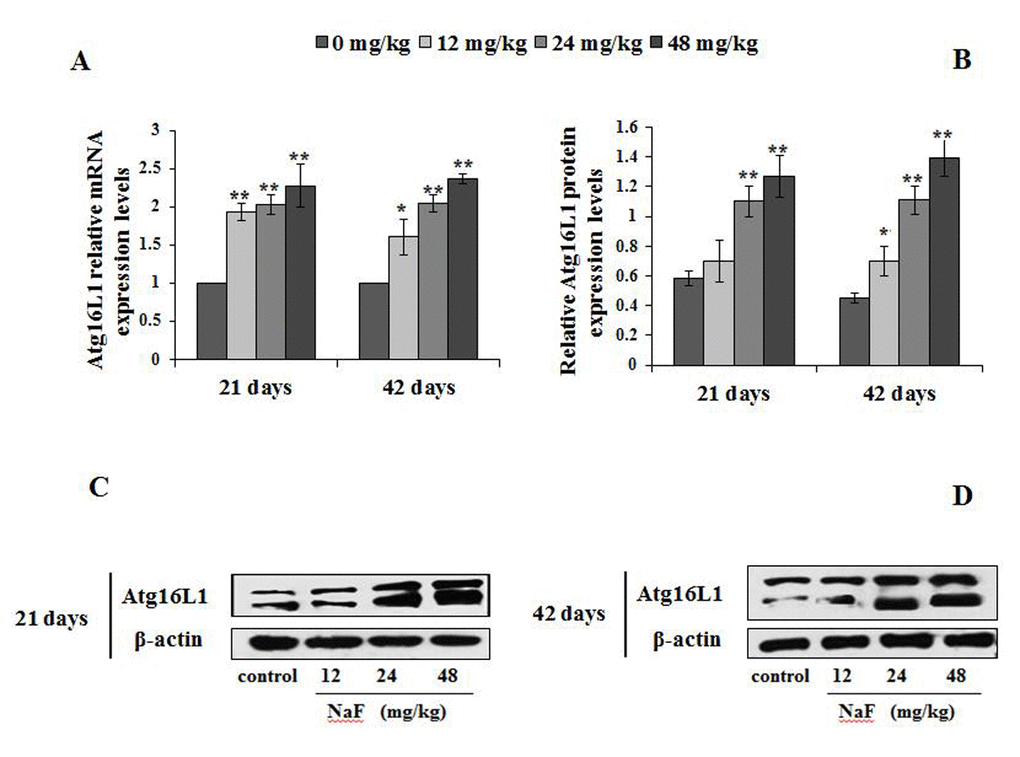
Figure 9. Changes of mRNA and protein expression levels of Atg16L1 in the spleen at 21 and 42 days of the experiment. (A) The relative mRNA expression levels. (B) The relative protein expression levels. (C, D) The western blot assay. Data are presented with the mean + standard deviation (n=8), *p < 0.05, compared with the control group; **p < 0.01, compared with the control group.
We observed higher mRNA expression levels of Atg12 and Atg5 in the 12, 24 and 48 mg/kg groups at We observed higher mRNA expression levels of Atg12 and Atg5 in 21 and 42 days of the experiment than those in the control group (P<0.01 or P<0.05; Figures 7A and 8A). Additionally, Atg12-Atg5 complex protein expression levels in the three NaF-treated groups were significantly increased (P<0.01) at both 21 and 42 days of age in comparison to the control group (Figure 7B-7D). Similarly, NaF treatment markedly increased (P<0.01) the Atg5 protein expression levels in the 24 and 48 mg/kg at 21 days of the experiment, and in the 12, 24 and 48 mg/kg groups at 42 days of the experiment when compared to the control group (Figure 8B-8D).
In Figure 9A, the Atg16L1mRNA expression levels were significantly increased (P<0.05 or P<0.01) in the 12, 24 and 48 mg/kg groups from 21 to 42 days of the experiment when compared to the control group. Moreover, Atg16L1 protein expression levels were higher (P<0.01) in the 24 and 48 mg/kg groups at 21 days of the experiment, and in the 12, 24 and 48 mg/kg groups at 42 day of the experiment than those in the control group (Figure 9B-9D).
Effects of NaF on autophagy pathway regulators mRNA and protein expression in spleen
Changes of mRNA and protein expression levels of phosphorylated mTOR in spleen
Since the mTOR plays a key role in driving autophagy, we determined the expression of phosphorylated mTOR (Ser2448) and total mTOR in the spleen. When compared to the control group, the mRNA expression levels of mTOR were markedly decreased (P<0.05 or P<0.01) in the 24 and 48 mg/kg groups (Figure 10A). Furthermore, the protein expression levels of Ser2448 p-mTOR and total mTOR were significantly reduced (P<0.05 or P<0.01) in the 24 and 48 mg/kg groups (Figure 10B-10D).
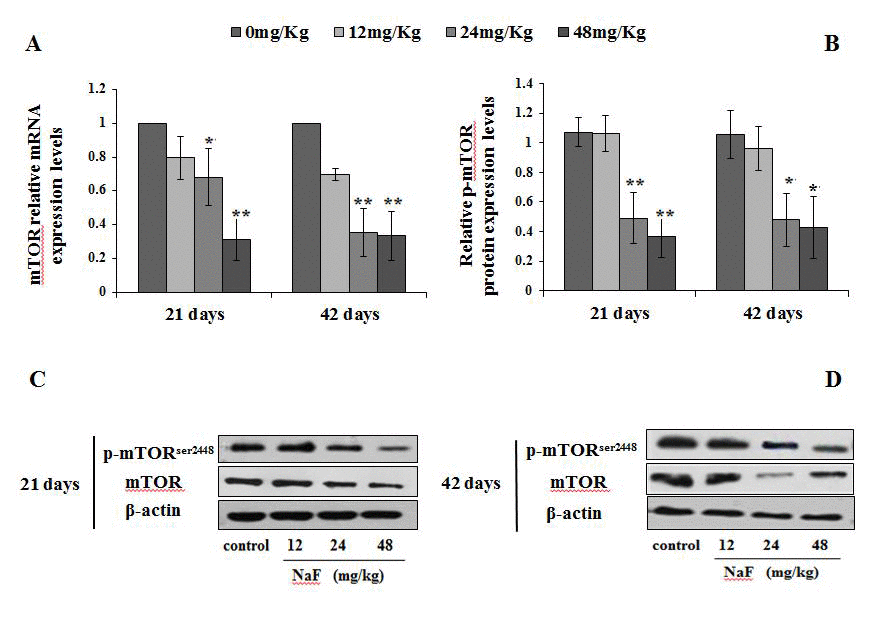
Figure 10. Changes of mRNA and protein expression levels of p-mTOR in the spleen at 21 and 42 days of the experiment. (A) The relative mRNA expression levels. (B) The relative protein expression levels. (C, D) The western blot assay. Data are presented with the mean + standard deviation (n=8), *p < 0.05, compared with the control group; **p < 0.01, compared with the control group.
Changes of mRNA and protein expression levels of mTOR regulation-related genes in spleen
We then investigated the mTOR regulation-associated genes, including ULK1, PI3K, Akt and Atg13. The findings showed that ULK1 and Atg13 mRNA expression levels were significantly increased (P<0.01 or P<0.05) in the 12, 24 and 48 mg/kg groups at 21 and 42 days of the experiment (Figure 11A, 11D).
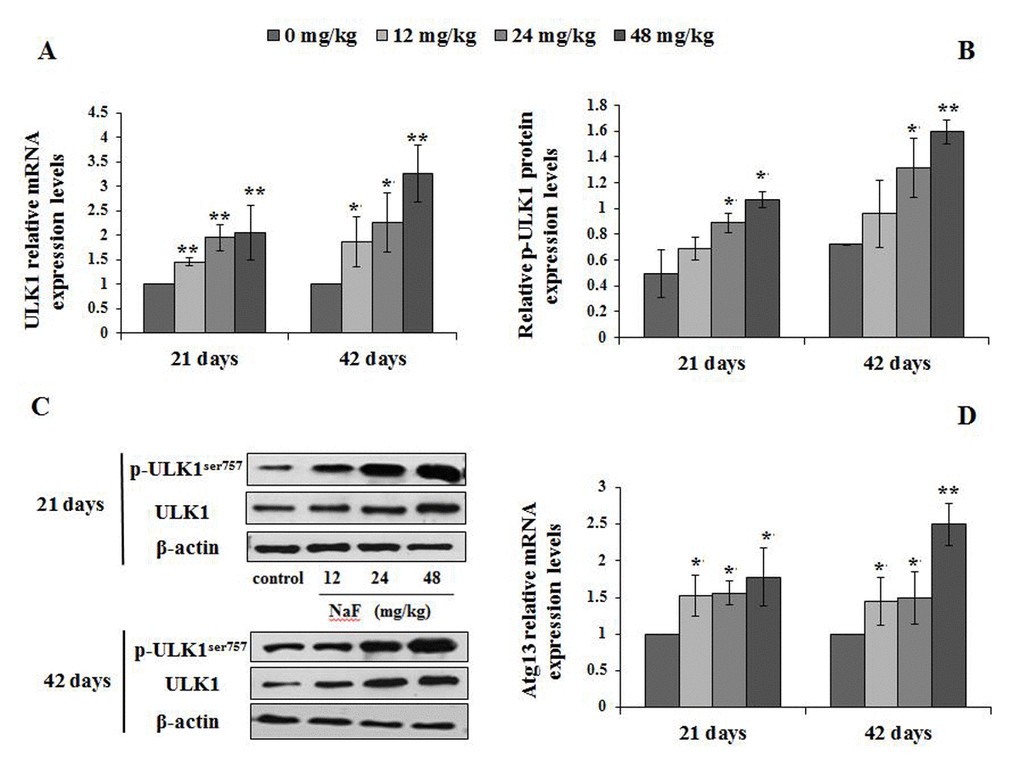
Figure 11. Changes of ULK1 mRNA and protein expression levels and Atg13 mRNA levels in the spleen at 21 and 42 days of the experiment. (A) The relative mRNA expression levels of ULK1. (B) The relative protein expression levels of ULK1. (C) The western blot assay of ULK1. (D) The relative mRNA expression levels of Atg13. Data are presented with the mean + standard deviation (n=8), *p < 0.05, compared with the control group; **p < 0.01, compared with the control group.
The p-ULK1 protein expression levels were significantly increased (P<0.05 or P<0.01) in the 24 and 48 mg/kg groups at 21 and 42 days of the experiment (Figure 11B-11C). At the same time, the PI3K mRNA and protein expression levels were significantly decreased (P<0.01) in the 24 and 48 mg/kg groups at 21 and 42 days of the experiment when compared to the control group (Figure 12). In addition, the Akt mRNA expression levels were significantly decreased (P<0.01 or P<0.05) in NaF-treated groups at 21 and 42 days of the experiment. Akt protein expression levels were significantly reduced (P<0.01or P<0.05) in 24 and 48 mg/kg groups at 21 days of the experiment and in 12, 24 and 48 mg/kg groups at 42 days of the experiment (Figure 13).
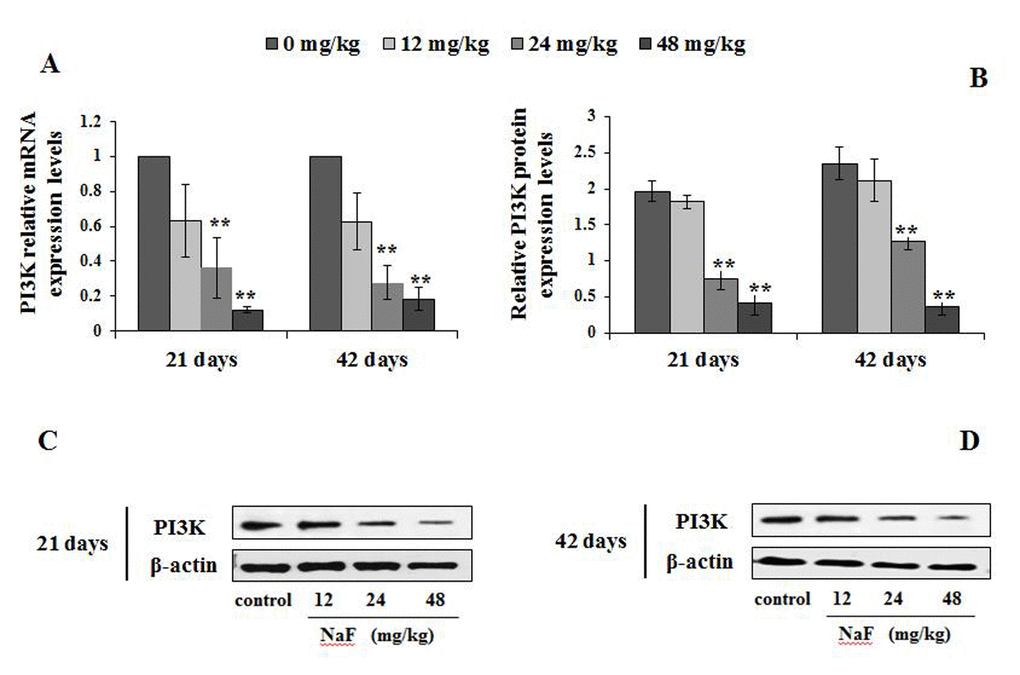
Figure 12. Changes of mRNA and protein expression levels of PI3K in the spleen at 21 and 42 days of the experiment. (A) The relative mRNA expression levels. (B) The relative protein expression levels. (C, D) The western blot assay. Data are presented with the mean + standard deviation (n=8), *p < 0.05, compared with the control group; **p < 0.01, compared with the control group.
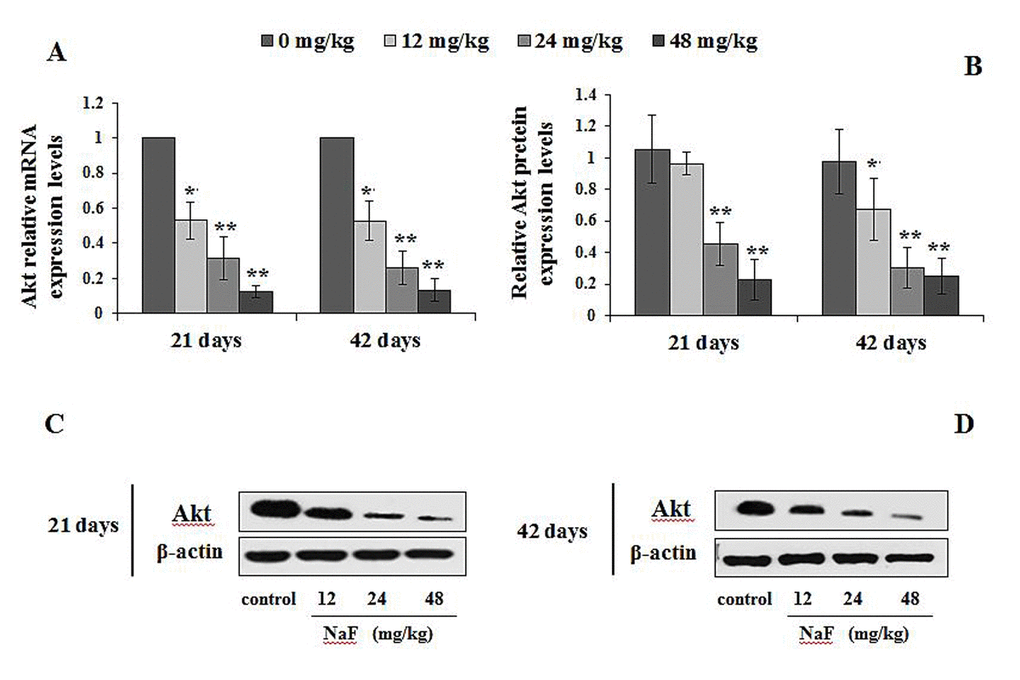
Figure 13. Changes of mRNA and protein expression levels of Akt in the spleen at 21 and 42 days of the experiment. (A) The relative mRNA expression levels. (B) The relative protein expression levels. (C, D) The western blot assay. Data are presented with the mean + standard deviation (n=8), *p < 0.05, compared with the control group; **p < 0.01, compared with the control group.
Discussion
Proteins are degraded via two main pathways in eukaryotic cells. Short-lived proteins are degraded by the proteasome, whereas long-lived proteins are degraded by autophagy [32]. In autophagy, cytoplasmic components are engulfed within a cytoplasmic vacuole by double-membrane-bound structures (autophagosomes) and delivered to lysosomes for degradation [33]. Thus, autophagy plays key roles in maintaining intracellular homeostasis by degrading and recycling damaged organelles and macromolecules [28]. It is presently unclear whether fluoride causes murine splenocyte autophagy, and the roles of autophagy in the splenic damage by fluoride treatment, which could contribute to elucidate the mechanism of fluoride-induced splenic toxicity in mice.
The appearance of autophagic vacuoles can be confirmed the occurrence of autophagy [20]. Once the autophagosome is formed, it must deliver its cargo to the lysosome in mammals or the functionally related vacuole in yeast and plants [34]. Then the outer membrane of autophagosome will fuse with lysosomal/vacuolar membrane to form the autolysosome [35]. Subsequently, the autophagic cargo are degraded and the component parts are exported back into the cytoplasm through lysosomal permeases for use by the cell in biosynthetic process or to generate energy [36]. We have observed that NaF caused an increase in the number of autophagosomes and autolysosomes in the mouse spleen (Figure1), which indicated that NaF induced autophagy in the spleen.
The LC3 serves as a autophagosomal marker protein in mammals. After being synthesized, LC3 is cleaved to produce the cytosolic LC3I (18 kDa) form. LC3I is converted to LC3II (16 kDa), which is tightly associated with the autophagosomal membrane via conjugation to phosphatidylethanolamine (PE) [37]. LC3II promotes autophagosome formation by facilitating membrane elongation [38]. It has been reported that alteration of LC3 expressions is involved in the fluoride-induced autophagy in mice leydig cells [28] or through ROS-mediated JNK signaling [39]. In addition, The punctate pattern of LC3 staining reflects the association of LC3-II with the membranes of early autophagosomes [40]. In the present study, the autophagy marker LC3 punctate staining was increased with NaF dosage increased (Figures 2-3), which showed that the increased punctate staining was corresponds to autophagosome buildup. Simultaneously, we noted that NaF significantly increased the LC3 mRNA and protein expression levels, and the ratio of LC3II/LC3I (Figure 4), which suggested that NaF likely caused a higher autophagic activity, and increased the formation of mature autophagosomes in the spleen. Additionally, LC3II expression levels were distinctly higher at 42 days of the experiment than 21 days of the experiment, which indicated that autophagy regulation was a dynamic process with time dependent pattern.
The p62 protein, also known as sequestosome-1 (SQSTM1) binding autophagy regulator Atg8/LC3 through a region termed the LC3-interacting region (LIR), suggests a link between autophagy and p62, whose levels can be regulated by autophagy [41]. When autophagy is inhibited, p62 accumulates, and when autophagy is induced, p62 is decreased [42]. Mathew et al. has verified that defective autophagy is a mechanism for p62 up-regulation commonly observed in human tumors, and contributes directly to tumorigenesis [43]. Similarly, Jaakkola et al. has reported that p62 down-regulated by hypoxia-activated autophagy in carcinoma cells [44]. Beclin1, as a protein involved in the initiation and execution of autophagy, regulates the autophagosome-lysosome fusion by interacting with Atg12-Atg5 and LC3-PE complexes [45]. Lei et al. has also demonstrated that high fluoride cause autophagy of HAT-7 cells by observing the expression of Beclin1 and mTOR to elucidate the mechanism of dental fluorosis [46]. Our study showed that the mRNA and protein expression levels of p62 were significantly decreased, while the Beclin1 levels were significantly enhanced in NaF-treated groups (Figures 5-6), which were consistent with the results of M Komatsu et al. [47] and Pattingre et al. [48] that p62 was regulated in controlling intracellular inclusion body formation by autophagy, and Beclin1 was involved in the initial step of autophagosome formation.
Atg5 was originally characterized as a binding partner with Atg12 in yeast, forming a complex that regulates the processing of LC3 and autophagosome formation [20]. Two ubiquitin-like (Atg12 and Atg8/LC3) conjugation systems in the downstream of Beclin-1- phosphatidylinoside 3- kinase are important for the induction of autophagy. The terminal product of one of two pathways is Atg5-Atg12 covalent complex, which is required for the elongation of the isolation membrane [49]. Atg16L1 forms an essential autophagy complex with Atg5 and Atg12 that facilitates elongation of the initial isolation membrane that results in engulfment of the cargo and formation of the autophagosome. Subsequent fusion with the lysosome facilitates degradation and allows nutrient recycling [50]. From this study, we found that the mRNA and protein expression levels of Atg12, Atg5 and Atg16L1 were markedly up-regulation (Figures 7-9), which indicated that splenocytes were sensitive to autophagy. Also, alteration of the above-mentioned LC3, p62, Beclin1, Atg12, Atg5 and Atg16L1 showed NaF-induced autophagy in this study.
The regulatory role of the mTOR signaling pathway in autophagy was first demonstrated in yeast [51], and later in Drosophila [52]. As a central checkpoint that negatively regulates autophagy, the inhibition of mTOR activity initiates autophagy, and leads to dephosphorylation of ULK1 and Atg13 which relieved the inhibition of autophagy [53,54]. In this study, mTOR signaling pathway was suppressed (Figure 10), and the expressions of ULK1 and Atg13 were up-regulated (Figure 11) by NaF treatment. Autophagy is a cellular stress response that is activated through a number of pathways, mTOR integrates signals that either inhibit autophagy via the PI3K/Akt pathway [55] or trigger autophagy via activation of AMPK (Adenosine 5‘-monophosphate (AMP)-activated protein kinase) [56], and the activation of Akt (protein kinase B, PKB) can be regulated by PI3K [57]. Our study showed that PI3K and Akt expression levels were significantly declined (Figures 12-13) in NaF-treated groups, which indicated that NaF led to the suppression of mTOR signaling and promoted autophagy. The relationship between autophagy and mTOR regulation-related genes is shown in Figure 14.
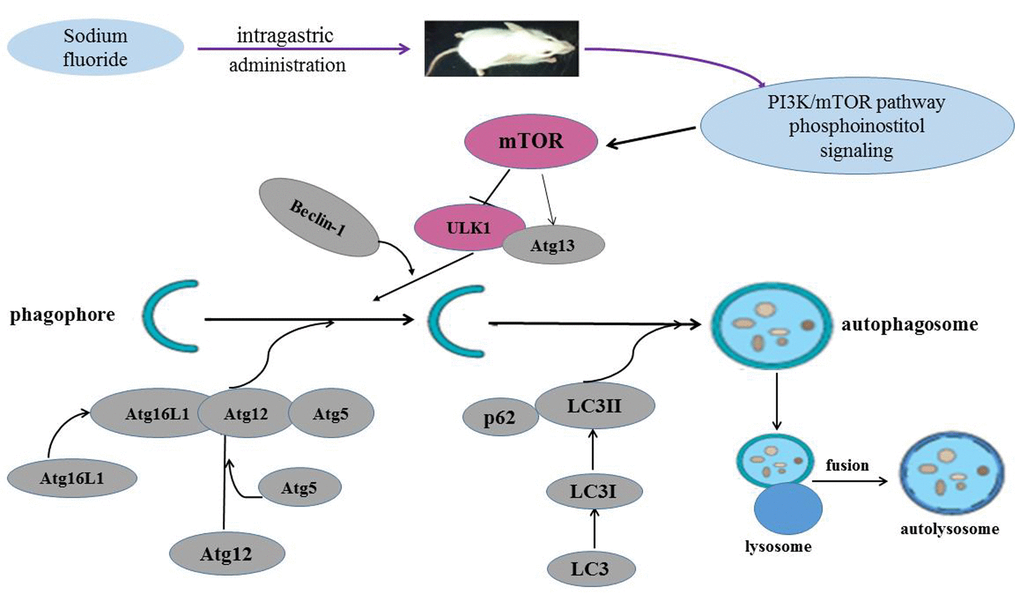
Figure 14. Sodium fluoride induces autophagy in mammalian mice spleen. NaF can induce the splenocyte autophagy by inhibiting the PI3K and mTOR activity, which in turn enhanced ULK1 and Atg13 expression levels, and then increased LC3, Beclin1, Atg16L1, Atg12, Atg5 expression levels, and reduced p62 expression level.
Numerous autophagy-related genes and proteins participate in the initiation and formation of autophagosomes and in cargo recognition [45]. The complete autophagosome is then transported to fuse with lysosomes, and degradation of the content releases valuable anabolic compounds. The present study finds that NaF in excess of 12 mg/kg can induce the splenocyte autophagy via inhibition of mTOR activity, which is characterized by down-regulation of PI3K/Akt expression and p-mTOR expression. And the suppression of mTOR activity in turn initiates autophagy by up-regulating ULK1 and Atg13 expression. Increased or decreased expression levels of the LC3II, p62, Beclin1, Atg16L1, Atg12 and Atg5 promote the initiation and formation of autophagosome. The inhibition of mTOR activity and alteration of autophagy-related genes and proteins are the potential molecular mechanism of NaF-induced splenocyte autophagy. The above-mentioned results may provide new insights for further understanding the role of autophagy in fluoride-induced splenic damage and toxicity.
Materials and Methods
Animals and treatment
240 healthy ICR mice (Experimental Animal Corporation of DOSSY at Chengdu, China) were used in this study to estimate NaF-induced autophagy in the spleen. Food and water was provided ad libitum. Mice were randomly divided into 4 groups (N = 60). The control group was given an intragastric administration of distilled water at the same time as other groups. The experimental groups were given an intragastric administration of 12, 24, and 48 mg/kg NaF (Chengdu Kelong Chemical Co., Ltd., Chengdu, China), respectively. The gavage doses of four groups were 1 mL/100 g body weight once daily for the last 42 days.
Our experiments involving the use of mice and all experimental procedures were approved by the Animal Care and Use Committee, Sichuan Agricultural University.
Determination of autophagosomes and autolysosome in the spleen by transmission electron microscopy (TEM)
The spleen were rapidly cut into ∼1 mm × ∼1 mm × ∼1 mm pieces, fixed in 2.5% glutaraldehyde at room temperature. After fixation, a 0.2M phosphate buffer (pH 7.2) was used to rinse the tissue twice for 15 minutes. Next 1% buffered osmium tetroxide was used to post-fix the samples for 1 h, dehydrated in a graded series of ethyl alcohol, and embedded in epoxy resins. The ultrathin sections were prepared, mounted on copper grids, and stained with uranyl acetate and lead acetate. Then, the images were examined and photographed using transmission electron microscope.
Determination of autophagy marker in the spleen by immunohistochemistry (IHC)
Spleen was fixed in 4% paraformaldehyde overnight followed by dehydration in ethanol, embedded in paraffin wax.
The spleen paraffin sections were dewaxed in xylene, rehydrated through a graded series of ethanol solutions, washed in distilled water and PBS and endogenous peroxidase activity was blocked by incubation with 3% H2O2 in methanol for 15 min. The slices were subjected to antigen retrieval procedure by microwaving in 0.01 M sodium citrate buffer pH 6.0. Additional washing in PBS was performed before 30 min of incubation at 37 °C in 10% normal goat serum (Boster, Wuhang, China). Then incubated overnight at 4 °C with the primary antibodies (1:100). After washing in PBS, the slices were exposed to 1% biotinylated goat anti-rabbit IgG secondary antibody (Boster, Wuhang, China) for 1 h at 37°C, and then incubated with strept avidinbiotin complex (SABC; Boster, Wuhang, China) for 30 min at 37 °C. To visualize the immunoreaction, slices were immersed in diaminobenzidine hydrochloride (DAB; Boster, Wuhang, China). The slices were monitored microscopically and stopped by immersion in distilled water, as soon as brown staining was visible. Slices were lightly counterstained with hematoxylin, dehydrated in ethanol, cleared in xylene and mounted. For negative control purposes, representative sections were processed in the same way by replacing primary antibodies by PBS.
Determination of mTOR signaling pathway parameters’ mRNA expression levels in the spleen by qRT-PCR
At 21 and 42 days of the experiment, spleens of eight mice in each group were removed and stored in liquid nitrogen, and then homogenized with liquid nitrogen by a mortar and pestle, and Total RNA was extracted with the RNAiso Plus (9108/9109, Takara, Japan) according to manufacturer’s instructions. Then, cDNA was synthesized with the Prim-Script™ RT reagent Kit (RR047A, Takara, Japan) according to the manufacturer’s instructions and used as a template for qRT-PCR. Specific primers for the genes were designed with the Primer 5 software and synthesized by Sangon (Shanghai, China) (Table 1).
Table 1. Sequence of primers used in qRT-PCR.
| Gene symbol | Accession number | Primer | Primer sequence(5'-3') | Product size | Tm(°C) |
| mTOR | NM-020009.2 | Forward | CAGACTGGCTCTTGCTCATAA | 155 bp | 57 |
| Reverse | GCTGGAAGGCGTCAATC | ||||
| ULK1 | NM-009469.3 | Forward | ACACACCTTCTCCCCAAGTG | 198 bp | 60 |
| Reverse | GACGCACAACATGGAAGTCG | ||||
| Beclin1 | NM-019584.3 | Forward | TGCAGGTGAGCTTCGTGTG | 124 bp | 60 |
| Reverse | GCTCCTCTCCTGAGTTAGCCT | ||||
| Atg16L1 | NM-001205392.1 | Forward | CTGAGAAGGCCCAAGAAGCC | 221 bp | 60 |
| Reverse | GACAGAGCGTCTCGTAGCTG | ||||
| Atg12 | NM-026217.3 | Forward | TAAACTGGTGGCCTCGGAAC | 146 bp | 60 |
| Reverse | ATCCCCATGCCTGGGATTTG | ||||
| Atg5 | NM-053069.6 | Forward | CAAGGATGCGGTTGAGGC | 167 bp | 58 |
| Reverse | TGAGTTTCCGGTTGATGG | ||||
| LC3 | NM-025735.3 | Forward | CTTCGCCGACCGCTGTAA | 170 bp | 60 |
| Reverse | GCCGGATGATCTTGACCAACT | ||||
| Atg13 | NM-145528.3 | Forward | ACTGGTGATGCACATGCCTT | 149 bp | 50 |
| Reverse | ATGCTCCCACTTTTCGGACA | ||||
| p62 | NM-011018.3 | Forward | GCACAGGCACAGAAGACAAG | 134 bp | 59 |
| Reverse | CACCGACTCCAAGGCTATCT | ||||
| PI3K | NM-001077495.2 | Forward | CTGGGGGACATACTGACTGT | 140 bp | 60 |
| Reverse | GTTCCTGGAAAGTCTCCCCTC | ||||
| Akt | NM-009652.3 | Forward | TCCTCAAGAACGATGGCACC | 203 bp | 60 |
| Reverse | CTCCTCAGGCGTTTCCACAT | ||||
| β-actin | NM-007393 | Forward | GCTGTGCTATGTTGCTCTAG | 117 bp | 60 |
| Reverse | CGCTCGTTGCCAATAGTG |
qRT-PCR was carried out in a LightCycler 96 (Roche, Germany) using SYBR® Premix Ex TaqTM II (DRR820A, Takara, Japan) according to the standard protocols. The melting curve analysis was performed to ensure a single peak for each PCR product. Further, purity of specific PCR products was verified by agarose gel electrophoresis. Mouse β-actin was used as an internal reference. Gene expression at days 21 and 42 were calibrated against the corresponding controls. Relative expression was analyzed by the 2-ΔΔCT method [58].
Determination of mTOR signaling pathway parameters’ protein expression levels in the spleen by Western blot
At 21 and 42 days of experiment, splenic samples of eight mice in each group were taken to determine the autophagy protein expression levels by western blot.
The proteins were extracted from frozen spleen samples with RIPA lysis buffer (P0013C; Beyotime, China) and quantified by the BCA Protein Assay Kit (P0012; Beyotime, China). Equal amounts of protein samples were resolved on SDS-PAGE (10%–15% gels) and transferred to nitrocellulose filter membranes. Membranes were blocked with 5% fat-free milk for 1h and incubated with primary antibodies overnight at 4°C. The primary antibodies were mTOR, p62, PI3K, Akt (Abcam, UK), ULK1, Beclin-1, Atg16L1, Atg12, Atg5, LC3 (CST, USA). The membranes were then washed with PBS-tween and incubated with biotin-conjugated secondary antibodies (CST, USA) for 1h, and washed again with PBS-tween. Blots were visualized by ECLTM (Bio-Rad, Hercules, CA, USA) and X-ray film. The protein bands were quantified with the Image J software.
Statistical analysis
The experimental data are expressed as the mean ± standard deviation. One-way analysis of variance (ANOVA) procedure in SPSS 19.0 software was used to assess statistical significances between F-treated group and control group. A value of P < 0.05 or P < 0.01 was accepted as significant differences.
Author Contributions
P. Kuang, Hui. Deng, H. Cui designed the experiments. P. Kuang, Hui. Deng, H. Liu carried out the experiments. P. Kuang, Hui. Deng, H. Liu and J. Fang, Z. Zuo, J. Deng., Y. Li, X. Wang and L. Zhao analyzed and interpreted data. P. Kuang, Hui. Deng, H. Liu, H. Cui wrote and revised the manuscript.
Conflicts of Interest
The authors declare no conflict of interest.
Funding
The study was supported by the program for Changjiang scholars and innovative research team in university (IRT 0848) and the Shuangzhi Project of Sichuan Agricultural University (03572437; 03571800).
References
- 1. Hagmann WK. The many roles for fluorine in medicinal chemistry. J Med Chem. 2008; 51:4359–69. https://doi.org/10.1021/jm800219f [PubMed]
- 2. Strunecka A, Patocka J, Connett P. Fluorine in medicine. J Appl Biomed. 2004; 2:141.
- 3. Ersoy IH, Alanoglu EG, Koroglu BK, Varol S, Akcay S, Ugan Y, Ersoy S, Tamer MN. Effect of endemic fluorosis on hematological parameters. Biol Trace Elem Res. 2010; 138:22–27. https://doi.org/10.1007/s12011-009-8595-3 [PubMed]
- 4. Błaszczyk I, Birkner E, Gutowska I, Romuk E, Chlubek D. Influence of methionine and vitamin E on fluoride concentration in bones and teeth of rats exposed to sodium fluoride in drinking water. Biol Trace Elem Res. 2012; 146:335–39. https://doi.org/10.1007/s12011-011-9251-2 [PubMed]
- 5. Qu WJ, Zhong DB, Wu PF, Wang JF, Han B. Sodium fluoride modulates caprine osteoblast proliferation and differentiation. J Bone Miner Metab. 2008; 26:328–34. https://doi.org/10.1007/s00774-007-0832-2 [PubMed]
- 6. Lussi A, Hellwig E, Klimek J. Fluorides - mode of action and recommendations for use. Schweiz Monatsschr Zahnmed. 2012; 122:1030–42. [PubMed]
- 7. Liu H, Sun JC, Zhao ZT, Zhang JM, Xu H, Li GS. Fluoride-induced oxidative stress in three-dimensional culture of OS732 cells and rats. Biol Trace Elem Res. 2011; 143:446–56. https://doi.org/10.1007/s12011-010-8881-0 [PubMed]
- 8. Basha PM, Rai P, Begum S. Evaluation of fluoride-induced oxidative stress in rat brain: a multigeneration study. Biol Trace Elem Res. 2011; 142:623–37. https://doi.org/10.1007/s12011-010-8780-4 [PubMed]
- 9. Basha PM, Sujitha NS. Combined influence of intermittent exercise and temperature stress on the modulation of fluoride toxicity. Biol Trace Elem Res. 2012; 148:69–75. https://doi.org/10.1007/s12011-012-9338-4 [PubMed]
- 10. Deng H, Kuang P, Cui H, Chen L, Fang J, Zuo Z, Deng J, Wang X, Zhao L. Sodium fluoride induces apoptosis in cultured splenic lymphocytes from mice. Oncotarget. 2016; 7:67880–900. https://doi.org/10.18632/oncotarget.12081 [PubMed]
- 11. Kuang P, Deng H, Cui H, Chen L, Guo H, Fang J, Zuo Z, Deng J, Wang X, Zhao L. Suppressive effects of sodium fluoride on cultured splenic lymphocyte proliferation in mice. Oncotarget. 2016; 7:61905–15. https://doi.org/10.18632/oncotarget.11308 [PubMed]
- 12. Kuang P, Deng H, Cui H, Chen L, Fang J, Zuo Z, Deng J, Wang X, Zhao L. Sodium fluoride (NaF) causes toxic effects on splenic development in mice. Oncotarget. 2017; 8:4703–17. https://doi.org/10.18632/oncotarget.13971 [PubMed]
- 13. Deng H, Kuang P, Cui H, Luo Q, Liu H, Lu Y, Fang J, Zuo Z, Deng J, Li Y, Wang X, Zhao L. Sodium fluoride induces apoptosis in mouse splenocytes by activating ROS-dependent NF-κB signaling. Oncotarget. 2017; 8:114428–41. https://doi.org/10.18632/oncotarget.22826 [PubMed]
- 14. Deng H, Kuang P, Cui H, Chen L, Luo Q, Fang J, Zuo Z, Deng J, Wang X, Zhao L. Sodium fluoride (NaF) induces the splenic apoptosis via endoplasmic reticulum (ER) stress pathway in vivo and in vitro.. Aging (Albany NY). 2016; 8:3552–67. https://doi.org/10.18632/aging.101150 [PubMed]
- 15. Guo H, Kuang P, Luo Q, Cui H, Deng H, Liu H, Lu Y, Fang J, Zuo Z, Deng J, Li Y, Wang X, Zhao L. Effects of sodium fluoride on blood cellular and humoral immunity in mice. Oncotarget. 2017; 8:85504–15. [PubMed]
- 16. Song G, Wang RL, Chen ZY, Zhang B, Wang HL, Liu ML, Gao JP, Yan XY. Toxic effects of sodium fluoride on cell proliferation and apoptosis of Leydig cells from young mice. J Physiol Biochem. 2014; 70:761–68. https://doi.org/10.1007/s13105-014-0344-1 [PubMed]
- 17. Song JS, Lee HY, Lee E, Hwang HJ, Kim JH. Cytotoxicity and apoptosis induction of sodium fluoride in human promyelocytic leukemia (HL-60) cells. Environ Toxicol Pharmacol. 2002; 11:85–91. https://doi.org/10.1016/S1382-6689(01)00108-9 [PubMed]
- 18. Matsui H, Morimoto M, Horimoto K, Nishimura Y. Some characteristics of fluoride-induced cell death in rat thymocytes: cytotoxicity of sodium fluoride. Toxicol In Vitro. 2007; 21:1113–20. https://doi.org/10.1016/j.tiv.2007.04.006 [PubMed]
- 19. Nguyen Ngoc TD, Son YO, Lim SS, Shi X, Kim JG, Heo JS, Choe Y, Jeon YM, Lee JC. Sodium fluoride induces apoptosis in mouse embryonic stem cells through ROS-dependent and caspase- and JNK-mediated pathways. Toxicol Appl Pharmacol. 2012; 259:329–37. https://doi.org/10.1016/j.taap.2012.01.010 [PubMed]
- 20. Singletary K, Milner J. Diet, autophagy, and cancer: a review. Cancer Epidemiol Biomarkers Prev. 2008; 17:1596–610. https://doi.org/10.1158/1055-9965.EPI-07-2917 [PubMed]
- 21. Zhang J, Zhu Y, Shi Y, Han Y, Liang C, Feng Z, Zheng H, Eng M, Wang J. Fluoride-induced autophagy via the regulation of phosphorylation of mammalian Targets of Rapamycin in mice Leydig cells. J Agric Food Chem. 2017; 65:8966–76. https://doi.org/10.1021/acs.jafc.7b03822 [PubMed]
- 22. Hamacher-Brady A, Brady NR. Mitophagy programs: mechanisms and physiological implications of mitochondrial targeting by autophagy. Cell Mol Life Sci. 2016; 73:775–95. https://doi.org/10.1007/s00018-015-2087-8 [PubMed]
- 23. Tang BL. Autophagy in response to environmental stresses: new monitoring perspectives. Ecol Indic. 2016; 60:453–59. https://doi.org/10.1016/j.ecolind.2015.07.022
- 24. Chen T, Cui H, Cui Y, Bai C, Gong T. Decreased antioxidase activities and oxidative stress in the spleen of chickens fed on high-fluorine diets. Hum Exp Toxicol. 2011; 30:1282–86. https://doi.org/10.1177/0960327110388538 [PubMed]
- 25. Ito M, Nakagawa H, Okada T, Miyazaki S, Matsuo S. ER-stress caused by accumulated intracistanal granules activates autophagy through a different signal pathway from unfolded protein response in exocrine pancreas cells of rats exposed to fluoride. Arch Toxicol. 2009; 83:151–59. https://doi.org/10.1007/s00204-008-0341-7 [PubMed]
- 26. Suzuki M, Bandoski C, Bartlett JD. Fluoride induces oxidative damage and SIRT1/autophagy through ROS-mediated JNK signaling. Free Radic Biol Med. 2015; 89:369–78. https://doi.org/10.1016/j.freeradbiomed.2015.08.015 [PubMed]
- 27. Gu X, Han D, Chen W, Zhang L, Lin Q, Gao J, Fanning S, Han B. SIRT1-mediated FoxOs pathways protect against apoptosis by promoting autophagy in osteoblast-like MC3T3-E1 cells exposed to sodium fluoride. Oncotarget. 2016; 7:65218–30. https://doi.org/10.18632/oncotarget.11573 [PubMed]
- 28. Zhang J, Zhu Y, Shi Y, Han Y, Liang C, Feng Z, Zheng H, Eng M, Wang J. Fluoride induced autophagy via the regulation of Mammalian Targets of Rapamycin phosphorylation in mice Leydig cells. J Agric Food Chem. 2017; 65:8966. https://doi.org/10.1021/acs.jafc.7b03822 [PubMed]
- 29. Lei S, Zhang Y, Zhang KQ, Li J. [In vivo and in vitro experimental study on the effect of fluoride-induced autophagy in rat HAT-7 cell line]. Shanghai Kou Qiang Yi Xue. 2016; 25:426–30. [PubMed]
- 30. Niu Q, Chen J, Xia T, Li P, Zhou G, Xu C, Zhao Q, Dong L, Zhang S, Wang A. Excessive ER stress and the resulting autophagic flux dysfunction contribute to fluoride-induced neurotoxicity. Environ Pollut. 2018; 233:889–99. https://doi.org/10.1016/j.envpol.2017.09.015 [PubMed]
- 31. Zhang S, Niu Q, Gao H, Ma R, Lei R, Zhang C, Xia T, Li P, Xu C, Wang C, Chen J, Dong L, Zhao Q, Wang A. Excessive apoptosis and defective autophagy contribute to developmental testicular toxicity induced by fluoride. Environ Pollut. 2016; 212:97–104. https://doi.org/10.1016/j.envpol.2016.01.059 [PubMed]
- 32. Bjørkøy G, Lamark T, Brech A, Outzen H, Perander M, Overvatn A, Stenmark H, Johansen T. p62/SQSTM1 forms protein aggregates degraded by autophagy and has a protective effect on huntingtin-induced cell death. J Cell Biol. 2005; 171:603–14. https://doi.org/10.1083/jcb.200507002 [PubMed]
- 33. Kabeya Y, Mizushima N, Yamamoto A, Oshitani-Okamoto S, Ohsumi Y, Yoshimori T. LC3, GABARAP and GATE16 localize to autophagosomal membrane depending on form-II formation. J Cell Sci. 2004; 117:2805–12. https://doi.org/10.1242/jcs.01131 [PubMed]
- 34. Devenish RJ, Klionsky DJ. Autophagy: mechanism and physiological relevance ‘brewed’ from yeast studies. Front Biosci (Schol Ed). 2012; 4:1354–63. https://doi.org/10.2741/s337 [PubMed]
- 35. Yang Z, Klionsky DJ. An overview of the molecular mechanism of autophagy. Curr Top Microbiol Immunol. 2009; 335:1–32. https://doi.org/10.1007/978-3-642-00302-8_1 [PubMed]
- 36. Yorimitsu T, Klionsky DJ. Autophagy: molecular machinery for self-eating. Cell Death Differ. 2005 (Suppl 2); 12:1542–52. [PubMed]
- 37. Kabeya Y, Mizushima N, Ueno T, Yamamoto A, Kirisako T, Noda T, Kominami E, Ohsumi Y, Yoshimori T. LC3, a mammalian homologue of yeast Apg8p, is localized in autophagosome membranes after processing. EMBO J. 2000; 19:5720–28. https://doi.org/10.1093/emboj/19.21.5720 [PubMed]
- 38. Hamacher-Brady A, Brady NR. Mitophagy programs: mechanisms and physiological implications of mitochondrial targeting by autophagy. Cell Mol Life Sci. 2016; 73:775–95. https://doi.org/10.1007/s00018-015-2087-8 [PubMed]
- 39. Suzuki M, Bandoski C, Bartlett JD. Fluoride induces oxidative damage and SIRT1/autophagy through ROS-mediated JNK signaling. Free Radic Biol Med. 2015; 89:369–78. https://doi.org/10.1016/j.freeradbiomed.2015.08.015 [PubMed]
- 40. Lee HS, Daniels BH, Salas E, Bollen AW, Debnath J, Margeta M. Clinical utility of LC3 and p62 immunohistochemistry in diagnosis of drug-induced autophagic vacuolar myopathies: a case-control study. PLoS One. 2012; 7:e36221. https://doi.org/10.1371/journal.pone.0036221 [PubMed]
- 41. Moscat J, Diaz-Meco MT. p62 at the crossroads of autophagy, apoptosis, and cancer. Cell. 2009; 137:1001–04. https://doi.org/10.1016/j.cell.2009.05.023 [PubMed]
- 42. Bjørkøy G, Lamark T, Pankiv S, Øvervatn A, Brech A, Johansen T. Monitoring autophagic degradation of p62/SQSTM1. Methods Enzymol. 2009; 452:181–97. https://doi.org/10.1016/S0076-6879(08)03612-4 [PubMed]
- 43. Mathew R, Karp CM, Beaudoin B, Vuong N, Chen G, Chen HY, Bray K, Reddy A, Bhanot G, Gelinas C, Dipaola RS, Karantza-Wadsworth V, White E. Autophagy suppresses tumorigenesis through elimination of p62. Cell. 2009; 137:1062–75. https://doi.org/10.1016/j.cell.2009.03.048 [PubMed]
- 44. Jaakkola PM, Pursiheimo JP. p62 degradation by autophagy: another way for cancer cells to survive under hypoxia. Autophagy. 2009; 5:410–12. https://doi.org/10.4161/auto.5.3.7823 [PubMed]
- 45. Philipp A. Jaeger D-BTW-C. Beclin 1 complex in autophagy and Alzheimer disease. Neurological Review. 2010; 67:1181–84.
- 46. Lei S, Zhang Y, Zhang K, Li J, Liu L. Effects of fluoride on the expression of Beclin1 and mTOR in ameloblasts. Cells Tissues Organs. 2015; 200:405–12. https://doi.org/10.1159/000441052 [PubMed]
- 47. Komatsu M, Waguri S, Koike M, Sou YS, Ueno T, Hara T, Mizushima N, Iwata J, Ezaki J, Murata S, Hamazaki J, Nishito Y, Iemura S, et al. Homeostatic levels of p62 control cytoplasmic inclusion body formation in autophagy-deficient mice. Cell. 2007; 131:1149–63. https://doi.org/10.1016/j.cell.2007.10.035 [PubMed]
- 48. Pattingre S, Espert L, Biard-Piechaczyk M, Codogno P. Regulation of macroautophagy by mTOR and Beclin 1 complexes. Biochimie. 2008; 90:313–23. https://doi.org/10.1016/j.biochi.2007.08.014 [PubMed]
- 49. Mizushima N, Yamamoto A, Hatano M, Kobayashi Y, Kabeya Y, Suzuki K, Tokuhisa T, Ohsumi Y, Yoshimori T. Dissection of autophagosome formation using Apg5-deficient mouse embryonic stem cells. J Cell Biol. 2001; 152:657–68. https://doi.org/10.1083/jcb.152.4.657 [PubMed]
- 50. Mizushima N, Kuma A, Kobayashi Y, Yamamoto A, Matsubae M, Takao T, Natsume T, Ohsumi Y, Yoshimori T. Mouse Apg16L, a novel WD-repeat protein, targets to the autophagic isolation membrane with the Apg12-Apg5 conjugate. J Cell Sci. 2003; 116:1679–88. https://doi.org/10.1242/jcs.00381 [PubMed]
- 51. Noda T, Ohsumi Y. Tor, a phosphatidylinositol kinase homologue, controls autophagy in yeast. J Biol Chem. 1998; 273:3963–66. https://doi.org/10.1074/jbc.273.7.3963 [PubMed]
- 52. Scott RC, Schuldiner O, Neufeld TP. Role and regulation of starvation-induced autophagy in the Drosophila fat body. Dev Cell. 2004; 7:167–78. https://doi.org/10.1016/j.devcel.2004.07.009 [PubMed]
- 53. Laplante M, Sabatini DM. mTOR signaling in growth control and disease. Cell. 2012; 149:274–93. https://doi.org/10.1016/j.cell.2012.03.017 [PubMed]
- 54. Jung CH, Jun CB, Ro SH, Kim YM, Otto NM, Cao J, Kundu M, Kim DH. ULK-Atg13-FIP200 complexes mediate mTOR signaling to the autophagy machinery. Mol Biol Cell. 2009; 20:1992–2003. https://doi.org/10.1091/mbc.e08-12-1249 [PubMed]
- 55. Tao DU, Huang H, Chen X, Ding H, Zhang R, Liu ML, Chen H. LPS regulates macrophage autophagy through PI3K/Akt/mTOR pathway. Chinese Journal of Pathophysiology. 2014; 30:675–80.
- 56. He Q, Sha S, Sun L, Zhang J, Dong M. GLP-1 analogue improves hepatic lipid accumulation by inducing autophagy via AMPK/mTOR pathway. Biochem Biophys Res Commun. 2016; 476:196–203. https://doi.org/10.1016/j.bbrc.2016.05.086 [PubMed]
- 57. Manning BD, Cantley LC. AKT/PKB signaling: navigating downstream. Cell. 2007; 129:1261–74. https://doi.org/10.1016/j.cell.2007.06.009 [PubMed]
- 58. Livak KJ, Schmittgen TD. Analysis of relative gene expression data using real-time quantitative PCR and the 2(-Delta Delta C(T)) Method. Methods. 2001; 25:402–08. https://doi.org/10.1006/meth.2001.1262 [PubMed]