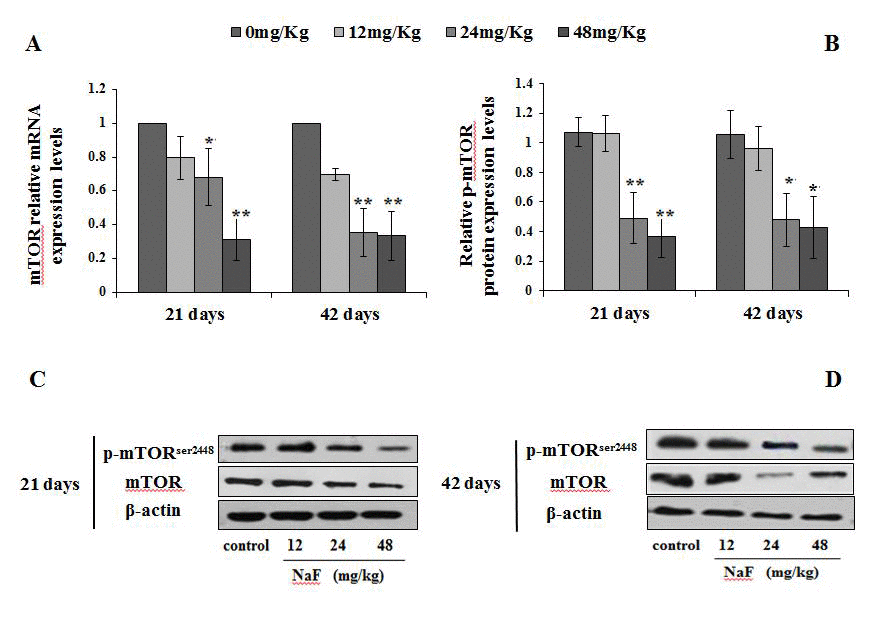
Figure 10.Changes of mRNA and protein expression levels of p-mTOR in the spleen at 21 and 42 days of the experiment. (A) The relative mRNA expression levels. (B) The relative protein expression levels. (C, D) The western blot assay. Data are presented with the mean + standard deviation (n=8), *p < 0.05, compared with the control group; **p < 0.01, compared with the control group.