


Introduction
Thanks to advances in science and medicine people are living longer and aging of the population has become an important issue. By 2030, the segment of the population over 65 years will have nearly doubled, and the incidence of age-associated diseases is expected to increase in parallel [1]. As older age is associated with the risk of kidney disease, chronic loss of kidney function is of significant importance. Kidney disease not only impairs patients’ quality of life and is a potential burden to families and society, it is also a major independent risk factor for cardiovascular morbidity and mortality [2]. At present, however, the molecular basis of renal aging remains unclear.
The process of renal aging involves multiple factors. We therefore established a novel young-old rat kidney transplant model to explore ways to prevent renal aging through direct examination of the kidney within its environment. With this method, we are able to observe the impact of the local renal environment (e.g., circulation, body fluids, etc.) on renal aging and to screen key factors/pathways affecting renal aging. Previous studies showed that young-old donor kidney transplantation is feasible [3] and that the graft survival rate for recipients of old donor kidneys equals that for standard deceased donor kidney transplants. Moreover, donor age appears to have no significant impact on the survival of the graft or the patients [4]. Although the experimental technique of rat kidney transplantation is now well established, there are certain technical difficulties that must be overcome to establish a young-old rat kidney transplant model, which is a major highlight of this study. The findings of this study could potentially provide new direction for delaying renal aging.
Results
Establishing a young - old rat kidney transplant model
As shown in Table 1, following kidney transplantation, perioperative and postoperative mortality increased stepwise from the Y→Y to the O→O group. Nonetheless, this rat renal allograft transplantation model had fewer complications and an improved survival rate, thereby providing a more practical and reliable model for further experiments.
Table 1. Survival details of Young - Old rats kidney transplanted model establishment.
| Group | Perioperative Mortality % (n/n) | Mortality 16 weeks after surgery % (n/n) | Survival rate (%) | |
| Intranperative period | 24 hours after the surgery | |||
| Y con | - | - | - | 100 |
| Y→Y | 14.29 (1/7) | - | 14.29 (1/7) | 85.71 |
| Y→O | 11.11 (1/9) | 22.22 (2/9) | 33.33 (3/9) | 66.67 |
| O→Y | 25.00 (2/8) | - | 25.00 (2/8) | 75.00 |
| O→O | 36.36 (4/11) | 18.18 (2/11) | 54.55 (6/11) | 45.45 |
| O con | - | - | - | 100 |
As shown in Figure 1B, there was no significant difference in renal function between the O control (O→O) and O→Y rats or between the Y control (Y→Y) and Y→O rats.
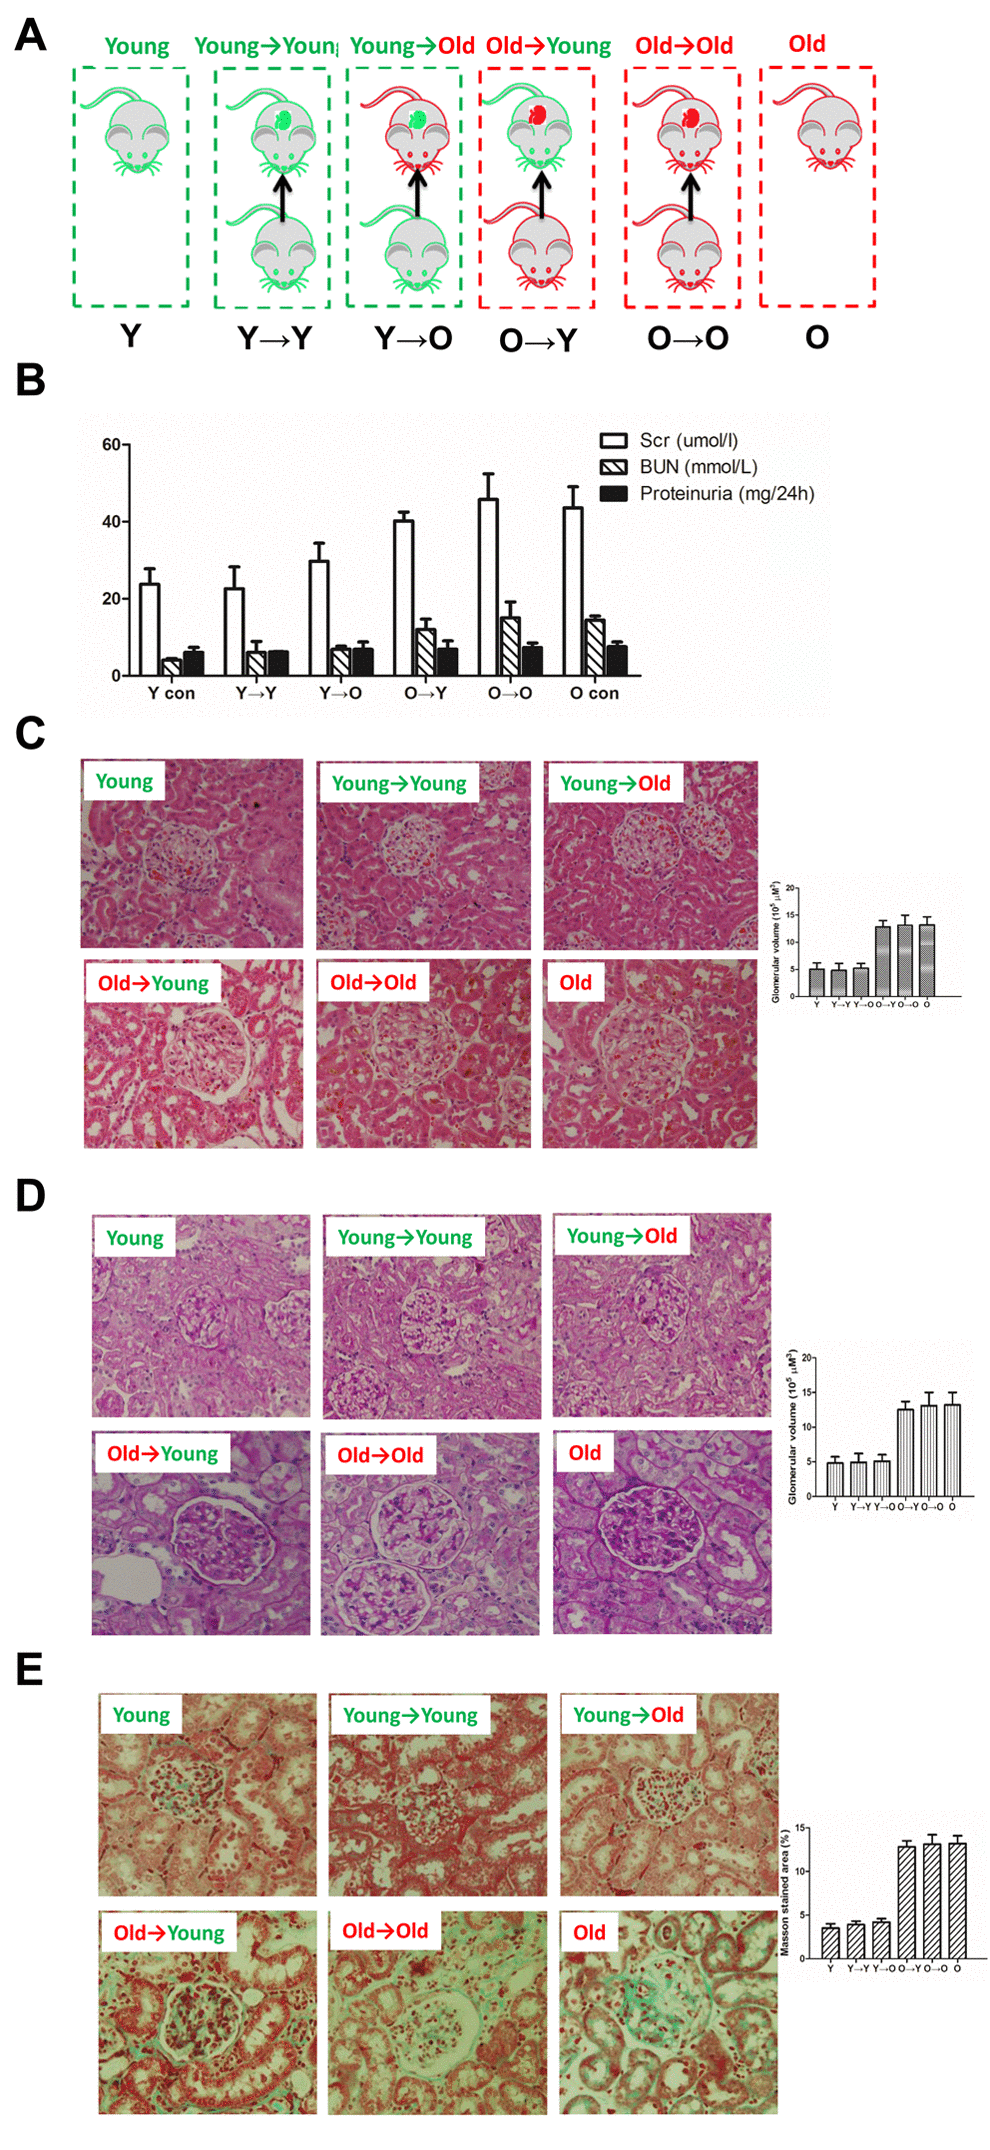
Figure 1. The histological examinations result from each group in this study. (A) Schematic diagram of kidney transplantation. Y→Y, young rat with kidney transplanted from young rat (young control); Y→O, old rat with kidney transplanted from young rat; O→Y, young rat with kidney transplanted from old rat; O→O, old rat with kidney transplanted from old rat (old control). (B) Renal functionality (serum creatinine, serum BUN, proteinurine) in each group. (C) HE staining of kidney tissue samples from each group (×200). (D) PAS staining of kidney tissue samples from each group (×200). (E) Masson staining of kidney tissue samples from each group (×200);
Histological examination
Histological examination was performed using hematoxylin and eosin (HE), periodic acid Schiff (PAS) and Masson staining (Figure 1C-E). HE staining revealed the morphological changes within the kidney tissue. Aged kidneys exhibited increased glomerular volume and swelling of the tubular epithelium. PAS staining revealed marked glycogen deposition in the aged kidneys, indicating tissue damage. Masson staining was used to assess renal fibrosis. In each case, there was no significant difference between the kidneys used for O→O and O→Y transplantation or those used for Y→Y and Y→O transplantation
Senescence-associated β-galactosidase staining and p16 expression
Senescent cells are characterized by growth arrest, enlarged and flat cellular morphology, and an expression profile characterized by expression of senescence-associated genes. The most commonly used marker to identify senescent cells is β-gal activity. As shown in Figure 2A, levels of β-gal expression were lower in the O→Y transplanted kidney tissue than in O→O transplanted kidneys. Conversely, β-gal expression was higher in Y→O transplanted kidney tissue than in Y→Y transplanted kidneys. A similar profile was seen with p16, another biomarker of senescence (Figure 2B).
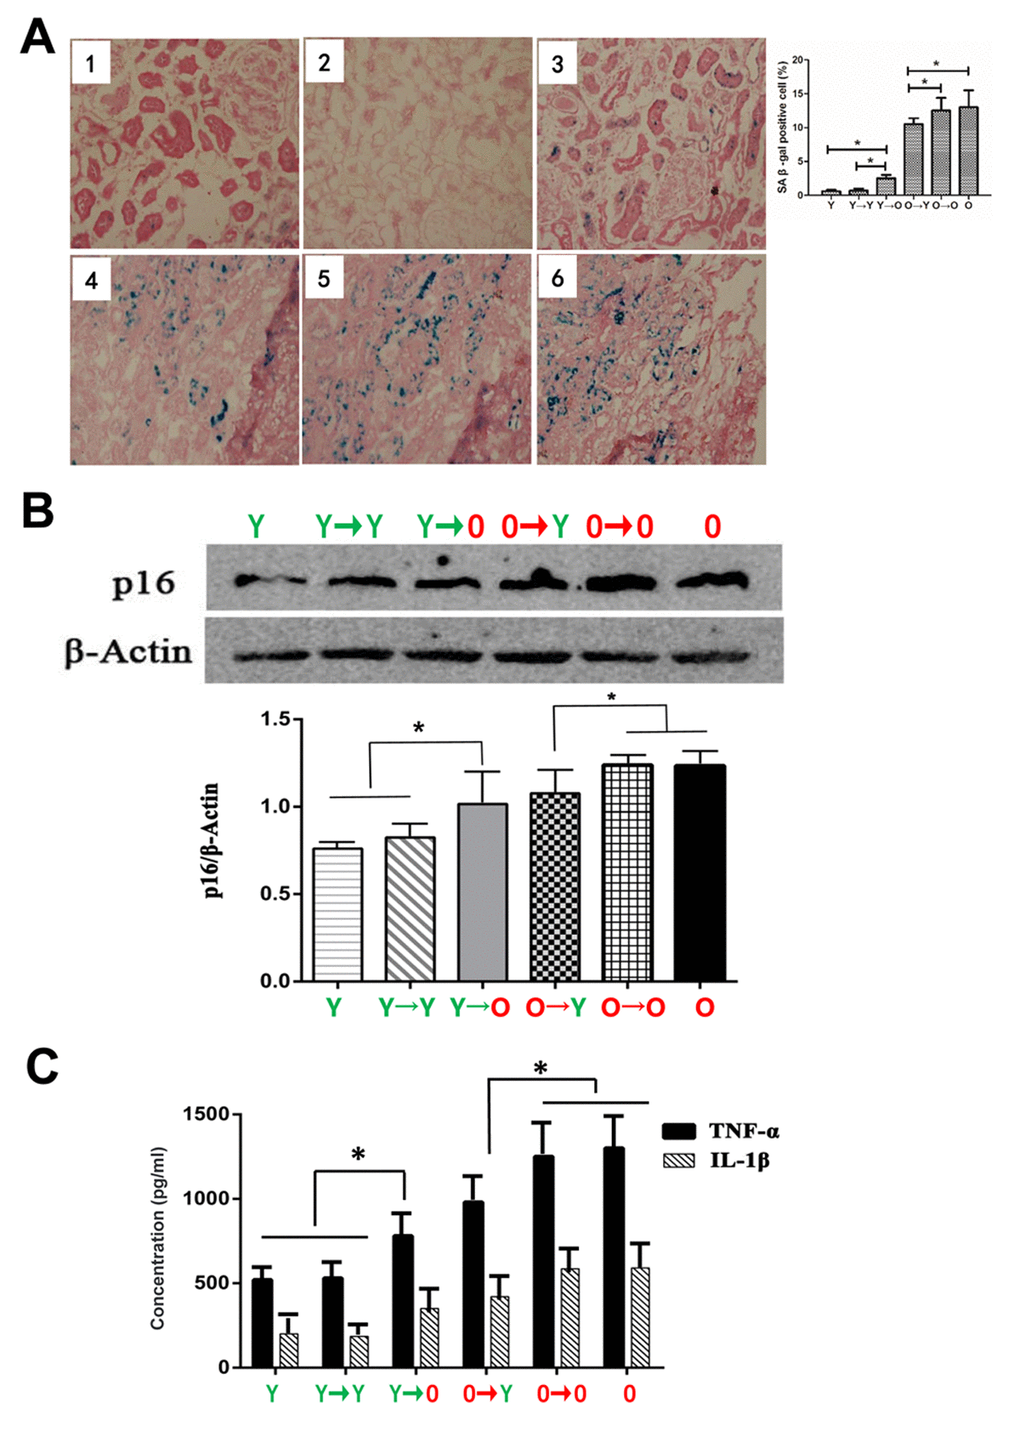
Figure 2. Levels of aging biomarkers. (A) SA-β-gal staining in each group (*p < 0.05). (B) Western blot showing p16 expression levels (*p < 0.05). (C) Results of specific ELISAs showing expression levels of TNF-α and IL-1β (*p < 0.05).
Inflammatory cytokine expression
Because renal aging is associated with chronic inflammation, we assessed expression of two inflammatory cytokines, TNF-α and IL-1β, in the four groups. We found that levels of TNF-α and IL-1β were higher in the Y→O than the Y→Y group, and were lower in the O→Y than the O→O group (Figure 2C).
Identification and quantification of differentially expressed proteins
Compared with the Y→Y group, we detected 391 differentially expressed proteins (181 upregulated proteins, 210 downregulated proteins) in the Y→O group. Compared with the O→O group, we detected 380 differentially expressed proteins (169 upregulated proteins, 211 downregulated proteins) in the O→Y. Sixty-six proteins were associated with anti-aging (downregulated in the Y→O vs. Y→Y and upregulated in the O→Y vs. O→O), and 73 proteins were associated with pro-aging (up-regulated in the Y→O vs. Y→Y and downregulated in the O→Y vs. O→O).
Gene Ontology (GO) term enrichment analysis
We uploaded all differentially expressed proteins (DEPs) to the online software DAVID to identify overrepresented GO categories and Kyoto Encyclopedia of Genes and Genomes (KEGG) pathways. The GO analysis showed that DEPs were significantly enriched in biological processes, including cellular iron ion homeostasis, lipid metabolic process, and negative regulation of cholesterol biosynthetic process. For cell components, the DEPs were enriched in extracellular exosome, extracellular space, mitochondrion, and others. In addition, a GO molecular function analysis showed that the DEPs were significantly enriched for proton-transporting ATP synthase activity, rotational mechanism, poly(A) RNA binding, peptide binding, and protein binding (Table 2).
Table 2. Gene ontology analysis of differentially expressed proteins associated with renal aging.
| Category | pathway ID/ pathway description | P value |
| GOTERM_BP_DIRECT | GO:0006879~cellular iron ion homeostasis | 8.0E-4 |
| GOTERM_BP_DIRECT | GO:0006629~lipid metabolic process | |
| GOTERM_BP_DIRECT | GO:0045541~negative regulation of cholesterol biosynthetic process | 5.1E-3 |
| GOTERM_BP_DIRECT | GO:0051055~negative regulation of lipid biosynthetic process | 6.1E-3 |
| GOTERM_BP_DIRECT | GO:0044794~positive regulation by host of viral process | 7.2E-3 |
| GOTERM_BP_DIRECT | GO:0045471~response to ethanol | 1.6E-2 |
| GOTERM_BP_DIRECT | GO:0045780~positive regulation of bone resorption | 1.9E-2 |
| GOTERM_BP_DIRECT | GO:0015986~ATP synthesis coupled proton transport | 2.4E-2 |
| GOTERM_BP_DIRECT | GO:0055114~oxidation-reduction process | 2.7E-2 |
| GOTERM_BP_DIRECT | GO:0060999~positive regulation of dendritic spine development | 2.9E-2 |
| GOTERM_BP_DIRECT | GO:0001937~negative regulation of endothelial cell proliferation | 3.3E-2 |
| GOTERM_BP_DIRECT | GO:0001895~retina homeostasis | 3.5E-2 |
| GOTERM_BP_DIRECT | GO:0006953~acute-phase response | 3.8E-2 |
| GOTERM_BP_DIRECT | GO:0007568~aging | 4.1E-2 |
| GOTERM_BP_DIRECT | GO:0046034~ATP metabolic process | 4.6E-2 |
| GOTERM_BP_DIRECT | GO:0007566~embryo implantation | 5.3E-2 |
| GOTERM_BP_DIRECT | GO:0007283~spermatogenesis | 5.5E-2 |
| GOTERM_BP_DIRECT | GO:0050727~regulation of inflammatory response | 6.0E-2 |
| GOTERM_BP_DIRECT | GO:0034599~cellular response to oxidative stress | 7.7E-2 |
| GOTERM_CC_DIRECT | GO:0070062~extracellular exosome | 2.1E-11 |
| GOTERM_CC_DIRECT | GO:0005615~extracellular space | 3.9E-8 |
| GOTERM_CC_DIRECT | GO:0005739~mitochondrion | 3.4E-6 |
| GOTERM_CC_DIRECT | GO:0043209~myelin sheath | 2.3E-5 |
| GOTERM_CC_DIRECT | GO:0072562~blood microparticle | 1.6E-4 |
| GOTERM_CC_DIRECT | GO:0031012~extracellular matrix | 1.5E-3 |
| GOTERM_CC_DIRECT | GO:0005576~extracellular region | 3.5E-3 |
| GOTERM_CC_DIRECT | GO:0005623~cell | 5.2E-3 |
| GOTERM_CC_DIRECT | GO:0031232~extrinsic component of external side of plasma membrane | 7.3E-3 |
| GOTERM_CC_DIRECT | GO:0005753~mitochondrial proton-transporting ATP synthase complex | 2.0E-2 |
| GOTERM_CC_DIRECT | GO:0005764~lysosome | 2.1E-2 |
| GOTERM_CC_DIRECT | GO:0006743~mitochondrial inner membrane | 3.3E-2 |
| GOTERM_CC_DIRECT | GO:0016020~membrane | 4.3E-2 |
| GOTERM_MF_DIRECT | GO:0046933~proton-transporting ATP synthase activity, rotational mechanism | 1.9E-2 |
| GOTERM_MF_DIRECT | GO:0044822~poly(A) RNA binding | 3.0E-2 |
| GOTERM_MF_DIRECT | GO:0042277~peptide binding | 8.2E-2 |
| GOTERM_MF_DIRECT | GO:0005515~protein binding | 8.6E-2 |
KEGG pathway analysis
Table 3 contains the most significantly enriched KEGG pathways of the analyzed DEPs. The DEPs were enriched in metabolic pathways, Huntington's disease, carbon metabolism, Alzheimer's disease, propanoate metabolism, pyruvate metabolism, and glutathione metabolism.
Table 3. KEGG pathway analysis of differentially expressed proteins associated with renal aging.
| Pathway ID | Name | P value |
| rno01100 | Metabolic pathways | 1.3E-3 |
| rno05016 | Huntington's disease | 3.2E-3 |
| rno01200 | Carbon metabolism | 1.4E-2 |
| rno05010 | Alzheimer's disease | 3.1E-2 |
| rno00640 | Propanoate metabolism | 4.2E-2 |
| rno00620 | Pyruvate metabolism | 6.0E-2 |
| rno00480 | Glutathione metabolism | 8.6E-2 |
Module screening from the protein-protein interaction network
A protein-protein interaction (PPI) network was constructed using the STRING database (Figure 3A). Using information from the database, we screened for the top 10 high-degree hub nodes. These hub proteins were SOD1, ENO1, BCL2, ATP5A1, SOD2, CAT, GPX1, ACTBL2, LCHB, and ATP5H. Among them, SOD1 was the highest-degree (12) node. Moreover, a total of 73 nodes and 99 edges were analyzed using the MCODE plug-in. The top 3 significant modules were selected (Figure 3B), and the functional annotation of the genes involved in the modules was analyzed. Enrichment analysis of most of the proteins in modules 1-3 is shown in Table 4. GO molecular function analysis showed that DEPs were mainly involved in oxidative stress, while the GO cellular component analysis showed that DEPs were mainly located in the mitochondria, and the KEGG analysis showed that the genes were mainly associated with the peroxisome pathway.
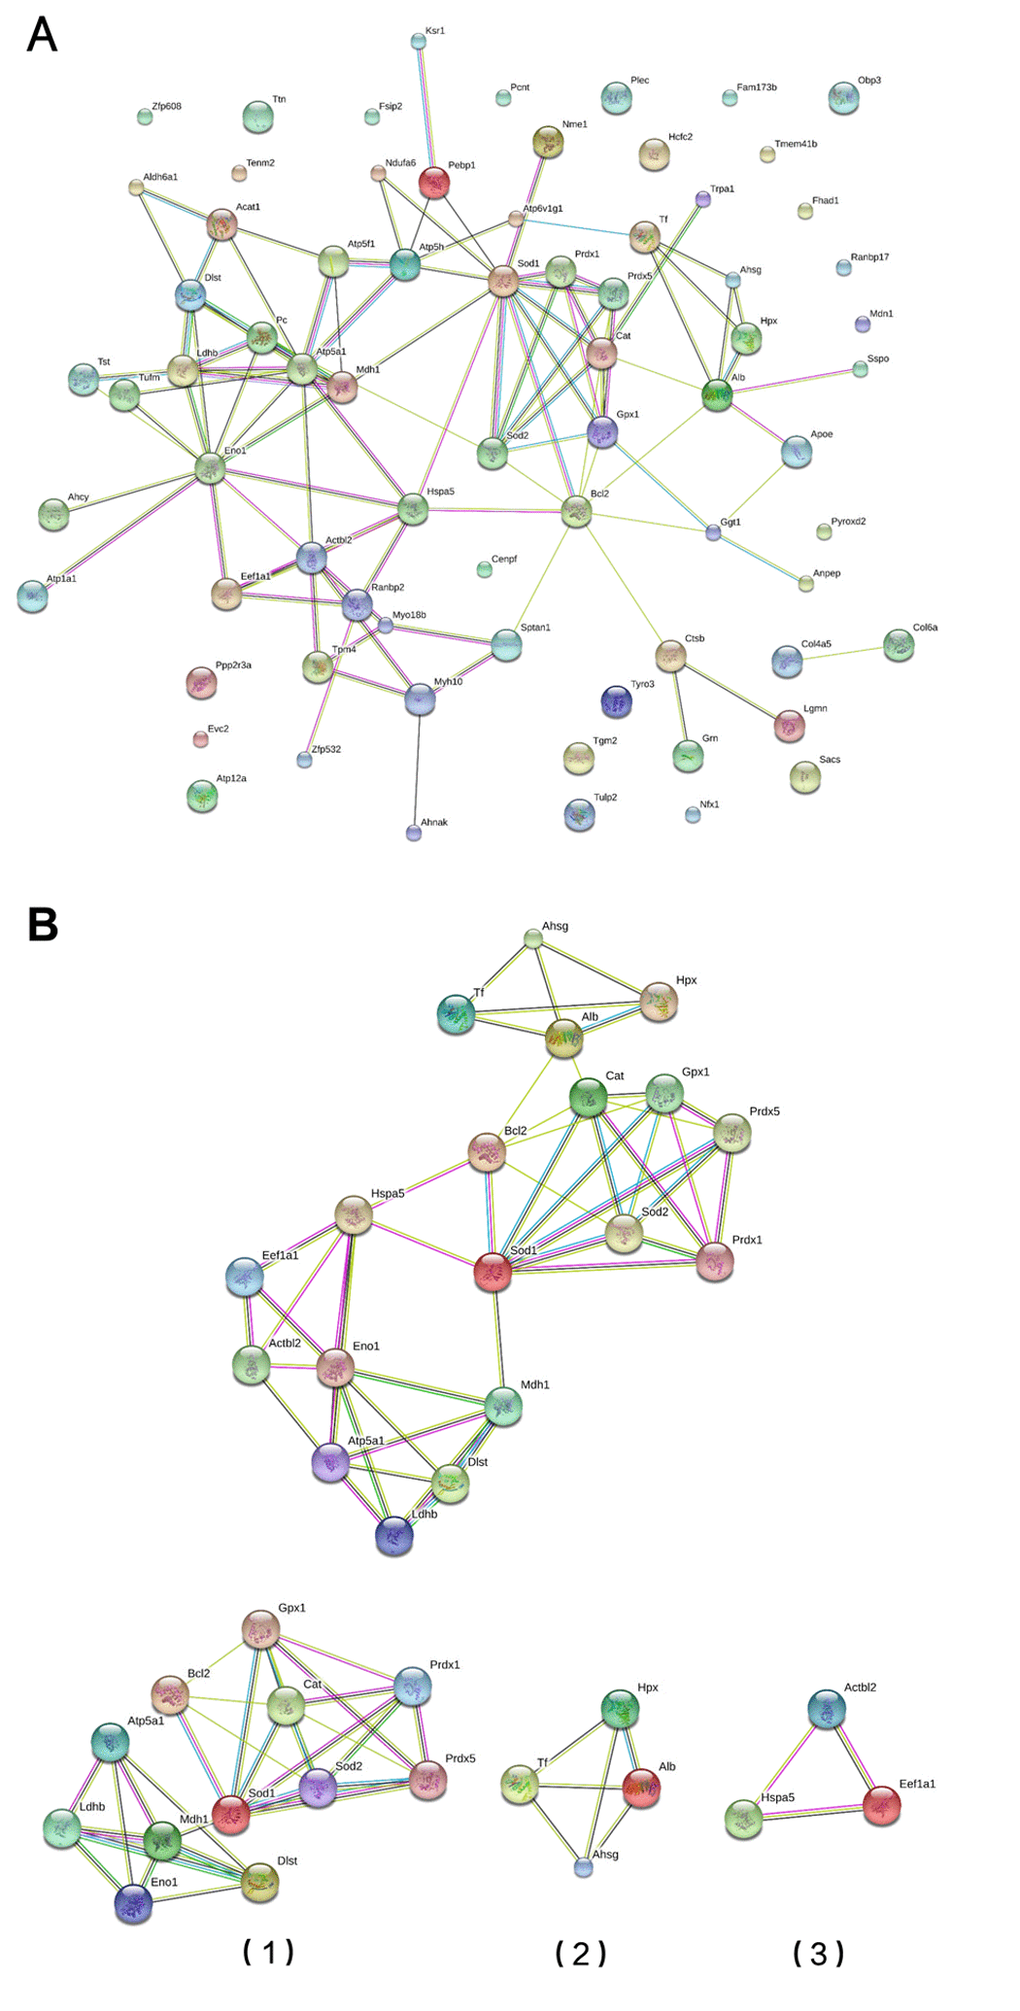
Figure 3. Module screening of a PPI network of DEPs. (A) Protein-protein interaction network of DEPs (STRING). (B) PPI network modules screened using the Molecular Complex Detection plug-in. Three PPI network modules were screened (1, 2 and 3).
Table 4. Gene ontology/ KEGG pathway analysis of the top 3 significant modules.
| Biological Process (GO) | ||||
| #pathway ID | pathway description | Count | P value | Matching proteins |
| GO:0010035 | response to inorganic substance | 8 | 2.73E-06 | Alb,Bcl2,Cat,Gpx1,Hspa5,Sod1,Sod2,Tf |
| GO:0042743 | hydrogen peroxide metabolic process | 4 | 2.73E-06 | Cat,Gpx1,Sod1,Sod2 |
| GO:0010038 | response to metal ion | 7 | 5.50E-06 | Alb,Bcl2,Cat,Hspa5,Sod1,Sod2,Tf |
| GO:1901564 | organonitrogen compound metabolic process | 9 | 5.50E-06 | Dlst,Eef1a1,Eno1,Gpx1,Hpx,Ldhb,Mdh1,Sod1,Sod2 |
| GO:0010033 | response to organic substance | 10 | 4.45E-05 | Ahsg,Alb,Bcl2,Cat,Eef1a1,Gpx1,Hspa5,Sod1,Sod2,Tf |
| GO:0031667 | response to nutrient levels | 7 | 4.45E-05 | Alb,Bcl2,Cat,Gpx1,Hspa5,Sod1,Sod2 |
| GO:0006091 | generation of precursor metabolites and energy | 5 | 6.63E-05 | Cat,Dlst,Eno1,Mdh1,Sod2 |
| GO:1990267 | response to transition metal nanoparticle | 5 | 8.70E-05 | Alb,Bcl2,Hspa5,Sod1,Sod2 |
| GO:0055114 | oxidation-reduction process | 7 | 9.71E-05 | Dlst,Gpx1,Ldhb,Mdh1,Prdx1,Prdx5,Sod1 |
| GO:0033591 | response to L-ascorbic acid | 3 | 0.000148 | Bcl2,Cat,Sod2 |
| GO:0045333 | cellular respiration | 4 | 0.000148 | Cat,Dlst,Mdh1,Sod2 |
| GO:0046496 | nicotinamide nucleotide metabolic process | 4 | 0.000148 | Dlst,Eno1,Ldhb,Mdh1 |
| GO:0051186 | cofactor metabolic process | 5 | 0.00016 | Dlst,Eno1,Hpx,Ldhb,Mdh1 |
| GO:0043066 | negative regulation of apoptotic process | 6 | 0.000234 | Alb,Bcl2,Cat,Hspa5,Sod1,Sod2 |
| GO:0051881 | regulation of mitochondrial membrane potential | 3 | 0.000234 | Bcl2,Sod1,Sod2 |
| GO:0007584 | response to nutrient | 5 | 0.000438 | Alb,Bcl2,Cat,Gpx1,Sod2 |
| GO:0019674 | NAD metabolic process | 3 | 0.000458 | Dlst,Ldhb,Mdh1 |
| GO:0042311 | vasodilation | 3 | 0.000458 | Alb,Sod1,Sod2 |
| GO:0006749 | glutathione metabolic process | 3 | 0.00048 | Gpx1,Sod1,Sod2 |
| GO:0007568 | aging | 5 | 0.00064 | Bcl2,Cat,Gpx1,Sod1,Sod2 |
| GO:0071310 | cellular response to organic substance | 7 | 0.000785 | Ahsg,Cat,Eef1a1,Hspa5,Sod1,Sod2,Tf |
| GO:0009060 | aerobic respiration | 3 | 0.000925 | Cat,Dlst,Mdh1 |
| GO:0033273 | response to vitamin | 4 | 0.000955 | Bcl2,Cat,Gpx1,Sod2 |
| GO:0044710 | single-organism metabolic process | 9 | 0.000955 | Dlst,Eno1,Gpx1,Hpx,Ldhb,Mdh1,Prdx1,Prdx5,Sod1 |
| GO:0055072 | iron ion homeostasis | 3 | 0.0011 | Sod1,Sod2,Tf |
| GO:0006790 | sulfur compound metabolic process | 4 | 0.00113 | Dlst,Gpx1,Sod1,Sod2 |
| GO:0046686 | response to cadmium ion | 3 | 0.00113 | Cat,Sod1,Sod2 |
| GO:0006950 | response to stress | 8 | 0.00148 | Ahsg,Alb,Bcl2,Cat,Gpx1,Prdx1,Sod1,Tf |
| GO:1901700 | response to oxygen-containing compound | 7 | 0.00164 | Ahsg,Bcl2,Cat,Gpx1,Sod1,Sod2,Tf |
| GO:0034284 | response to monosaccharide | 4 | 0.00175 | Bcl2,Cat,Gpx1,Sod2 |
| GO:0045471 | response to ethanol | 4 | 0.002 | Bcl2,Cat,Sod1,Sod2 |
| GO:0010243 | response to organonitrogen compound | 6 | 0.00216 | Ahsg,Bcl2,Cat,Gpx1,Sod1,Tf |
| GO:0009719 | response to endogenous stimulus | 7 | 0.00223 | Ahsg,Bcl2,Cat,Eef1a1,Gpx1,Sod1,Tf |
| GO:0020027 | hemoglobin metabolic process | 2 | 0.00241 | Cat,Hpx |
| GO:0050665 | hydrogen peroxide biosynthetic process | 2 | 0.00241 | Sod1,Sod2 |
| GO:0097305 | response to alcohol | 5 | 0.00246 | Bcl2,Cat,Gpx1,Sod1,Sod2 |
| GO:0009056 | catabolic process | 6 | 0.00316 | Cat,Dlst,Eno1,Gpx1,Hspa5,Sod1 |
| GO:0048583 | regulation of response to stimulus | 7 | 0.00343 | Ahsg,Alb,Bcl2,Cat,Hpx,Hspa5,Mdh1 |
| GO:0019430 | removal of superoxide radicals | 2 | 0.00369 | Sod1,Sod2 |
| GO:0042554 | superoxide anion generation | 2 | 0.00369 | Sod1,Sod2 |
| GO:0042744 | hydrogen peroxide catabolic process | 2 | 0.00369 | Cat,Gpx1 |
| GO:0006734 | NADH metabolic process | 2 | 0.00451 | Dlst,Mdh1 |
| GO:0034641 | cellular nitrogen compound metabolic process | 8 | 0.00451 | Dlst,Eef1a1,Eno1,Gpx1,Ldhb,Mdh1,Sod1,Sod2 |
| GO:0042221 | response to chemical | 8 | 0.00508 | Ahsg,Alb,Bcl2,Cat,Eef1a1,Gpx1,Sod1,Tf |
| GO:0071451 | cellular response to superoxide | 2 | 0.00519 | Sod1,Sod2 |
| GO:0006979 | response to oxidative stress | 4 | 0.00595 | Cat,Gpx1,Prdx1,Sod1 |
| GO:0006518 | peptide metabolic process | 4 | 0.00647 | Eef1a1,Gpx1,Sod1,Sod2 |
| GO:0001836 | release of cytochrome c from mitochondria | 2 | 0.00695 | Bcl2,Sod2 |
| GO:0001666 | response to hypoxia | 4 | 0.00696 | Bcl2,Cat,Sod2,Tf |
| GO:0001101 | response to acid chemical | 4 | 0.00709 | Bcl2,Cat,Gpx1,Sod2 |
| GO:0051593 | response to folic acid | 2 | 0.00894 | Bcl2,Gpx1 |
| Molecular Function (GO) | ||||
| GO:0016209 | antioxidant activity | 6 | 3.58E-09 | Cat,Gpx1,Prdx1,Prdx5,Sod1,Sod2 |
| GO:0016491 | oxidoreductase activity | 8 | 1.09E-06 | Cat,Gpx1,Ldhb,Mdh1,Prdx1,Prdx5,Sod1,Sod2 |
| GO:0004601 | peroxidase activity | 4 | 2.46E-06 | Cat,Gpx1,Prdx1,Prdx5 |
| GO:0005488 | binding | 14 | 0.0001 | Alb,Atp5a1,Bcl2,Cat,Dlst,Eef1a1,Gpx1,Hpx,Ldhb,Mdh1,Prdx1,Sod1,Sod2,Tf |
| GO:0005515 | protein binding | 10 | 0.000409 | Alb,Bcl2,Dlst,Eno1,Hspa5,Ldhb,Prdx1,Sod1,Sod2,Tf |
| GO:0043167 | ion binding | 11 | 0.000409 | Alb,Atp5a1,Cat,Eef1a1,Eno1,Gpx1,Hpx,Hspa5,Sod1,Sod2,Tf |
| GO:1901363 | heterocyclic compound binding | 10 | 0.000558 | Alb,Atp5a1,Cat,Eef1a1,Hspa5,Ldhb,Mdh1,Prdx1,Sod2,Tf |
| GO:0097159 | organic cyclic compound binding | 10 | 0.000583 | Alb,Atp5a1,Cat,Eef1a1,Hspa5,Ldhb,Mdh1,Prdx1,Sod2,Tf |
| GO:0042802 | identical protein binding | 5 | 0.0013 | Bcl2,Eno1,Ldhb,Prdx1,Sod2 |
| GO:0036094 | small molecule binding | 8 | 0.00136 | Alb,Atp5a1,Cat,Eef1a1,Hspa5,Ldhb,Mdh1,Tf |
| GO:0003824 | catalytic activity | 10 | 0.00164 | Dlst,Eef1a1,Eno1,Gpx1,Ldhb,Mdh1,Prdx1,Prdx5,Sod1,Sod2 |
| GO:0004784 | superoxide dismutase activity | 2 | 0.00217 | Sod1,Sod2 |
| GO:0051920 | peroxiredoxin activity | 2 | 0.00217 | Prdx1,Prdx5 |
| GO:0048037 | cofactor binding | 4 | 0.00259 | Alb,Cat,Ldhb,Mdh1 |
| GO:0000166 | nucleotide binding | 7 | 0.0039 | Atp5a1,Cat,Eef1a1,Hspa5,Ldhb,Mdh1,Tf |
| Cellular Component (GO) | ||||
|---|---|---|---|---|
| GO:0005739 | mitochondrion | 10 | 2.22E-07 | Atp5a1,Bcl2,Cat,Dlst,Hspa5,Ldhb,Mdh1,Prdx1,Prdx5,Sod1 |
| GO:0043209 | myelin sheath | 5 | 1.86E-05 | Hspa5,Ldhb,Mdh1,Sod1,Sod2 |
| GO:0005615 | extracellular space | 7 | 9.17E-05 | Ahsg,Alb,Cat,Hpx,Mdh1,Sod1,Tf |
| GO:0005740 | mitochondrial envelope | 5 | 0.00154 | Atp5a1,Bcl2,Cat,Sod1,Sod2 |
| GO:0031012 | extracellular matrix | 4 | 0.00154 | Ahsg,Alb,Sod1,Tf |
| GO:0032991 | macromolecular complex | 9 | 0.00154 | Ahsg,Alb,Atp5a1,Dlst,Eno1,Hspa5,Prdx1,Sod1,Tf |
| GO:0044444 | cytoplasmic part | 11 | 0.00154 | Atp5a1,Bcl2,Dlst,Eno1,Gpx1,Ldhb,Mdh1,Prdx1,Prdx5,Sod1,Tf |
| GO:0043227 | membrane-bounded organelle | 12 | 0.00171 | Atp5a1,Bcl2,Dlst,Eef1a1,Gpx1,Hpx,Ldhb,Mdh1,Prdx1,Prdx5,Sod1,Tf |
| GO:0043234 | protein complex | 8 | 0.00239 | Ahsg,Alb,Atp5a1,Dlst,Eno1,Hspa5,Sod1,Tf |
| GO:0044429 | mitochondrial part | 5 | 0.00239 | Atp5a1,Bcl2,Cat,Prdx1,Sod1 |
| GO:0070062 | extracellular exosome | 6 | 0.00239 | Cat,Hpx,Hspa5,Ldhb,Mdh1,Sod1 |
| GO:0044421 | extracellular region part | 7 | 0.00262 | Ahsg,Alb,Hpx,Hspa5,Ldhb,Mdh1,Tf |
| GO:0005777 | peroxisome | 3 | 0.00322 | Prdx1,Prdx5,Sod1 |
| GO:0043231 | intracellular membrane-bounded organelle | 11 | 0.00334 | Atp5a1,Bcl2,Dlst,Eef1a1,Gpx1,Ldhb,Mdh1,Prdx1,Prdx5,Sod1,Tf |
| KEGG Pathways | ||||
| 4146 | Peroxisome | 5 | 1.35E-06 | Cat,Prdx1,Prdx5,Sod1,Sod2 |
| 5014 | Amyotrophic lateral sclerosis (ALS) | 4 | 1.16E-05 | Bcl2,Cat,Gpx1,Sod1 |
| 1120 | Microbial metabolism in diverse environments | 4 | 0.000697 | Cat,Dlst,Ldhb,Mdh1 |
| 5016 | Huntington s disease | 4 | 0.001 | Atp5a1,Gpx1,Sod1,Sod2 |
SOD1 and the Ac-NF-κB signaling pathway in renal aging
Because SOD1 was the highest-degree node in the PPI network of DEPs, we verified its expression in vivo. We found that SOD1 expression was lower in the Y→O than the Y→Y group, and was higher in the O→Y than the O→O group. In addition, we observed that acetylated (Ac)-NF-κB showed the opposite expression profile (Figure 4A). In vitro. Sod1 was broadly expressed in renal cells, especially in tubular epithelial cells. When renal tubular epithelial cells isolated from the young and old rats were cultured in the same culture medium under the same culture conditions, Sod1 expression was lower in aged tubular epithelial cells (Figure 4C). This finding was consistent with our earlier proteomics results summarized above.
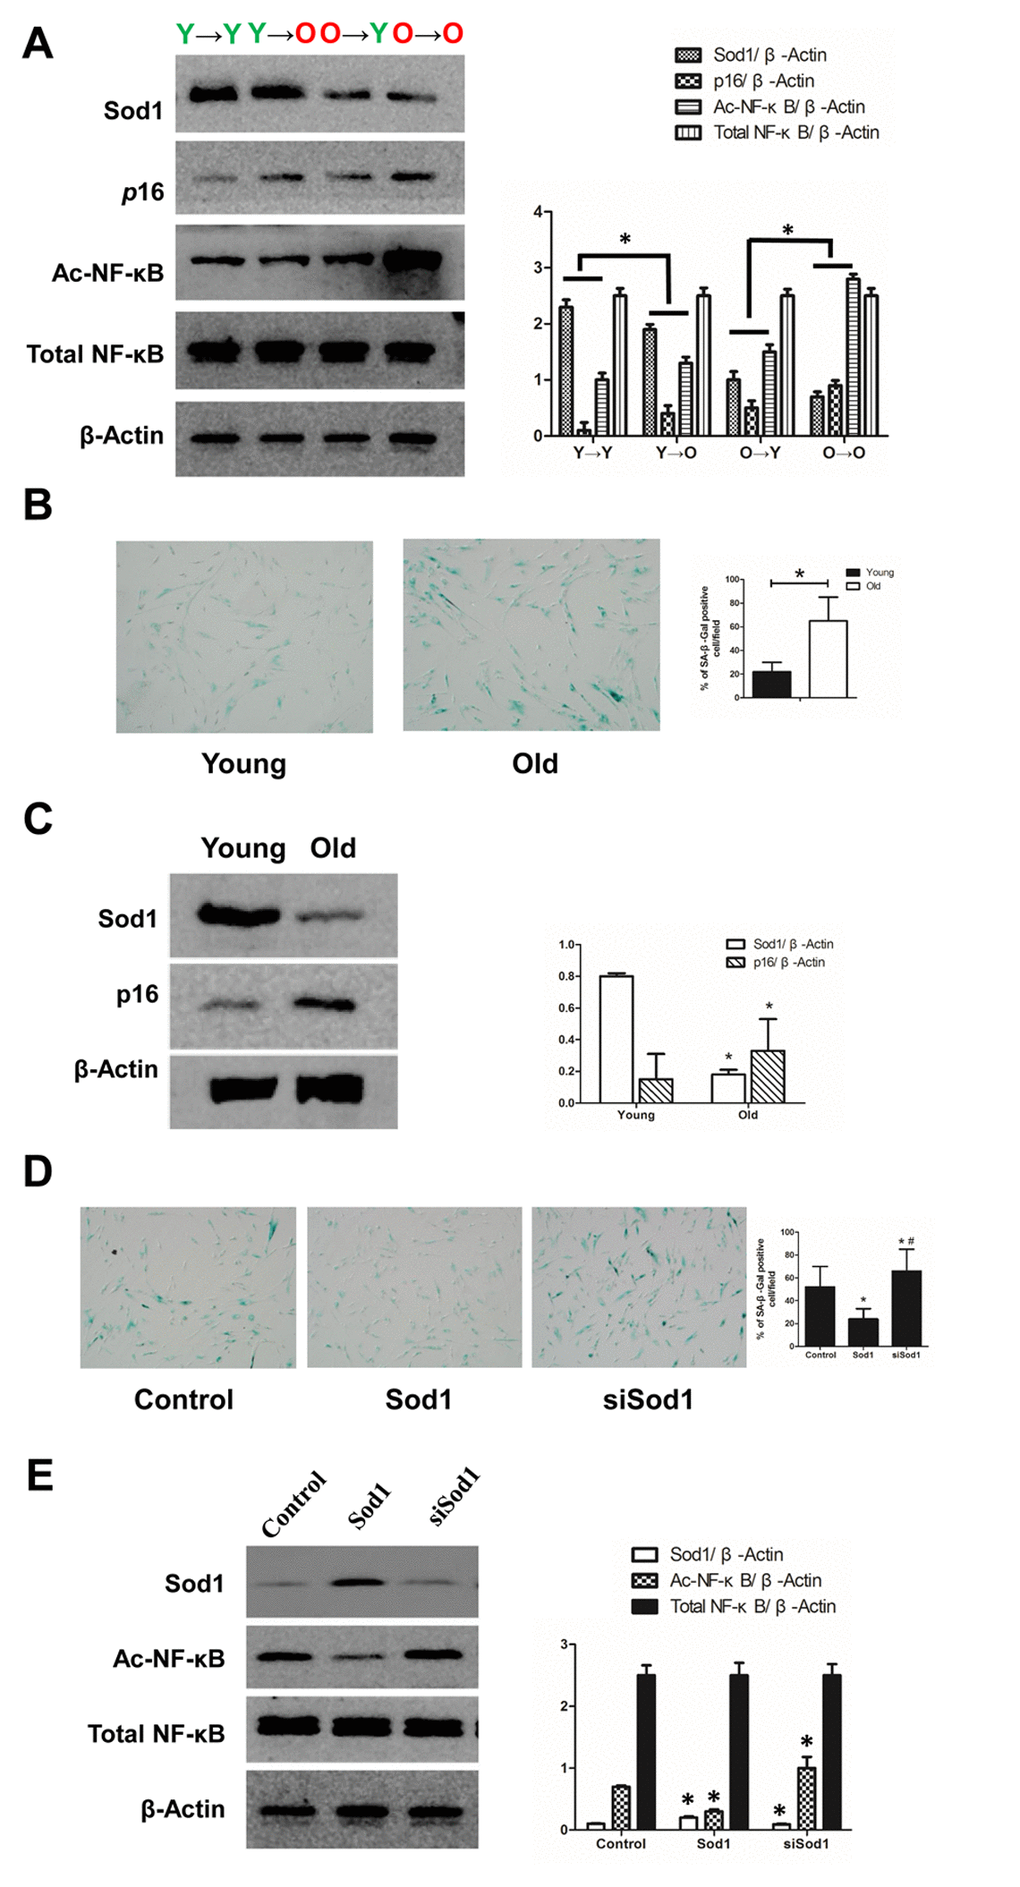
Figure 4. Expression of SOD1 and NF-κB in vivo and in vitro. (A) Expression of SOD1, p16 and NF-κB in kidney tissue from each group (*p < 0.05). (B) SA-β-gal staining of young and old tubular epithelial cells. (C) Expression of SOD1 and p16 in young and old tubular epithelial cells (*p < 0.05 vs young group). (D) SA-β-gal staining of tubular epithelial cells after the indicated interventions (*p < 0.05 vs control; #p < 0.05 vs SOD1 overexpression). (D) Expression of NF-κB in tubular epithelial cells after the indicated interventions (*p < 0.05 vs control).
We also observed that Sod1 knockdown led to increased Ac-NF-κB expression and that overexpression of SOD1 had the opposite effect. In both cases, total NF-κB was unchanged. (Figure 4D). Thus, Sod1 knockdown appears to promote cell senescence, while Sod1 overexpression appears to inhibit it.
Discussion
This study had three main aspects. First, we successfully established a young-old rat kidney transplant model. Second, we found that the local renal environment could affect renal aging and might make the kidney younger/older by affecting oxidative stress/mitochondria function. Third, we determined that Sod1, detected in a proteomic analysis, inhibits renal aging.
The incidence of morbidity associated with chronic kidney disease related to aging has increased significantly. Renal aging primarily manifests as declining glomerular GFR, impaired sodium balance in the renal tubules, impaired fluid balance, potassium retention, declining urine dilution, decreased ability to reduce urinary pH, decreased effective renal plasma flow, increased filtration fraction, increasing glomerular vascular resistance, impaired vasodilator response, and endocrine-associated changes, including decreased plasma renin and aldosterone, decreased response of EPO to anemia, and decreased vitamin D activity [5,6]. Multiple factors ranging from genetic background to chronic inflammation contribute to renal aging [7]. For example, regulatory genes and post-transcriptional processes (acetylation and methylation) are essential for regulation of renal cell differentiation and maintenance of cellular function [8]. In the normal aging rat, a variety of proteins are expressed in the glomeruli of the elderly but not young rats. These include proteins within pathways that mediate glomerular sclerosis and interstitial fibrosis, thereby accelerating renal aging [9]. In addition, through functional genomics more than 500 genes have been found to be differentially expressed between neonates (8 weeks) and the elderly (88 years). Proteins overexpressed in the elderly kidney were involved in immune responses, inflammation, extracellular matrix synthesis, oxidation processes, glycolipid metabolism and collagen degradation [10].
To observe the effect of the local renal environment on renal aging, we established a young-old rat kidney transplant model. To exclude effects of renal ischemia and reperfusion factors, we included Y→Y and O→O kidney transplant control groups. To exclude effects of rejection factors, we established the model using inbred F344 rats. This rat renal allograft transplantation model has few complications and a good survival rate, providing a practical and reliable model for further experimentation. Importantly, there were no significant differences in renal function or histomorphology between the O→O and O→Y transplanted kidneys or between the Y→Y and Y→O transplanted kidneys, which further suggests the model was successfully established.
Our GO and KEGG analyses suggest the local renal environment can indeed affect aging of the kidney. Construction of a PPI network using the STRING database revealed SOD1, ENO1, BCL2, ATP5A1, SOD2, CAT, GPX1, ACTBL2, LCHB and ATP5H to have high degrees of connectivity, and SOD1 to have the highest. Notably, SOD1 suppressed renal cell aging in this study by inhibiting NF-κB. SOD1 is the predominant form of SOD in the cytoplasm, where it acts as an antioxidant [11]. Results from invertebrates also suggest a role for SOD1 in aging. Overexpression of SOD1 in short-lived strains of fruit files extends their lifespan and appears to delay aging [12]. The formation of free radicals increases with age, and SOD1 is an important factor reducing oxidative stress [13]. Ac-NF-κB reportedly contributes to the process of cell senescence by acting in the nucleus to stimulate transcription of senescence-related genes. SOD1 may inhibit senescence by reducing the level of Ac-NF-κB [14]. Consistent with that idea, we observed that SOD1 knockdown led to increased levels of Ac-NF-κB.
Among the other screened hub proteins, ENO1, is reportedly involved in aging and age-related diseases, such as Alzheimer’s disease [15,16], while BCL2, belongs to an anti-apoptotic protein family. Expression of BCL2 is reduced during aging and so could be a target for anti-aging therapy [17]. ATP5A1 and SOD2 are reportedly involved in mitochondrial dysfunction [18], and CAT expression is decreased in the hearts of aged rats. In addition to contributing to H2O2 detoxification, CAT protects against NO/peroxynitrite and may be involved in regulating angiogenesis, neovascularization and apoptosis [19]. GPX1 is also involved in the aging process, and its overexpression in aged mice suppresses arterial and venous thrombosis [20]. ATP5H is related to ATP synthase function, and the ATP5H/KCTD2 locus is associated with age-related Alzheimer’s disease risk [21]. A total of 73 nodes and 99 edges were analyzed using the MCODE plug-in, and 3 significant modules were selected. It is noteworthy that the Go molecular function analysis showed that DEPs were mainly involved in oxidative stress, the GO cellular component analysis showed they mainly localize to mitochondria, and the KEGG analysis showed they mainly associate with the peroxisome pathway. We therefore suggest renal aging reflects the local renal environment, particularly oxidative stress and mitochondrial function.
In summary, our findings indicate a young-old rat kidney transplant model can provide a basis for studying the effects of the local renal environment on renal aging and indicates that the status of the local renal environment, particularly oxidative stress/mitochondrial function, is a key determinant of kidney aging.
Materials and Methods
Animals
Male F344 rats were purchased from the Si Bei Fu Laboratory Animal Company (Beijing, China). Rats were housed under specific pathogen-free conditions in the Experimental Animal Center of the Chinese General Hospital of PLA: 22 ± 1°C, 40% humidity, 12/12-h light/dark cycle, with free access to water. Young (3 months) and old (20 months) rats were used in this study. As shown in Figure 1A, the rats were divided into six groups: young and old controls and kidney transplanted from young rat to young rat (Y→Y), from young rat to old rat (Y→O), from old rat to young rat (O→Y), and from old rat to old rat (O→O). Rats were sacrificed 16 weeks after transplantation, and the transplanted kidney was further studied. All experimental protocols were approved by the Animal Care Committee of Chinese General Hospital of PLA.
Establishment of the model
Rats were anesthetized using isoflurane (5%, induction of anesthesia; 2.2% 0.3-0.6 L/min, during surgery; the concentration was adjusted according to the depth of anesthesia). Transplantation was performed with one kidney. After separating the renal vessels, the rats were heparinized (500 U/ml, 2 ml), and a renal protection fluid was used for hypothermic irrigation of the transplanted kidney. The transplanted kidney, vessels, ureter and bladder disc were then excised from the donor rat, after which the kidney was transplanted to the donee through vascular and urinary reconstruction. A rat might be both a donor and a donee. After surgery, the rats were placed on an insulation blanket and were intraperitoneally administered penicillin (400,000 U).
Histopathological analysis
Kidney slices were fixed in 10% formalin solution overnight. After automated dehydration through a graded alcohol series, transverse kidney slices were embedded in paraffin, sectioned at 4 μm, and stained with hematoxylin-eosin and periodic acid-Schiff (PAS). Histological examinations were performed independently in a blinded fashion by two observers. Quantitative analyses of kidney tissue were done using Image-Pro software (Media Cybernetics Inc., Silver Springs, MD, USA) with 20 randomly selected ×200 fields per rat.
Senescence-associated β-galactosidase staining
Cryostat sections (4 μm) were mounted on glass slides and fixed in 0.2% glutaraldehyde and 2% formaldehyde at room temperature for 15 min. The sections were then washed in PBS, incubated in freshly prepared senescence-associated β-galactosidase (SA-β-gal) staining solution overnight at 37°C, counterstained with eosin, and examined under a microscope. An investigator blinded to the sample identity performed the image analysis. Quantitative analysis of SA-β-gal positive-stained areas was performed using Image-Pro software with 20 randomly selected ×200 fields per rat.
Western blot analysis
Protein concentrations were determined using a Pierce BCA assay kit (Thermo Fisher Scientific, Waltham, MA, USA). Aliquots of protein (50-100 μg) were separated with 6-16% SDS-PAGE, transferred to nitrocellulose membranes, blocked with blocking buffer for 1 h at room temperature, and incubated with primary antibodies at 4°C overnight. Blots were subsequently incubated with secondary immunoglobulins conjugated with horseradish peroxidase. Immunoreactive bands were visualized using enhanced chemiluminescence, and densitometry was performed using Quantity One software (Bio-Rad Laboratories, Hercules, CA, USA). Band intensities were quantified using ImageJ software (NIH, Bethesda, MD, USA).
Sample collection and protein extraction
Kidney sample collection and protein extraction were performed according to a standard procedure [22].
Enzyme-linked immunosorbent assay (ELISA)
After collecting tissue samples from the transplanted kidneys, TNF-α and IL-1β levels were determined by using ELISA kits (R&D Systems Inc, Minneapolis, MN) according to the manufacturer’s instructions. Levels of the cytokines were normalized to the protein concentration in the lysate.
LC-MS/MS analysis
Digested peptide mixtures were pressure-loaded onto a fused silica capillary column packed with 3-μm Dionex C18 material (RP; Phenomenex). The RP sections with 100 Å were 15 cm long, and the column was washed with buffer A (water, 0.1% formic acid) and buffer B (acetonitrile, 0.1% formic acid). After desalting, a 5-mm, 300-μm C18 capture tip was placed in line with an Agilent 1100 quaternary high-performance liquid chromatograph and analyzed using a 12-step separation. The first step consisted of a 5-min gradient from 0% to 2% buffer B, followed by a 45-min gradient to 40% buffer B. Next, buffer B flowed in a 3-min gradient from 40% to 80% and 10-min of 80% buffer B. After a 2-min buffer B gradient from 80% to 2%, approximately 100 µg of a tryptic peptide mixture was loaded onto the columns and was separated at a 0.5 µL/min flow rate using a linear gradient. As peptides were eluted from the microcapillary column, they were electrosprayed directly into a micrOTOF-Q II mass spectrometer (BRUKER Scientific) with application of a distal 180°C temperature source. The mass spectrometer was operated in the MS/MS (auto) mode. Survey MS scans were acquired in the TOF-Q II with the resolution set to a value of 20,000. Each survey scan (50-2,500) was followed by five data-dependent tandem mass (MS/MS) scans at a 2 Hz normalized scan speed. Tandem mass spectra were searched against the mascot 2.1 (Local Host) RAT protein database. The search results were then filtered using a cutoff of 1% for a peptide false identification rate. Peptides with a Z score < 4 or Delta-Mass > 5 ppm were rejected. Furthermore, the minimum number of peptides used to identify a protein was set to 1. The default parameters for the Profile Analysis 2.0 software were used throughout the analysis.
Bioinformatics analysis
To analyze DEPs at a functional level, gene ontology (GO) enrichment and KEGG pathway analyses were performed using the DAVID online tool (https://david.ncifcrf.gov/). To evaluate the interactive relationships among DEPs, we mapped them to STRING (www.string-db.org/) and experimentally validated the interactions. Those with a combined score > 0.4 were selected as significant. PPI networks were constructed using Cytoscape software. The plug-in Molecular Complex Detection (MCODE) was used to screen the modules of the PPI network in Cytoscape. The criteria were set as follows: MCODE scores > 3 and number of nodes > 4.
Cell culture and transfections
Isolation and culture of rat primary tubular epithelial cells were performed as described previously [23]. Young and aging renal tubular epithelial cells were respectively isolated from young and old rat kidneys and cultured in RPMI 1640 medium supplemented with 10% fetal bovine serum. After three passages, the cells were collected for experimentation. Small interfering RNAs (siRNAs) targeting Sod1, which is highly expressed in tubular epithelial cells, and a RNAi negative control duplex were purchased from Santa Cruz Biotechnology. The RNAi oligonucleotide and RNAi negative control duplex were transfected into cells as instructed by the manufacturer.
Statistical analysis
All data analyses were performed using SPSS software (ver. 18.0; SPSS, Chicago, IL, USA). Data are expressed as the mean ± SD. Comparisons among groups were made using analysis of variance. Values of p < 0.05 were considered significant.
Conflicts of Interest
The authors disclose no potential conflicts of interest.
Funding
This work was supported by the grants from the Major State Basic Research Development Program of China (2013CB530800), a Grant (81330019) from key program of National Natural Science Foundation of China, a Grant (81670671) from National Natural Science Foundation of China, and a Grant (2016YFA0101002) from the National key Research and Development Program.
References
- 1. Coresh J, Selvin E, Stevens LA, Manzi J, Kusek JW, Eggers P, Van Lente F, Levey AS. Prevalence of chronic kidney disease in the United States. JAMA. 2007; 298:2038–47. https://doi.org/10.1001/jama.298.17.2038 [PubMed]
- 2. Wanner N, Hartleben B, Herbach N, Goedel M, Stickel N, Zeiser R, Walz G, Moeller MJ, Grahammer F, Huber TB. Unraveling the role of podocyte turnover in glomerular aging and injury. J Am Soc Nephrol. 2014; 25:707–16. https://doi.org/10.1681/ASN.2013050452 [PubMed]
- 3. Laftavi MR, Stephan R, Feng L, Said M, Kohli R, Dayton M, Pankewycz O. Dual kidney transplants from very old or very young donors: long-term outcomes and complications. Transplant Proc. 2011; 43:507–11. https://doi.org/10.1016/j.transproceed.2011.01.038 [PubMed]
- 4. Lee YJ, Chang JH, Choi HN, Jung JY, Kim YS, Chung WK, Park YH, Lee HH. Donor-recipient age difference and graft survival in living donor kidney transplantation. Transplant Proc. 2012; 44:270–72. https://doi.org/10.1016/j.transproceed.2011.12.013 [PubMed]
- 5. Noordmans GA, Hillebrands JL, van Goor H, Korstanje R. A roadmap for the genetic analysis of renal aging. Aging Cell. 2015; 14:725–33. https://doi.org/10.1111/acel.12378 [PubMed]
- 6. Yoon HE, Choi BS. The renin-angiotensin system and aging in the kidney. Korean J Intern Med (Korean Assoc Intern Med). 2014; 29:291–95. https://doi.org/10.3904/kjim.2014.29.3.291 [PubMed]
- 7. Kitada M, Kume S, Takeda-Watanabe A, Kanasaki K, Koya D. Sirtuins and renal diseases: relationship with aging and diabetic nephropathy. Clin Sci (Lond). 2013; 124:153–64. https://doi.org/10.1042/CS20120190 [PubMed]
- 8. Wiggins JE, Patel SR, Shedden KA, Goyal M, Wharram BL, Martini S, Kretzler M, Wiggins RC. NFkappaB promotes inflammation, coagulation, and fibrosis in the aging glomerulus. J Am Soc Nephrol. 2010; 21:587–97. https://doi.org/10.1681/ASN.2009060663 [PubMed]
- 9. Lefevre GM, Patel SR, Kim D, Tessarollo L, Dressler GR. Altering a histone H3K4 methylation pathway in glomerular podocytes promotes a chronic disease phenotype. PLoS Genet. 2010; 6:e1001142. https://doi.org/10.1371/journal.pgen.1001142 [PubMed]
- 10. Melk A, Mansfield ES, Hsieh SC, Hernandez-Boussard T, Grimm P, Rayner DC, Halloran PF, Sarwal MM. Transcriptional analysis of the molecular basis of human kidney aging using cDNA microarray profiling. Kidney Int. 2005; 68:2667–79. https://doi.org/10.1111/j.1523-1755.2005.00738.x [PubMed]
- 11. Coughlin JM, Ishizuka K, Kano SI, Edwards JA, Seifuddin FT, Shimano MA, Daley EL, Zandi PP, Leweke FM, Cascella NG, Pomper MG, Yolken RH, Sawa A. Marked reduction of soluble superoxide dismutase-1 (SOD1) in cerebrospinal fluid of patients with recent-onset schizophrenia. Mol Psychiatry. 2013; 18:10–11. https://doi.org/10.1038/mp.2012.6 [PubMed]
- 12. Fabrizio P, Longo VD. The chronological life span of Saccharomyces cerevisiae. Aging Cell. 2003; 2:73–81. https://doi.org/10.1046/j.1474-9728.2003.00033.x [PubMed]
- 13. Ji H, Zhang X, Du Y, Liu H, Li S, Li L. Polydatin modulates inflammation by decreasing NF-κB activation and oxidative stress by increasing Gli1, Ptch1, SOD1 expression and ameliorates blood-brain barrier permeability for its neuroprotective effect in pMCAO rat brain. Brain Res Bull. 2012; 87:50–59. https://doi.org/10.1016/j.brainresbull.2011.09.021 [PubMed]
- 14. Huang CY, Fujimura M, Noshita N, Chang YY, Chan PH. SOD1 down-regulates NF-kappaB and c-Myc expression in mice after transient focal cerebral ischemia. J Cereb Blood Flow Metab. 2001; 21:163–73. https://doi.org/10.1097/00004647-200102000-00008 [PubMed]
- 15. Baraibar MA, Liu L, Ahmed EK, Friguet B. Protein oxidative damage at the crossroads of cellular senescence, aging, and age-related diseases. Oxid Med Cell Longev. 2012; 2012:919832. https://doi.org/10.1155/2012/919832 [PubMed]
- 16. Bonora M, Wieckowsk MR, Chinopoulos C, Kepp O, Kroemer G, Galluzzi L, Pinton P. Molecular mechanisms of cell death: central implication of ATP synthase in mitochondrial permeability transition. Oncogene. 2015; 34:1608. https://doi.org/10.1038/onc.2014.462 [PubMed]
- 17. Joaquin AM, Gollapudi S. Functional decline in aging and disease: a role for apoptosis. J Am Geriatr Soc. 2001; 49:1234–40. https://doi.org/10.1046/j.1532-5415.2001.04990.x [PubMed]
- 18. Manavalan A, Mishra M, Feng L, Sze SK, Akatsu H, Heese K. Brain site-specific proteome changes in aging-related dementia. Exp Mol Med. 2013; 45:e39. https://doi.org/10.1038/emm.2013.76 [PubMed]
- 19. Conti V, Corbi G, Simeon V, Russomanno G, Manzo V, Ferrara N, Filippelli A. Aging-related changes in oxidative stress response of human endothelial cells. Aging Clin Exp Res. 2015; 27:547–53. https://doi.org/10.1007/s40520-015-0357-9 [PubMed]
- 20. Dayal S, Wilson KM, Motto DG, Miller FJ
Jr , Chauhan AK, Lentz SR. Hydrogen peroxide promotes aging-related platelet hyperactivation and thrombosis. Circulation. 2013; 127:1308–16. https://doi.org/10.1161/CIRCULATIONAHA.112.000966 [PubMed] - 21. Boada M, Antúnez C, Ramírez-Lorca R, DeStefano AL, González-Pérez A, Gayán J, López-Arrieta J, Ikram MA, Hernández I, Marín J, Galán JJ, Bis JC, Mauleón A, et al, and Alzheimer’s Disease Neuroimaging Initiative. ATP5H/KCTD2 locus is associated with Alzheimer’s disease risk. Mol Psychiatry. 2014; 19:682–87. https://doi.org/10.1038/mp.2013.86 [PubMed]
- 22. Lu Y, Liu X, Shi S, Su H, Bai X, Cai G, Yang F, Xie Z, Zhu Y, Zhang Y, Zhang S, Li X, Wang S, et al. Bioinformatics analysis of proteomic profiles during the process of anti-Thy1 nephritis. Mol Cell Proteomics. 2012; 11:008755. https://doi.org/10.1074/mcp.M111.008755 [PubMed]
- 23. Wang Y, Chen J, Chen L, Tay YC, Rangan GK, Harris DC. Induction of monocyte chemoattractant protein-1 in proximal tubule cells by urinary protein. J Am Soc Nephrol. 1997; 8:1537–45. [PubMed]