Submit an Article
Navigate
Home
Editorial Board
Editorial Policies
Current Volume
Archive
Scientific Integrity
Publication Ethics Statements
Interviews with Outstanding Authors
Newsroom
Sponsored Conferences
Podcast
Contact
Special Collections
Submit an Article
Online ISSN: 1945-4589
Research Paper
|
Volume 10, Issue 6
|
pp. 1192–1205
Identification of proteins potentially associated with renal aging in rats
Back to article
Figure 2
(2 of 4)
−
100%
+
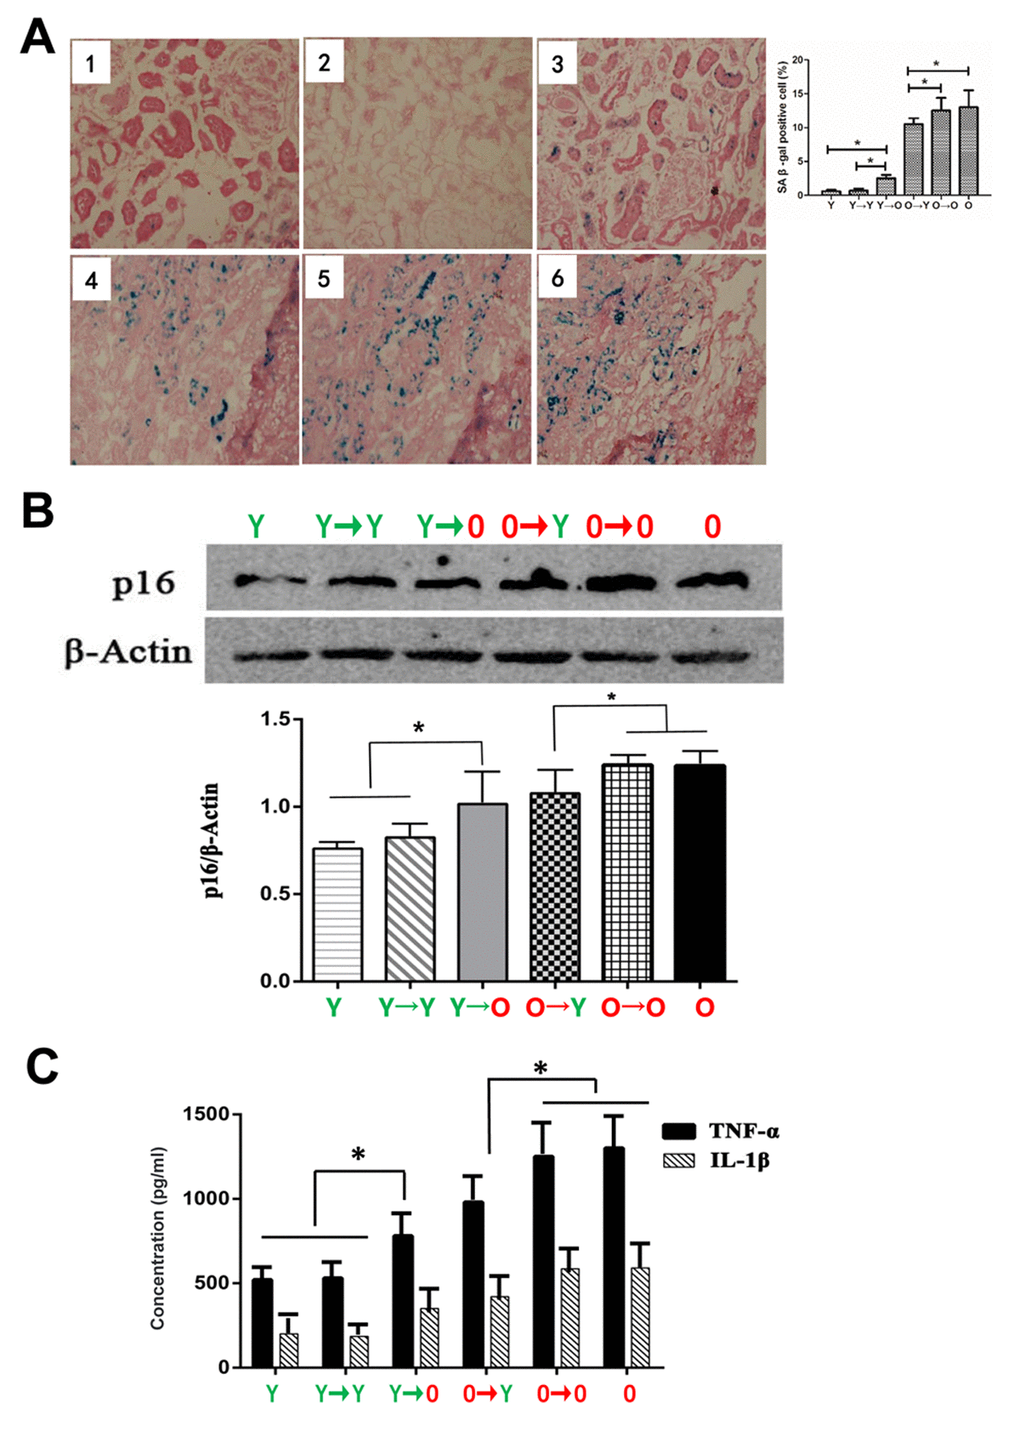
Figure 2.
Levels of aging biomarkers.
(
A
) SA-β-gal staining in each group (*p < 0.05). (
B
) Western blot showing p16 expression levels (*p < 0.05). (
C
) Results of specific ELISAs showing expression levels of TNF-α and IL-1β (*p < 0.05).