


Introduction
Amyotrophic lateral sclerosis (ALS) is a progressive age-dependent neurodegenerative disease characterized by degeneration and death of upper (motor cortex) and lower (brain stem and spinal cord) motor neurons, resulting in muscle atrophy, together with variable frontotemporal lobar degeneration (FTLD). ALS may be sporadic (sALS) with unknown cause, in up to 90%-92% of cases, or inherited (fALS), accounting for about 8-10% of cases, most of them transmitted as autosomal dominant but also recessive and X-linked in some families. However, about 13% of sALS cases bear a gene mutation linked to fALS. Main pathological features in sALS are loss of myelin and axons in the pyramidal tracts and anterior spinal roots, chromatolysis of motor neurons, axonal spheroids in the anterior horn, cystatin C-containing Bunina bodies in motor neurons, ubiquitin-immunoreactive TDP-43-positive skein-like and spherical inclusions in motor neurons, and TDP-43 inclusions in oligodendroglial cells. In many cases, the frontal cortex shows cytoplasmic TDP-43-immunoreactive intracytoplasmic inclusions in neurons and oligodendocytes, and neuropil threads. Neuron loss and spongiosis in the upper cortical layers are usually restricted to cases with severe cognitive impairment and frontotemporal dementia [1,2].
Several mechanisms have been proposed as contributory factors in the pathogenesis of motor neuron damage in sALS including excitoxicity, mitochondrial and energy metabolism failure, oxidative stress damage, altered glial cells, inflammation, cytoskeletal ab-normalities, alterations in RNA metabolism, and altered TDP-43 metabolism, among others [3–16]. Increased understanding on the pathogenesis of sALS has emerged from the use of transcriptome analysis of the spinal cord and motor cortex [17–26]. Previous transcriptomic studies center in the spinal cord and motor cortex in separate groups of patients, cover a limited number of cases, identify and validate a few genes not coincidental among the different studies. Selection of the sample may account for these differences. Further microarray studies carried out on isolated motor neurons of the spinal cord obtained by laser micro-dissection in sALS cases have revealed up-regulation of genes associated with cell signalling and cell death and down-regulation of genes linked to transcription and composition of the cytoskeleton [27]. Curiously, similar studies performed on samples from individuals bearing mutations linked to ALS show different regulated transcripts, thus suggesting gene expression variants in the spinal cord in fALS [28,29].
Importantly, no gene expression analyses are available in the frontal cortex area 8 in sALS in spite that frontal alterations are common in this disease. Moreover, ALS and FTLD with TDP inclusions (FTLD-TDP) are within the same disease spectrum [1].
The present study analyzes gene expression in the anterior horn of the spinal cord and frontal cortex area 8 in a series of 18 sALS cases and 23 controls. The main goals of the present study are to analyze and compare gene expression in these two regions, and more specifically to identify altered gene expression and clusters with specific functions in the anterior horn and frontal cortex area 8. Thus, the present study focuses on the pathogenesis of motor neuron damage responsible of altered motor function, and frontal cortex at preclinical stages of cognitive impairment.
Results
Microarray analysis
Cofactors age and gender were not relevant for the analysis. 9,563 gene sequences were detected across all samples. Heat map indicates differences in transcripts expression levels between control and ALS cases in the anterior cord of the spinal cord and in frontal cortex area 8 (Figure 1). We identified 747 genes differentially expressed with p-value lower than or equal to 0.05 in the anterior horn of the spinal cord (up: 507 and down: 240) and 2,300 genes differentially expressed in the frontal cortex area 8 (up: 1,409 and down: 891) in sALS (Figure 1).
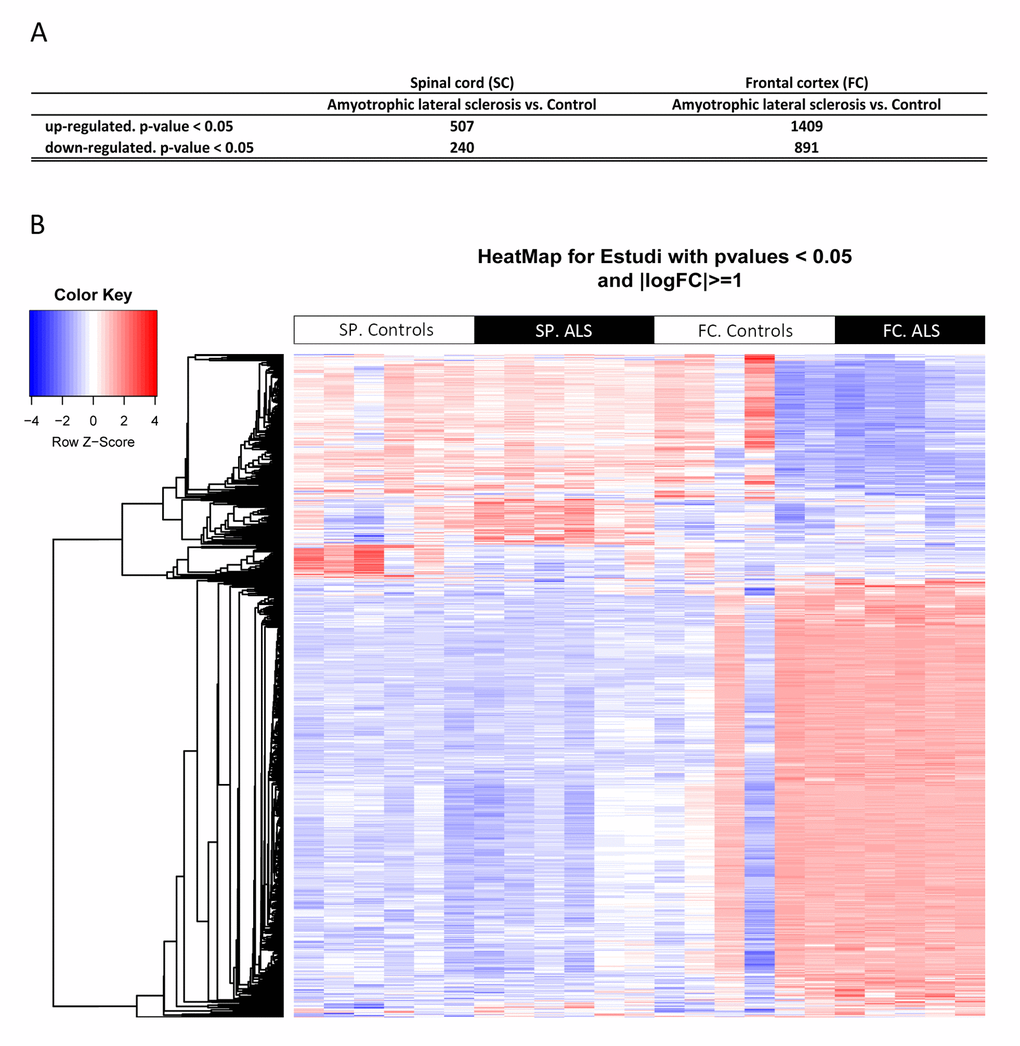
Figure 1. (A) Total number of significantly different expressed genes comparing transcriptomic profiles between groups and regions. (B) Hierarchical clustering heat map of expression intensities of mRNA array transcripts reflect differential gene expression profiles in the anterior horn of the spinal cord and frontal cortex area 8 in ALS compared with controls. Differences between groups are considered statistically significant at p-value ≤ 0.05. Abbreviations: ALS: amyotrophic lateral sclerosis; FC: frontal cortex area 8; mRNA: messenger RNA; SP: anterior horn of the spinal cord lumbar level.
Supplementary Table 1 and Supplementary Table 2 identify all de-regulated genes. Post-analysis microarray data of differentially expressed genes assessed with enrichment analysis against Go Ontology database are shown in Tables 1 and 2.
Table 1. Main significant clusters of altered genes in spinal cord of ALS samples.
| Cluster | Gene names | Size | Count | Odds Ratio | p-value | Deregulation |
| Activation of blood coagulation via clotting cascade | F3, ANO6 | 2 | 2 | Inf | 0.000574 | Up |
| Antigen processing and presentation of exogenous peptide antigen | CTSS, FCER1G, FCGR1A, HLA-A, HLA-B, HLA-C, HLA-DMA, HLA-DMB, HLA-DQA1, HLA-DQA2, HLA-DQB1, HLA-DQB2, HLA-DRB1, HLA-DRB5, HLA-F, HLA-G, NCF2, PSMB8, PSMB9, PSMD5, TAP1, IFI30 | 165 | 22 | 6.58 | 6.84e-11 | Up |
| Antigen processing and presentation of exogenous peptide antigen via MHC class I | CTSS, FCER1G, FCGR1A, HLA-A, HLA-B, HLA-C, HLA-F, HLA-G, NCF2, PSMB8, PSMB9, PSMD5, TAP1, IFI30 | 75 | 14 | 9.66 | 2.45e-09 | Up |
| Antigen processing and presentation of exogenous peptide antigen via MHC class I, TAP-independent | CTSS, HLA-A, HLA-B, HLA-C, HLA-F, HLA-G | 9 | 6 | 82.7 | 1.45e-08 | Up |
| Antigen processing and presentation of exogenous peptide antigen via MHC class II | CTSS, FCER1G, HLA-DMA, HLA-DMB, HLA-DQA1, HLA-DQA2, HLA-DQB1, HLA-DQB2, HLA-DRB1, HLA-DRB5, IFI30 | 92 | 11 | 5.66 | 1.24e-05 | Up |
| Antigen processing and presentation of peptide antigen via MHC class I | CTSS, FCER1G, FCGR1A, HLA-A, HLA-B, HLA-C, HLA-F, HLA-G, NCF2, PSMB8, PSMB9, PSMD5, TAP1, IFI30 | 97 | 14 | 7.09 | 7.58e-08 | Up |
| Apoptotic process | AHR, APOE, FAS, BCL2A1, BCL6, BMP2, BTK, CAMK2D, CASP1, CASP4, TNFSF8, CDKN1A, CTSC, DAB2, NQO1, ECT2, EDN1, F3, FCER1G, HCK, HGF, HIF1A, HMOX1, ICAM1, IFI16, IL1A, ITGA5, JAK3, LMNB1, LYN, MNDA, MYC, NCF2, NOS3, P2RX4, PLAGL1, PLAUR, PLSCR1, PRLR, PSMB8, PSMB9, PSMD5, PTPN2, CCL2, CCL19, SNAI2, STAT1, TEK, TGFB2, TLR2, TLR3, GPR65, YBX3, NOL3, SOCS3, LY86, IKBKE, CHL1, PPP1R15A, RRM2B, SHISA5, TNFRSF12A, ACSL5, FNIP2, DNASE2B, ZMAT3, NOA1, FGD3, IL33, DEDD2, ANO6 | 1745 | 71 | 1.89 | 5.22e-06 | Up |
| Apoptotic signaling pathway | FAS, BCL2A1, BTK, CASP4, CDKN1A, CTSC, ECT2, HGF, HIF1A, HMOX1, ICAM1, IFI16, IL1A, NOS3, P2RX4, PLAUR, PTPN2, SNAI2, TGFB2, TLR3, YBX3, NOL3, IKBKE, PPP1R15A, RRM2B, SHISA5, TNFRSF12A, ACSL5, FNIP2, FGD3, IL33, DEDD2 | 596 | 32 | 2.43 | 1.88e-05 | Up |
| Axonemal dynein complex assembly | DNAH5, DNAI1, TEKT2, ZMYND10, ARMC4, DNAH7, CCDC114, CCDC151, DNAAF1, CCDC39 | 21 | 10 | 175 | 8.54e-18 | Down |
| Axoneme | DNAH5, DNAH9, SPAG6, DNAI1, DCDC2, HYDIN, CFAP46, ARMC4, MNS1, DNAH7, CFAP74, CCDC114, CCDC151, DNAAF1, CFAP54, DNAH2, SPAG17, CFAP221, CCDC39, RSPH4A | 89 | 20 | 52.5 | 1.31e-25 | Down |
| Axoneme assembly | DNAH5, DNAI1, TEKT2, ZMYND10, HYDIN, CFAP46, ARMC4, DNAH7, CFAP74, RSPH1, CCDC114, CCDC151, DNAAF1, SPAG17, CCDC39, RSPH4A | 42 | 16 | 128 | 5.9e-26 | Down |
| B cell mediated immunity | FAS, BCL6, BTK, C1QB, C1QC, C7, FCER1G, HLA-DMA, HLA-DQB1, HLA-DRB1, HLA-DRB5, CFI, IL4R, CD226, TLR8 | 103 | 15 | 7.18 | 2.28e-08 | Up |
| Cellular protein modification process | IL12RB1, INS, KCNE1, MAK, CFP, RASA4, TRAK2, MYLK3, NEK5, C17orf97, PPIAL4A | 3527 | 11 | 0.473 | 0.00885 | Down |
| Cellular response to interferon-gamma | CAMK2D, EDN1, FCGR1A, GBP1, HCK, HLA-A, HLA-B, HLA-C, HLA-DQA1, HLA-DQA2, HLA-DQB1, HLA-DQB2, HLA-DRB1, HLA-DRB5, HLA-F, HLA-G, ICAM1, IRF8, OAS2, PTPN2, CCL2, CCL19, STAT1, SOCS3, IFI30, TRIM38, TRIM5 | 126 | 27 | 11.9 | 1.95e-18 | Up |
| Clathrin-coated endocytic vesicle membrane | FCGR1A, HLA-DQA1, HLA-DQA2, HLA-DQB1, HLA-DQB2, HLA-DRB1, HLA-DRB5 | 49 | 7 | 7.32 | 0.000108 | Up |
| Copper ion import | ATP7B, SLC31A1, STEAP4 | 7 | 3 | 30.7 | 0.000446 | Up |
| Cytokine production involved in immune response | BCL6, BTK, FCER1G, HLA-A, HMOX1, JAK3, SLC11A1, TEK, TGFB2, TLR2, TLR3, TREM1 | 69 | 12 | 8,81 | 7,87E-08 | Up |
| Endolysosome membrane | TLR3, TLR7, TLR8 | 4 | 3 | 131 | 4.51e-05 | Up |
| Fc receptor mediated stimulatory signaling pathway | FCER1G, FCGR1A, FCGR2A, FGR, HCK, ITPR3, LYN, PLSCR1, CD226, MYO1G | 77 | 10 | 6.21 | 1.47e-05 | Up |
| Humoral immune response mediated by circulating immunoglobulin | C1QB, C1QC, C7, HLA-DQB1, HLA-DRB1, HLA-DRB5, CFI | 46 | 7 | 7.42 | 0.000103 | Up |
| Igg binding | FCER1G, FCGR1A, FCGR2A, FCGR2B | 10 | 4 | 28.3 | 5.42e-05 | Up |
| Immunoglobulin production | FAS, BCL6, CD37, HLA-DQB1, HLA-DRB1, HLA-DRB5, IL4R, TNFSF13B, POLM, IL33 | 87 | 10 | 5.4 | 4.34e-05 | Up |
| Inner dynein arm assembly | TEKT2, ZMYND10, DNAH7, DNAAF1, CCDC39 | 10 | 5 | 182 | 1.44e-09 | Down |
| Integral component of lumenal side of endoplasmic reticulum membrane | HLA-A, HLA-B, HLA-C, HLA-DQA1, HLA-DQA2, HLA-DQB1, HLA-DQB2, HLA-DRB1, HLA-DRB5, HLA-F, HLA-G | 28 | 11 | 28.8 | 1.04e-11 | Up |
| Interferon-alpha production | TLR3, NMI, TLR7, TLR8 | 18 | 4 | 11.7 | 0.000764 | Up |
| Interferon-beta biosynthetic process | TLR3, NMI, TLR7, TLR8 | 8 | 4 | 41.1 | 2.12e-05 | Up |
| Interferon-gamma biosynthetic process | TLR3, EBI3, TLR7, TLR8 | 16 | 4 | 13.7 | 0.000472 | Up |
| Interleukin-10 production | FCER1G, HLA-DRB1, HLA-DRB5, JAK3, TLR2, PDCD1LG2 | 42 | 6 | 6.87 | 0.000463 | Up |
| Intrinsic apoptotic signaling pathway | BCL2A1, CASP4, CDKN1A, HIF1A, HMOX1, IFI16, PLAUR, PTPN2, SNAI2, YBX3, NOL3, IKBKE, PPP1R15A, RRM2B, SHISA5, FNIP2 | 284 | 16 | 2.49 | 0.00143 | Up |
| Macrophage activation | IL4R, SLC11A1, TLR1, SBNO2, CD93, TLR7, TLR8, IL33 | 48 | 8 | 8.29 | 1.66e-05 | Up |
| Mast cell cytokine production | BCL6, FCER1G, HMOX1 | 7 | 3 | 30.7 | 0.000446 | Up |
| MHC class II receptor activity | HLA-DQA1, HLA-DQA2, HLA-DQB1, HLA-DQB2, HLA-DRB1 | 11 | 5 | 35.4 | 2.73e-06 | Up |
| MHC protein complex | HLA-A, HLA-B, HLA-C, HLA-DMA, HLA-DMB, HLA-DQA1, HLA-DQA2, HLA-DQB1, HLA-DQB2, HLA-DRB1, HLA-DRB5, HLA-F, HLA-G | 25 | 13 | 48.4 | 1.34e-15 | Up |
| Microtubule bundle formation | DNAH5, DNAI1, TEKT2, ZMYND10, HYDIN, CFAP46, ARMC4, DNAH7, CFAP74, RSPH1, CCDC114, CCDC151, DNAAF1, SPAG17, CCDC39, RSPH4A | 63 | 16 | 70.7 | 1.18e-22 | Down |
| Monocyte chemotaxis | CCR1, LYN, CCL2, CCL19, PLA2G7, ANO6 | 49 | 6 | 5.75 | 0.00107 | Up |
| Outer dynein arm assembly | DNAH5, DNAI1, ZMYND10, ARMC4, CCDC114, CCDC151, DNAAF1 | 11 | 7 | 325 | 5.6e-14 | Down |
| Peptide antigen binding | HLA-A, HLA-B, HLA-C, HLA-DQA1, HLA-DQB1, HLA-DRB1, HLA-DRB5, HLA-F, HLA-G, TAP1 | 26 | 10 | 26.9 | 1.57e-10 | Up |
| Platelet-derived growth factor receptor binding | TYMP, ITGA5, ITGB3, LYN | 12 | 4 | 21.2 | 0.000123 | Up |
| Positive regulation of Fc receptor mediated stimulatory signaling pathway | LYN, CD226 | 2 | 2 | Inf | 0.000574 | Up |
| Positive regulation of interleukin-6 production | FCER1G, TLR1, TLR2, TLR3, TLR7, IL33 | 55 | 6 | 5.05 | 0.00197 | Up |
| Positive regulation of interleukin-8 production | TLR2, TLR3, TLR5, TLR7, TLR8 | 42 | 5 | 5.56 | 0.00318 | Up |
| Positive regulation of tumor necrosis factor production | FCER1G, CCL2, CCL19, TLR1, TLR2, TLR3 | 51 | 6 | 5.5 | 0.00133 | Up |
| Protection from natural killer cell mediated cytotoxicity | HLA-A, HLA-B, TAP1 | 5 | 3 | 61.5 | 0.000132 | Up |
| Regulated secretory pathway | ANXA3, FCER1G, FGR, HCK, HMOX1, IL4R, LYN, STX11, CD300A, RAB11FIP2, RAB11FIP1 | 73 | 11 | 7.4 | 1.23e-06 | Up |
| Regulation of apoptotic process | APOE, FAS, BCL2A1, BCL6, BMP2, BTK, CAMK2D, CASP1, CASP4, CDKN1A, CTSC, DAB2, NQO1, ECT2, EDN1, F3, FCER1G, HCK, HGF, HIF1A, HMOX1, ICAM1, IL1A, ITGA5, JAK3, LYN, MNDA, MYC, NCF2, NOS3, PLAUR, PRLR, PSMB8, PSMB9, PSMD5, PTPN2, CCL2, CCL19, SNAI2, STAT1, TEK, TGFB2, TLR3, YBX3, NOL3, SOCS3, CHL1, RRM2B, TNFRSF12A, ACSL5, ZMAT3, FGD3, DEDD2, ANO6 | 1344 | 54 | 1.82 | 0.000117 | Up |
| Regulation of B cell apoptotic process | BCL6, BTK, LYN | 16 | 3 | 9.45 | 0.00608 | Up |
| Regulation of coagulation | APOE, EDN1, F3, FCER1G, LYN, NOS3, PLAU, PLAUR, THBD, HPSE, ADAMTS18, ANO6 | 85 | 12 | 6.87 | 8.31e-07 | Up |
| Regulation of cytokine biosynthetic process | CD86, HMOX1, IL1A, TLR1, TLR2, TLR3, NMI, EBI3, TLR7, TLR8 | 93 | 10 | 5.01 | 7.72e-05 | Up |
| Regulation of extrinsic apoptotic signaling pathway | FAS, HMOX1, ICAM1, IL1A, NOS3, SNAI2, TGFB2, NOL3, TNFRSF12A, ACSL5, DEDD2 | 155 | 11 | 3.17 | 0.0013 | Up |
| Regulation of Fc receptor mediated stimulatory signaling pathway | LYN, PLSCR1, CD226 | 5 | 3 | 61.5 | 0.000132 | Up |
| Regulation of hemostasis | APOE, EDN1, F3, FCER1G, LYN, NOS3, PLAU, PLAUR, THBD, HPSE, ADAMTS18, ANO6 | 81 | 12 | 7.27 | 4.87e-07 | Up |
| Regulation of leukocyte apoptotic process | BCL6, BTK, FCER1G, HIF1A, JAK3, LYN, CCL19, TGFB2 | 74 | 8 | 5.02 | 0.000386 | Up |
| Regulation of lipid kinase activity | FGR, LYN, CCL19, TEK, NRBF2 | 47 | 5 | 4.89 | 0.0052 | Up |
| Regulation of mast cell activation | FCER1G, FGR, HMOX1, IL4R, LYN, PLSCR1, CD226, CD300A | 31 | 8 | 14.4 | 4.96e-07 | Up |
| Regulation of mast cell degranulation | FCER1G, FGR, HMOX1, IL4R, LYN, CD300A | 24 | 6 | 13.8 | 1.71e-05 | Up |
| Regulation of microtubule movement | DNAH11, ARMC4, DNAAF1, CCDC39 | 18 | 4 | 51.3 | 3.03e-06 | Down |
| Regulation of natural killer cell mediated immunity | HLA-A, HLA-B, PVR, TAP1, CD226 | 27 | 5 | 9.36 | 0.000405 | Up |
| Regulation of protein metabolic process | FOXJ1, INS, CFP, RASA4, NEK5, DTHD1 | 2448 | 6 | 0.381 | 0.00803 | Down |
| Regulation of protein modification process | INS, RASA4 | 1641 | 2 | 0.192 | 0.00288 | Down |
| Regulation of T-helper 1 cell differentiation | HLX, IL4R, JAK3, CCL19 | 9 | 4 | 32.9 | 3.74e-05 | Up |
| T cell costimulation | CD86, HLA-DQA1, HLA-DQA2, HLA-DQB1, HLA-DQB2, HLA-DRB1, HLA-DRB5, LYN, CCL19, TNFSF13B, PDCD1LG2 | 71 | 11 | 7.65 | 9.25e-07 | Up |
| TAP binding | HLA-A, HLA-B, HLA-C, HLA-F, TAP1 | 7 | 5 | 106 | 1.34e-07 | Up |
| T-helper 2 cell differentiation | BCL6, CD86, HLX, IL4R | 14 | 4 | 16.4 | 0.00027 | Up |
Table 2. Main significant clusters of altered genes in frontal cortex of ALS samples.
| Cluster | Gene names | Size | Count | Odds Ratio | p-value | Deregulation |
| Adenylate cyclase-inhibiting G-protein coupled receptor signaling pathway | ADCY1, CHRM1, CHRM3, GNAI3, MCHR1, GRM8, HTR1B, HTR1E, HTR1F, NPY1R, OPRK1, OPRM1, SSTR2 | 64 | 13 | 3.79 | 0.000164 | Up |
| Astrocyte differentiation | ABL1, MAG, NKX2-2, NOTCH1, POU3F2, S100B, TAL1, CNTN2, SOX8 | 53 | 9 | 5.12 | 0.000184 | Down |
| Axolemma | KCNC1, KCNC2, KCNH1, ROBO2, SLC1A2 | 14 | 5 | 8.26 | 0.00124 | Up |
| Axon | DAGLA, CAMK2D, CCK, CHRM1, CHRM3, AP1S1, CTNNA2, DLG4, DRD1, EPHA4, PTK2B, FGF13, GAP43, GARS, GRIA1, GRIK5, GRIN2A, HTR2A, KCNB1, KCNC1, KCNC2, KCNH1, KCNK2, KCNMA1, KCNQ2, KCNQ3, MYH10, NPY1R, NRCAM, NRGN, OPRK1, PAK1, PFN2, MAP2K1, PTPRN2, ROBO2, SCN1A, SCN1B, SCN2A, SCN8A, CCL2, SLC1A2, SNCA, STXBP1, SYN1, KCNAB1, FZD3, GLRA3, PRSS12, CNTNAP1, KCNAB2, NRP1, CDK5R1, BSN, SYT7, SYNGR1, DGKI, NRXN1, HOMER1, KATNB1, SEMA3A, OLFM1, SLC9A6, CPLX1, AAK1, ADGRL1, TPX2, UNC13A, MYCBP2, NCS1, PACSIN1, STMN3, SEPT11, SLC17A7, TBC1D24, NDEL1, LMTK3, MTPN, CNTN4, LRRTM1, HCN1 | 358 | 81 | 4.6 | 1.68e-24 | Up |
| Axon extension | BMPR2, NRCAM, PPP3CB, SLIT1, CDKL5, NRP1, CDK5R1, LHX2, SEMA3A, OLFM1, SLC9A6, BCL11A, ISLR2, NDEL1 | 91 | 14 | 2.7 | 0.00176 | Up |
| Axon hillock | CCK, TPX2, NDEL1 | 7 | 3 | 11.1 | 0.00729 | Up |
| Cadherin binding | CDH13, CTNNA2, TRPC4, CDK5R1, AKAP5, MMP24, PTPRT | 29 | 7 | 4.81 | 0.00167 | Up |
| Calcineurin complex | ITPR1, PPP3CA, PPP3CB, PPP3R1 | 4 | 4 | Inf | 1.59e-05 | Up |
| Calcium channel regulator activity | CACNB2, FKBP1B, ITPR1, PRKCB, STX1A, NRXN1, TSPAN13, HPCAL4, CACNA2D3 | 36 | 9 | 5.05 | 0.000281 | Up |
| Calcium ion-dependent exocytosis of neurotransmitter | CACNA1A, SYT1, SYT5, DOC2A, SYT7, RIMS2, RAB3GAP1, RIMS1, SYT13, SYT12 | 28 | 10 | 8.25 | 4.76e-06 | Up |
| Calmodulin binding | ADCY1, ADD2, ATP2B1, ATP2B2, CACNA1C, CAMK4, CAMK2A, CAMK2B, CAMK2D, GAP43, ITPKA, KCNH1, KCNN1, KCNQ3, MAP2, MYH10, MYO5A, NOS2, NRGN, PDE1B, PPP3CA, PPP3CB, PPP3R1, RGS4, RIT2, RYR2, SLC8A2, SLC8A1, AKAP5, CAMKK2, ARPP21, PLCB1, KCNH5, CAMK1D, CAMK1G, CAMKV, CAMKK1, PNCK, CFAP221, RIIAD1 | 176 | 40 | 4.57 | 5.38e-13 | Up |
| Calmodulin-dependent protein kinase activity | CAMK4, CAMK2A, CAMK2B, CAMK2D, PTK2B, ITPKA, CAMKK2, CAMK1D, CAMK1G, CAMKK1, PNCK | 32 | 11 | 7.95 | 2.02e-06 | Up |
| Camp binding | PDE2A, PDE4A, PRKAR1B, PRKAR2B, RAPGEF2, RAPGEF4, HCN1 | 24 | 7 | 6.23 | 0.000487 | Up |
| Central nervous system neuron axonogenesis | EPHA4, SCN1B, NR2E1, MYCBP2, PRDM8, ARHGEF28, NDEL1 | 29 | 7 | 4.71 | 0.00187 | Up |
| Chloride channel activity | CLIC2, GABRA1, GABRA2, GABRA3, GABRA4, GABRA5, GABRB2, GABRB3, GABRD, GABRG3, GLRB, SLC26A4, GLRA3, SLC17A7, SLC26A8, ANO5 | 78 | 16 | 3.93 | 2.05e-05 | Up |
| Clathrin binding | SYT1, SYT5, DOC2A, SYT7, SNAP91, HMP19, SYTL2, CEMIP, SYT13, SMAP1, SYT16, SYT12 | 56 | 12 | 4.14 | 0.000141 | Up |
| Compact myelin | MAG, SIRT2, JAM3 | 12 | 3 | 8.38 | 0.00957 | Down |
| Cyclin-dependent protein serine/threonine kinase activity | CDK14, CDKL5, CDKL1, CDK5R1, CDKL2, CDK20 | 29 | 6 | 3.94 | 0.008 | Up |
| Cytoskeleton of presynaptic active zone | BSN, PCLO | 2 | 2 | Inf | 0.004 | Up |
| Dendrite | BMPR2, CACNA1A, CACNA1B, CACNA1C, CCK, CHRM1, CHRM3, CRMP1, DLG3, DLG4, DRD1, EPHA4, EPHA7, PTK2B, FGF13, GABRA5, GRIA1, GRIA2, GRIA3, GRIK5, GRIN2A, GRM1, GRM5, HTR2A, ITPKA, KCNB1, KCNC1, KCNC2, KCND3, KCNH1, KCNJ4, KCNQ3, MAP2, MYH10, NELL2, NRGN, OPRK1, PAK1, PRKAR2B, PRKCG, MAP2K1, RARA, RGS7, SCN8A, CCL2, SLC8A1, CDKL5, SYN1, KCNAB1, FZD3, PRSS12, CDK5R1, BSN, NEURL1, DGKI, HOMER1, CABP1, AKAP5, ARHGAP32, FRMPD4, SEMA3A, BAIAP2, SLC9A6, ARFGEF2, CHL1, PLK2, CPLX1, LZTS1, CPEB3, NCS1, NSMF, SHANK1, IFT57, SEPT11, ANKS1B, SLC4A10, TENM2, DLGAP3, JPH4, PPP1R9B, SHANK3, LMTK3, GRIN3A, SNAP47, CNIH2, HCN1 | 406 | 86 | 4.24 | 7.25e-24 | Up |
| Dendrite development | ADGRB3, CACNA1A, CAMK2B, CTNNA2, DLG4, EPHA4, HPRT1, ITPKA, MAP2, MEF2C, PAK1, PAK3, PPP3CA, CDKL5, NR2E1, NRP1, CDK5R1, NEURL1, AKAP5, RAPGEF2, KIAA0319, SEMA3A, BAIAP2, SLC9A6, PLK2, CIT, LZTS1, CPEB3, NEDD4L, MAPK8IP2, RBFOX2, NGEF, NSMF, SLITRK5, PACSIN1, SHANK1, DCDC2, BCL11A, FEZF2, CAMK1D, SHANK3, GRIN3A, FMN1 | 178 | 43 | 4.85 | 1.44e-14 | Up |
| Dendrite extension | PARK2, SYT1, RIMS2, SLC9A6, RIMS1, UNC13A, NEDD4L, CPNE5 | 21 | 8 | 9.12 | 2.53e-05 | Up |
| Dendrite morphogenesis | ADGRB3, CACNA1A, CAMK2B, CTNNA2, DLG4, EPHA4, HPRT1, ITPKA, MAP2, PAK3, PPP3CA, CDKL5, NR2E1, CDK5R1, AKAP5, RAPGEF2, SEMA3A, BAIAP2, CIT, LZTS1, NEDD4L, MAPK8IP2, RBFOX2, NGEF, NSMF, SLITRK5, SHANK1, DCDC2, SHANK3, FMN1 | 109 | 30 | 5.73 | 4E-12 | Up |
| Dendritic shaft | CACNA1C, DLG3, DRD1, GRM5, HTR2A, MAP2, PRKAR2B, SLC8A1, HOMER1, AKAP5, LZTS1, JPH4, CNIH2 | 37 | 13 | 8.11 | 2.07e-07 | Up |
| Dendritic spine development | CAMK2B, DLG4, EPHA4, ITPKA, MEF2C, PAK1, PAK3, CDK5R1, NEURL1, BAIAP2, SLC9A6, PLK2, CPEB3, NGEF, SHANK1, SHANK3 | 58 | 16 | 5.68 | 4.06e-07 | Up |
| Dendritic spine membrane | ATP2B1, GRIA1, ITGA8, AKAP5, DDN | 9 | 5 | 18.6 | 0.000102 | Up |
| DNA metabolic process | BMPR2, CDKN2D, CIDEA, DACH1, HGF, IGF1, KCNK2, KPNA2, MAS1, KITLG, ORC4, PAK3, PIK3CA, PRKCG, CHAF1B, CDC7, NPM2, PPARGC1A, PARM1, CHD5, UBE2W, FBXW7, TSPYL2, BCL11B, SLF1, TBRG1, MAEL, XRCC6BP1, ZBED9, KLHDC3, STOX1, KIAA2022 | 867 | 32 | 0.549 | 0.000264 | Up |
| Ensheathment of neurons | MYRF, LPAR1, KCNJ10, KEL, MAG, MAL, NGFR, CLDN11, PMP22, POU3F2, KLK6, CNTN2, QKI, ARHGEF10, OLIG2, NDRG1, SIRT2, PARD3, FA2H, SH3TC2, JAM3, NKX6-2, SERINC5 | 101 | 23 | 7.53 | 4.57e-12 | Down |
| Excitatory postsynaptic potential | DLG4, PTK2B, GRIK5, GRIN2A, GRIN2B, MEF2C, PPP3CA, SNCA, STX1A, DGKI, NRXN1, RIMS2, RAB3GAP1, RIMS1, MAPK8IP2, SHANK1, CELF4, SLC17A7, NETO1, SHANK3 | 50 | 20 | 9.99 | 7.46e-12 | Up |
| GABA receptor activity | GABRA1, GABRA2, GABRA3, GABRA4, GABRA5, GABRB2, GABRB3, GABRD, GABRG3, GABBR2 | 22 | 10 | 12.6 | 2.77e-07 | Up |
| GABA receptor binding | GABRA5, AKAP5, ARFGEF2, JAKMIP1 | 14 | 4 | 6.03 | 0.0091 | Up |
| Glial cell development | MYRF, GSN, KCNJ10, NKX2-2, POU3F2, CNTN2, ARHGEF10, NDRG1, SIRT2, PHGDH, PARD3, FA2H, SH3TC2, NKX6-2 | 71 | 14 | 6.19 | 4.84e-07 | Down |
| Glutamate receptor activity | PTK2B, GRIA1, GRIA2, GRIA3, GRIK5, GRIN2A, GRIN2B, GRM1, GRM5, GRM8, GRIN3A | 27 | 11 | 10.4 | 2.72e-07 | Up |
| Innervation | GABRA5, GABRB2, GABRB3, PRKCG, NRP1, SEMA3A, UNC13A | 23 | 7 | 6.47 | 0.000412 | Up |
| Inositol phosphate metabolic process | PTK2B, ITPKA, MAS1, OCRL, SNCA, INPP4B, SYNJ1, PPIP5K1, PLCH1, PLCB1, NUDT11 | 65 | 11 | 3.02 | 0.00247 | Up |
| Ionotropic glutamate receptor activity | PTK2B, GRIA1, GRIA2, GRIA3, GRIK5, GRIN2A, GRIN2B, GRIN3A | 19 | 8 | 11 | 9.08e-06 | Up |
| JNK cascade | ADORA2B, EPHA4, PTK2B, FGF14, MAP3K9, MAP3K10, GADD45B, PAK1, PARK2, MAPK9, CCL19, MAP2K4, MAP3K6, RB1CC1, RASGRP1, PLCB1, MAPK8IP2, KIAA1804, DUSP19, ZNF675, MAGI3 | 185 | 21 | 1.9 | 0.00716 | Up |
| Lipid binding | ABCA1, ANXA5, APOD, AR, C3, LPAR1, HSD17B10, HIP1, HSPA2, KCNJ2, MAL, MYO1E, NPC1, P2RX7, PLD1, PTGS1, SELL, SNX1, ACOX2, IQGAP1, HIP1R, CYTH1, STARD3, FNBP1, RASGRP3, LDLRAP1, GLTP, ANKFY1, PXK, ADAP2, PARD3, PREX1, WDFY4, PLEKHF1, PRAM1, PAQR8, MVB12B, SNX29, SYTL4, ARAP1, FRMPD2, AMER2, NCF1C, C8orf44-SGK3 | 601 | 44 | 2.07 | 2.63e-05 | Down |
| Mrna processing | LGALS3, CELF2, PPARGC1A, CELF3, CPEB3, RBFOX2, RBFOX1, MTPAP, CELF4, CELF5, SRRM4, LSM11, RBFOX3 | 417 | 13 | 0.466 | 0.00202 | Up |
| Myelin maintenance | MYRF, NDRG1, FA2H, SH3TC2 | 11 | 4 | 14.2 | 0.000601 | Down |
| Myelin sheath | CA2, CNP, CRYAB, GSN, HSPA2, MAG, MOBP, MOG, MYO1D, CLDN11, RDX, CNTN2, NDRG1, SIRT2, PHGDH, GJC2, ERMN, MYH14, JAM3, SERINC5 | 156 | 20 | 3.77 | 2.29e-06 | Down |
| Myelination | MYRF, LPAR1, KCNJ10, KEL, MAG, MAL, NGFR, PMP22, POU3F2, KLK6, CNTN2, QKI, ARHGEF10, OLIG2, NDRG1, SIRT2, PARD3, FA2H, SH3TC2, JAM3, NKX6-2, SERINC5 | 98 | 22 | 7.38 | 1.81e-11 | Down |
| Negative regulation of neuron apoptotic process | CACNA1A, PTK2B, GABRA5, GABRB2, GABRB3, MEF2C, PARK2, PIK3CA, PRKCG, CCL2, SNCB, SNCA, STAR, STXBP1, NRP1, CHL1, PPARGC1A, OXR1, AGAP2 | 128 | 19 | 2.59 | 0.000465 | Up |
| Negative regulation of transcription, DNA-templated | ARNTL, RUNX1T1, CRYM, CYP1B1, DACH1, FGF9, FOXG1, H2AFZ, MEF2C, MAP3K10, TRIM37, PDE2A, RARA, RORB, SATB1, SNCA, SOX5, TBX15, THRB, NR2E1, WNT10B, CDK5R1, LRRFIP1, ZBTB33, BASP1, ZBTB18, KLF12, CPEB3, PLCB1, SATB2, NEDD4L, SIRT5, RBFOX2, ATAD2, TAGLN3, BCL11A, FEZF2, SMYD2, PRDM8, TENM2, MTA3, SCRT1, MAEL, PRICKLE1, EID2, ARX, ZNF675, KCTD1 | 1135 | 48 | 0.632 | 0.00083 | Up |
| Neuron apoptotic process | CACNA1A, EPHA7, PTK2B, GABRA5, GABRB2, GABRB3, GRIK5, KCNB1, MEF2C, PAK3, PARK2, PIK3CA, PRKCG, SCN2A, CCL2, SNCB, SNCA, STAR, STXBP1, NRP1, CDK5R1, CHL1, PPARGC1A, NSMF, OXR1, FBXW7, AGAP2, SDIM1 | 206 | 28 | 2.35 | 0.000117 | Up |
| Neuron spine | DLG4, DRD1, EPHA4, GRIA1, GRM5, ITPKA, MYH10, NRGN, PRKAR2B, SLC8A1, CDK5R1, NEURL1, DGKI, AKAP5, ARHGAP32, FRMPD4, BAIAP2, SLC9A6, ARFGEF2, LZTS1, SHANK1, SEPT11, ANKS1B, TENM2, DLGAP3, PPP1R9B, SHANK3, CNIH2 | 104 | 28 | 5.57 | 3.28e-11 | Up |
| Neuronal postsynaptic density | ADD2, ATP1A1, BMPR2, CAMK2A, CAMK2B, CTNNA2, DLG4, DMTN, GAP43, GRIN2B, MAP2, PAK1, PRKCG, BSN, DGKI, DLGAP1, HOMER1, BAIAP2, CAP2, CNKSR2, CLSTN1, MAPK8IP2, SHANK1, CLSTN2, SHANK3 | 64 | 25 | 9.69 | 3.02e-14 | Up |
| Neuron-neuron synaptic transmission | CA7, CACNA1A, CACNB4, CAMK4, DRD1, PTK2B, GABRA1, GABRB2, GLRB, GRIA1, GRIA2, GRIA3, GRIK5, GRIN2A, GRM1, GRM5, GRM8, HRH2, HTR1B, HTR2A, MEF2C, NPY5R, PAK1, PARK2, PRKCE, PTGS2, SNCA, STXBP1, SYT1, GLRA3, DGKI, DLGAP2, NRXN1, RAB3GAP1, UNC13A, MAPK8IP2, RASD2, TMOD2, SHC3, SLC17A7, SHANK3, GRIN3A, CNIH2 | 136 | 43 | 7.06 | 2.63e-19 | Up |
| Neurotransmitter secretion | CACNA1A, CACNA1B, CAMK2A, GAD1, GLS, GRIK5, MEF2C, PAK1, PARK2, PFN2, SLC1A1, SLC1A2, SNCA, STX1A, STXBP1, SYN1, SYN2, SYT1, SYT5, DOC2A, PPFIA4, PPFIA2, PPFIA3, CADPS, LIN7A, SYNJ1, SYT7, DGKI, BZRAP1, NRXN1, RIMS2, RIMS3, CPLX1, HRH3, ADGRL1, RAB3GAP1, RIMS1, UNC13A, PCLO, SYTL2, SLC17A7, SYT13, SYT16, SYT12, CADPS2, SNAP47 | 154 | 46 | 6.52 | 1.93e-19 | Up |
| Node of Ranvier | KCNQ2, KCNQ3, SCN1A, SCN1B, SCN2A, SCN8A | 15 | 6 | 9.92 | 0.000193 | Up |
| Nucleic acid metabolic process | ABCA2, ABL1, PARP4, AR, ATM, BMP8B, MYRF, CAPN3, CAT, CBFB, CCNA2, CDKN1C, CENPB, ELF1, EYA4, ERF, FGF1, FGFR2, GDF1, HSD17B10, HDAC1, HIP1, HOXA1, HOXA2, HOXA5, HOXB2, HOXB5, HOXD1, HOXD3, HSPA1A, FOXN2, JUP, SMAD5, SMAD9, MCM7, MEIS1, CIITA, FOXO4, NKX2-2, NOTCH1, YBX1, PBX3, PDE8A, ENPP2, POLR2L, POU3F2, PSEN1, RNH1, RPLP0, RPS5, RXRG, SALL1, SGK1, SOX10, SREBF1, STAT2, SYK, TAL1, TCF12, TRAF1, TRPS1, ZNF3, ZNF69, VEZF1, FZD5, ARHGEF5, HIST1H2AC, HIST1H3E, HIST1H4H, HIST1H4B, RNASET2, CCNE2, QKI, LITAF, ST18, ZNF536, DDX39A, OLIG2, HMG20B, SEMA4D, TXNIP, DMRT2, TCFL5, ATF7, IKZF2, ZNF652, SIRT2, SAMD4A, KANK1, HEY2, BAMBI, ZNF521, ZBTB20, GREM1, CECR2, HIPK2, KLF15, BAZ2B, SLC40A1, SOX8, ZBTB7B, RRNAD1, KLF3, DDIT4, ZNF280D, TRIM62, CHD7, SLF2, ZNF83, SLC2A4RG, OTUD7B, BBX, MAVS, SFMBT2, NCOA5, TP53INP2, ZNF462, ARHGAP22, CREB3L2, CRTC3, TRAK2, BHLHE41, DBF4B, TSC22D4, NKX6-2, ZBTB37, LOXL3, OLIG1, ZSWIM7, GABPB2, CC2D1B, ZBTB12, ZNF844, ZNF326, FRYL, C9orf142, ZNF710, GTF2IRD2B, DBX2, HIST2H4B, ZNF812, TMEM229A, GTF2H2C_2, C8orf44-SGK3 | 4679 | 144 | 0.718 | 0.000284 | Up |
| Oligodendrocyte development | MYRF, GSN, KCNJ10, NKX2-2, CNTN2, FA2H, NKX6-2 | 32 | 7 | 6.99 | 0.000187 | Down |
| Oligodendrocyte differentiation | BOK, MYRF, CNP, GSN, KCNJ10, NKX2-2, NOTCH1, SOX10, CNTN2, OLIG2, SOX8, FA2H, NKX6-2 | 75 | 13 | 5.27 | 5.64e-06 | Down |
| Phosphatase activity | ALPL, ATP1A1, CDKN3, DUSP8, OCRL, PPP2R5D, PPP3CA, PPP3CB, PPP3R1, MAP2K1, PTPN3, PTPN4, PTPRN2, PTPRR, INPP4B, SYNJ1, PPIP5K1, LPPR4, PTPRT, PTP4A3, NT5DC3, PDP1, LPPR3, PTPN5, DUSP19, PPM1L, PPM1J | 254 | 27 | 1.81 | 0.00475 | Up |
| Phosphatidylinositol binding | HIP1, KCNJ2, MYO1E, PLD1, SNX1, IQGAP1, HIP1R, LDLRAP1, ANKFY1, PXK, ADAP2, PARD3, PLEKHF1, SNX29, ARAP1, FRMPD2, AMER2, NCF1C, C8orf44-SGK3 | 187 | 19 | 2.92 | 9.82e-05 | Down |
| Phospholipase C-activating G-protein coupled receptor signaling pathway | ADRA1B, CCKBR, CHRM1, CHRM3, DRD1, GRM1, GRM5, HRH2, HTR2A, OPRK1, OPRM1, HOMER1, MCHR2 | 81 | 13 | 2.84 | 0.00172 | Up |
| Phospholipid binding | ABCA1, ANXA5, LPAR1, HIP1, KCNJ2, MYO1E, PLD1, SNX1, IQGAP1, HIP1R, LDLRAP1, ANKFY1, PXK, ADAP2, PARD3, PREX1, WDFY4, PLEKHF1, SNX29, SYTL4, ARAP1, FRMPD2, AMER2, NCF1C, C8orf44-SGK3 | 332 | 25 | 2.1 | 0.000966 | Down |
| Phospholipid translocation | ABCA1, P2RX7, ATP10B, ATP11A | 20 | 4 | 6.21 | 0.00667 | Down |
| Positive regulation of RNA metabolic process | ACVR1B, ARNTL, BMPR2, CAMK4, CAMK2A, CDH13, ETV1, H2AFZ, HGF, IGF1, KRAS, LUM, MEF2C, TRIM37, PPP1R12A, NEUROD2, PARK2, PLAGL1, PPP3CA, PPP3CB, PPP3R1, PRKCB, MAPK9, MAP2K1, RARA, RORB, SOX5, STAT4, THRB, NR2E1, TRAF5, WNT10B, ITGA8, LMO4, LDB2, LHX2, MICAL2, CAMKK2, TBR1, PPARGC1A, MLLT11, CELF3, KLF12, CPEB3, MAPRE3, DDN, PLCB1, SATB2, ATAD2, BCL11A, TESC, FEZF2, FBXW7, DCAF6, CELF4, ARNTL2, ATXN7L3, CAMK1D, MKL2, NEUROD6, BCL11B, CSRNP3, MED12L, RHEBL1, MTPN, SOHLH1 | 1455 | 66 | 0.678 | 0.0011 | Up |
| Postsynapse | ADD2, ATP1A1, BMPR2, CACNA1C, CAMK2A, CAMK2B, CHRM1, CHRM3, CTNNA2, DLG3, DLG4, DRD1, DMTN, EPHA4, EPHA7, PTK2B, GABRA1, GABRA2, GABRA3, GABRA4, GABRA5, GABRB2, GABRB3, GABRD, GABRG3, GAP43, GLRB, GRIA1, GRIA2, GRIA3, GRIK5, GRIN2A, GRIN2B, GRM1, GRM5, ITPKA, ITPR1, KCNB1, KCNC2, KCNJ4, KCNMA1, MAP2, MYH10, NRGN, PAK1, PRKAR2B, PRKCG, SLC8A1, GLRA3, KCNAB2, ITGA8, LIN7A, CDK5R1, BSN, NEURL1, DGKI, DLGAP2, DLGAP1, HOMER1, CABP1, AKAP5, GABBR2, ARHGAP32, FRMPD4, LZTS3, BAIAP2, CAP2, ARFGEF2, LZTS1, CNKSR2, CLSTN1, RIMS1, SYNE1, NCS1, MAPK8IP2, NSMF, PCLO, SHANK1, SEPT11, ANKS1B, TENM2, LRFN2, KCTD16, LRRC7, DLGAP3, CACNG8, CLSTN2, LRRTM4, NETO1, PPP1R9B, SHANK3, CADPS2, GRIN3A, GRASP, CNIH2, LRRTM1, LRRTM3, IQSEC3 | 341 | 98 | 6.47 | 7.81e-39 | Up |
| Postsynaptic membrane | CHRM1, CHRM3, DLG3, DLG4, EPHA4, EPHA7, GABRA1, GABRA2, GABRA3, GABRA4, GABRA5, GABRB2, GABRB3, GABRD, GABRG3, GLRB, GRIA1, GRIA2, GRIA3, GRIK5, GRIN2A, GRIN2B, KCNB1, KCNC2, KCNJ4, KCNMA1, GLRA3, LIN7A, NEURL1, DLGAP2, DLGAP1, HOMER1, CABP1, GABBR2, ARHGAP32, LZTS3, LZTS1, CNKSR2, CLSTN1, SYNE1, NCS1, NSMF, SHANK1, ANKS1B, TENM2, LRFN2, KCTD16, LRRC7, DLGAP3, CACNG8, CLSTN2, LRRTM4, NETO1, SHANK3, CADPS2, GRIN3A, GRASP, CNIH2, LRRTM1, LRRTM3, IQSEC3 | 197 | 61 | 6.98 | 1.99e-26 | Up |
| Potassium channel activity | KCNB1, KCNC1, KCNC2, KCND3, KCNF1, KCNH1, KCNJ3, KCNJ4, KCNJ6, KCNJ9, KCNK2, KCNMA1, KCNN1, KCNQ2, KCNQ3, KCNS1, KCNS2, KCNAB1, KCNAB2, KCNAB3, KCNH4, KCNH3, KCNV1, KCNH5, KCNIP2, KCNQ5, KCNT1, KCNK15, KCNIP4, KCNH7, KCNG3, KCNT2, HCN1 | 119 | 33 | 5.93 | 1.53e-13 | Up |
| Presynapse | DLG4, GABRA2, GRIA1, GRIA2, GRIN2B, ICA1, NPY1R, SNCA, STX1A, SYN1, SYN2, SYT1, SYT5, SLC30A3, FZD3, DOC2A, PPFIA4, PPFIA2, PPFIA3, BSN, SYT7, SYNGR1, DGKI, RIMS2, RIMS3, SV2B, DNM1L, RIMS1, UNC13A, DMXL2, ERC2, PCLO, SVOP, SLC17A7, SYT12, TPRG1L, SYNPR, STXBP5, SCAMP5, SLC6A17, UNC13C | 142 | 41 | 6.21 | 5.89e-17 | Up |
| Presynaptic active zone | SYN1, FZD3, PPFIA4, PPFIA2, PPFIA3, BSN, DGKI, RIMS2, RIMS3, RIMS1, UNC13A, ERC2, PCLO, SLC17A7, UNC13C | 24 | 15 | 25 | 7.23e-13 | Up |
| Protein kinase C-activating G-protein coupled receptor signaling pathway | CCK, CHRM1, DGKB, GAP43, GRM1, GRM5, HTR1B, DGKZ, DGKE, DGKI | 32 | 10 | 6.74 | 1.85e-05 | Up |
| Protein lipidation | ABCA1, ZDHHC9, PIGT, HHATL, ZDHHC14, ZDHHC11, MAP6D1, ATG4C, PIGM, ZDHHC20 | 84 | 10 | 3.38 | 0.00152 | Down |
| Regulation of axon guidance | BMPR2, NRP1, SEMA3A, TBR1, FEZF2 | 18 | 5 | 5.68 | 0.00441 | Up |
| Regulation of neuron apoptotic process | CACNA1A, EPHA7, PTK2B, GABRA5, GABRB2, GABRB3, GRIK5, KCNB1, MEF2C, PAK3, PARK2, PIK3CA, PRKCG, CCL2, SNCB, SNCA, STAR, STXBP1, NRP1, CDK5R1, CHL1, PPARGC1A, NSMF, OXR1, FBXW7, AGAP2 | 183 | 26 | 2.47 | 9.7e-05 | Up |
| Regulation of neurotransmitter levels | DAGLA, CACNA1A, CACNA1B, CAMK2A, DRD1, GABRA2, GAD1, GLS, GRIK5, MEF2C, PAK1, PARK2, PDE1B, PFN2, SLC1A1, SLC1A2, SNCA, STX1A, STXBP1, SYN1, SYN2, SYT1, SYT5, DOC2A, PPFIA4, PPFIA2, PPFIA3, CADPS, LIN7A, SYNJ1, SYT7, DGKI, BZRAP1, NRXN1, RIMS2, RIMS3, CPLX1, HRH3, ADGRL1, RAB3GAP1, RIMS1, UNC13A, PCLO, SYTL2, SLC17A7, SYT13, SYT16, SYT12, CADPS2, SNAP47 | 192 | 50 | 5.4 | 3.37e-18 | Up |
| Regulation of postsynaptic membrane potential | DLG4, PTK2B, FGF14, GABRB3, GRIK5, GRIN2A, GRIN2B, MEF2C, PPP3CA, SNCA, STX1A, DGKI, NRXN1, RIMS2, RAB3GAP1, RIMS1, MAPK8IP2, SHANK1, CELF4, SLC17A7, NETO1, SHANK3 | 59 | 22 | 8.92 | 3.58e-12 | Up |
| Regulation of synaptic plasticity | ATP2B2, CAMK2A, CAMK2B, DLG4, DRD1, PTK2B, FGF14, GRIA1, GRIN2A, GRIN2B, GRM5, HRH2, ITPKA, KCNB1, MEF2C, NEUROD2, NRGN, PAK1, PPP3CB, PTGS2, PTN, SNCA, STAR, STXBP1, NR2E1, PPFIA3, SYNGAP1, SYNGR1, NEURL1, DGKI, RAPGEF2, BAIAP2, PLK2, CPEB3, RAB3GAP1, RIMS1, UNC13A, NSMF, NPTN, JPH3, NETO1, JPH4, SHANK3, SNAP47, CNTN4, LRRTM1 | 132 | 46 | 8.2 | 1.48e-22 | Up |
| Regulatory region nucleic acid binding | ARNTL, ETV1, H2AFZ, HIVEP2, MEF2C, NEUROD2, PLAGL1, RARA, SATB1, SNCA, SOX5, STAT4, TBX15, LMO4, ZBTB33, BASP1, TBR1, KLF12, DDN, BCL11A, FEZF2, ARNTL2, PKNOX2, DMRTC1, NEUROD6, BCL11B, ZNF831, ZNF519, ARX, ZNF675, STOX1, SOHLH1, DMRTC1B | 790 | 33 | 0.643 | 0.00634 | Down |
| Release of cytochrome c from mitochondria | CCK, IFI6, HGF, IGF1, PARK2, MAPK9, HRK, DNM1L, MLLT11, GGCT | 55 | 10 | 3.29 | 0.00222 | Up |
| SNARE binding | CACNA1A, STX1A, STXBP1, SYT1, SYT5, DOC2A, NAPG, SYT7, STXBP5L, CPLX1, UNC13A, SYTL2, SYT13, NAPB, SYT16, SYT12, SNAP47, STXBP5 | 112 | 18 | 2.91 | 0.000188 | Up |
| Sodium channel activity | SHROOM2, SCN1A, SCN1B, SCN2A, SCN2B, SCN8A, SCN3B, HCN1 | 36 | 8 | 4.32 | 0.00141 | Up |
| Synapse | ADD2, ATP1A1, ATP2B1, ATP2B2, BMPR2, CACNA1C, CACNB4, CAMK2A, CAMK2B, CAMK2D, CCK, CHRM1, CHRM3, AP1S1, CTNNA2, DLG3, DLG4, DRD1, DMTN, EPHA4, EPHA7, PTK2B, GABRA1, GABRA2, GABRA3, GABRA4, GABRA5, GABRB2, GABRB3, GABRD, GABRG3, GAP43, GLRB, GRIA1, GRIA2, GRIA3, GRIK5, GRIN2A, GRIN2B, GRM1, GRM5, GRM8, ICA1, ITPKA, ITPR1, KCNB1, KCNC2, KCNH1, KCNJ4, KCNMA1, MAP2, MYH10, NPY1R, NRCAM, NRGN, OPRK1, PAK1, PDE2A, PFN2, PRKAR2B, PRKCG, PTPRN2, CCL2, SLC8A1, SNCB, SNCA, STX1A, STXBP1, SYN1, SYN2, SYT1, SYT5, SLC30A3, FZD3, GLRA3, DOC2A, PRSS12, PPFIA4, PPFIA2, KCNAB2, ITGA8, PPFIA3, CADPS, LIN7A, CDK5R1, BSN, WASF1, SYT7, SYNGR1, NEURL1, DGKI, DLGAP2, DLGAP1, NRXN1, HOMER1, CABP1, AKAP5, GABBR2, RAPGEF2, RIMS2, ARHGAP32, FRMPD4, LZTS3, RIMS3, SV2B, DNM1L, OLFM1, BAIAP2, SLC9A6, CAP2, ARFGEF2, CPLX1, LZTS1, AAK1, CPEB3, ADGRL1, CNKSR2, CLSTN1, RIMS1, PDZRN3, UNC13A, NMNAT2, DDN, DMXL2, SYNE1, NCS1, MAPK8IP2, FRRS1L, MYRIP, NSMF, ERC2, CYFIP2, NPTN, PCLO, PACSIN1, SHANK1, NRN1, SVOP, SEPT11, SEPT3, ANKS1B, SLC17A7, TENM2, TBC1D24, LRFN2, KCTD16, LRRC7, DLGAP3, CACNG8, CLSTN2, LRRTM4, NETO1, PPP1R9B, SHANK3, SYT12, CADPS2, PRRT2, GRIN3A, OLFM3, TPRG1L, SYNPR, STXBP5, CBLN4, GRASP, SCAMP5, PHACTR1, CNIH2, LRRTM1, LRRTM3, VWC2, SLC6A17, IQSEC3, UNC13C | 658 | 173 | 6.11 | 1.15e-62 | Up |
| Synapse maturation | CAMK2B, NEUROD2, NEURL1, NRXN1, ADGRL1, SHANK1 | 18 | 6 | 7.39 | 0.000626 | Up |
| Synaptic transmission | ADCY1, ATP2B2, CA7, CACNA1A, CACNA1B, CACNA1C, CACNB1, CACNB2, CACNB4, CAMK4, CAMK2A, CAMK2B, CAMK2D, CHRM1, CHRM3, DLG3, DLG4, DRD1, EGR3, PTK2B, FGF14, GABRA1, GABRA2, GABRA3, GABRA4, GABRA5, GABRB2, GABRB3, GABRD, GABRG3, GAD1, GLRB, GLS, GNAI3, GRIA1, GRIA2, GRIA3, GRIK5, GRIN2A, GRIN2B, GRM1, GRM5, GRM8, HRH2, HTR1B, HTR1E, HTR1F, HTR2A, ITPKA, KCNB1, KCNC1, KCNC2, KCND3, KCNF1, KCNH1, KCNJ3, KCNJ4, KCNJ6, KCNJ9, KCNK2, KCNMA1, KCNN1, KCNQ2, KCNQ3, KCNS1, KCNS2, KIF5A, MEF2C, MYO5A, NEUROD2, NPY5R, OPRK1, OPRM1, PAK1, PARK2, PFN2, PPP3CA, PPP3CB, PRKCB, PRKCE, PRKCG, PTGS2, PTN, RIT2, SCN1B, SCN2B, CCL2, SLC1A1, SLC1A2, SNCB, SNCA, SSTR2, SSTR4, STAR, STX1A, STXBP1, SYN1, SYN2, SYT1, SYT5, NR2E1, VIPR1, KCNAB1, GLRA3, DOC2A, PPFIA4, PPFIA2, KCNAB2, PPFIA3, CADPS, LIN7A, SYNGAP1, SYNJ1, BSN, SYT7, SYNGR1, NEURL1, DGKI, KCNAB3, DLGAP2, DLGAP1, BZRAP1, NRXN1, HOMER1, AKAP5, GABBR2, RAPGEF2, RIMS2, RIMS3, SNAP91, CACNG3, BAIAP2, CSPG5, PLK2, CPLX1, HRH3, CPEB3, ADGRL1, CLSTN1, RAB3GAP1, RIMS1, UNC13A, PLCB1, KCNH4, KCNH3, MAPK8IP2, RASD2, NSMF, SLITRK5, KCNV1, NPTN, KCNH5, PCLO, TMOD2, KCNIP2, SHANK1, SHC3, SYTL2, PCDHB13, KCNQ5, CELF4, SLC17A7, JPH3, SYT13, CACNG8, CLSTN2, NETO1, SYT16, CAMKK1, JPH4, PPP1R9B, SHANK3, KCNH7, SYT12, CADPS2, BTBD9, GRIN3A, SNAP47, CNTN4, KCNG3, CNIH2, LRRTM1, HCN1, UNC13C | 702 | 184 | 6.18 | 1.54e-66 | Up |
| Synaptic transmission, glutamatergic | CACNA1A, CACNB4, DRD1, PTK2B, GRIA1, GRIA2, GRIA3, GRIK5, GRIN2A, GRM1, GRM5, GRM8, HTR1B, HTR2A, MEF2C, PAK1, PARK2, PTGS2, SYT1, DGKI, NRXN1, RAB3GAP1, UNC13A, MAPK8IP2, SHC3, SLC17A7, SHANK3, GRIN3A, CNIH2 | 78 | 29 | 8.94 | 1.42e-15 | Up |
| Synaptic vesicle exocytosis | GRIK5, PFN2, STX1A, STXBP1, SYN1, SYT1, SYT5, DOC2A, CADPS, SYNJ1, SYT7, RIMS3, CPLX1, ADGRL1, RIMS1, UNC13A, PCLO, SYTL2, SYT13, SYT16, SYT12, CADPS2, SNAP47 | 76 | 23 | 6.51 | 1.59e-10 | Up |
| Synaptic vesicle localization | FGF14, GRIK5, PARK2, PFN2, SH3GL2, SNCA, STX1A, STXBP1, SYN1, SYT1, SYT5, AP3B2, DOC2A, CADPS, LIN7A, SYNJ1, SYT7, NRXN1, RIMS3, CPLX1, ADGRL1, RIMS1, UNC13A, PCLO, PACSIN1, SYTL2, SYT13, SYT16, SYT12, CADPS2, BTBD9, SNAP47 | 120 | 32 | 5.49 | 1.97e-12 | Up |
| Synaptic vesicle membrane | ICA1, STX1A, SYN1, SYN2, SYT1, SYT5, SLC30A3, DOC2A, SYT7, SYNGR1, SV2B, DNM1L, DMXL2, SVOP, SLC17A7, SYT12, SYNPR, SCAMP5, SLC6A17 | 55 | 19 | 7.94 | 4.52e-10 | Up |
| Synaptic vesicle priming | STX1A, STXBP1, CADPS, SYNJ1, CADPS2, SNAP47 | 12 | 6 | 14.8 | 4.34e-05 | Up |
| Synaptic vesicle recycling | FGF14, SH3GL2, SNCA, SYT1, SYT5, SYNJ1, PACSIN1, BTBD9 | 29 | 8 | 5.64 | 0.000338 | Up |
| Synaptic vesicle transport | FGF14, GRIK5, PARK2, PFN2, SH3GL2, SNCA, STX1A, STXBP1, SYN1, SYT1, SYT5, AP3B2, DOC2A, CADPS, LIN7A, SYNJ1, SYT7, RIMS3, CPLX1, ADGRL1, RIMS1, UNC13A, PCLO, PACSIN1, SYTL2, SYT13, SYT16, SYT12, CADPS2, BTBD9, SNAP47 | 116 | 31 | 5.51 | 4.11e-12 | Up |
| Syntaxin binding | CACNA1A, STXBP1, SYT1, SYT5, DOC2A, NAPG, SYT7, STXBP5L, CPLX1, UNC13A, SYTL2, SYT13, NAPB, SYT16, SYT12, SNAP47, STXBP5 | 78 | 17 | 4.24 | 4.82e-06 | Up |
| Terminal bouton | CCK, AP1S1, GRIK5, GRIN2A, KCNC2, KCNMA1, PFN2, PTPRN2, SNCA, STXBP1, SYN1, PRSS12, SYT7, SYNGR1, CPLX1, AAK1, TBC1D24 | 61 | 17 | 5.8 | 1.39e-07 | Up |
Up-regulated genes in ALS anterior horn of the spinal cord cluster into inflammatory responses, metal ion regulation and hemostasis; whereas down-regulated genes cluster into neuronal axonal cytoskeleton and apoptosis.
In contrast, clusters of up-regulated genes were involved in neurotransmission, ion channels and ion transport, synapses, maintenance of axons and dendrites, intracellular signaling and synaptic vesicle mechanisms. The majority of down-regulated genes were encoded for proteins associated with myelin and glial cell regulation (Figure 2).
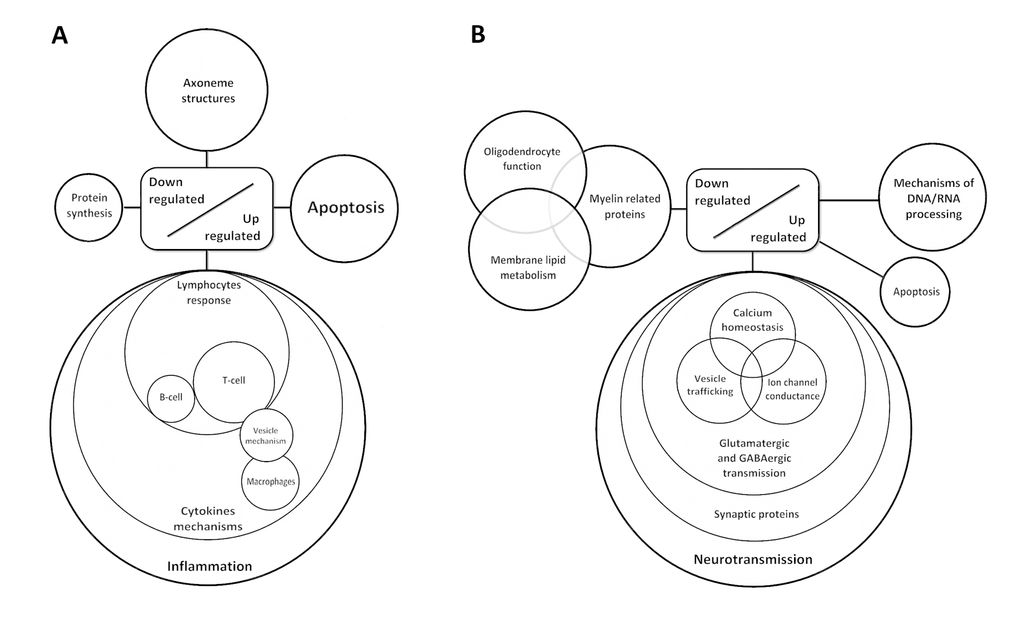
Figure 2. Diagram showing de-regulated gene clusters in the anterior horn of the spinal cord (A) and frontal cortex area 8 in ALS (B) as revealed by whole transcriptome arrays.
RT-qPCR validation
Sixty-six genes from different pathways were selected for validation by RT-qPCR.
Inflammatory gene expression in the anterior horn of the spinal cord
No modifications in the expression levels of glial fibrillary acidic protein gene (GFAP) or prostaglandin-endoperoxide synthase 2 gene (PTGS2) occurred in ALS when compared with controls (p=0.31 and p=0.55, respectively). However, expression levels of AIF1 and CD68 were significantly increased in the anterior horn of the spinal cord in ALS (p=0.044 and p=0.00023, respectively). Gene expression of toll-like receptors (TLRs) TLR2, TLR and TLR7 was significantly increased in the spinal cord in ALS cases (p=2.48E-05, p=0.00011 and p=0.00074, respectively), but TLR4 was not (p=0.669). IL1B was up-regulated (p=0.005), but IL6 and IL6ST were not (p=0.26 and p=0.76, respectively). In contrast, the expression of IL10 and its corresponding receptors IL10RA and IL10RB was increased in ALS (p=0.00046, p=0.022 and p=3.23E-05, respectively). TNFA expression was significantly increased whereas a trend was found for TNFRSF1B (p=0.04 and p=0.08, respectively). The expression of CTSC and CTSS was significantly increased in spinal cord in ALS (p=5.82204E-05 and p=0.00014, respectively). Levels of SLC11A1 were also significantly increased in spinal cord of ALS (p=0.014). HLA-DRB1, a protein coding gene for the Major Histocompatibility Complex Class II (MHC-II) DR β1 protein was markedly up-regulated in ALS (p=0.004365). PDCD1LG2, IFNγ and IL33 were significantly up-regulated in the anterior horn of the spinal cord in ALS (p=0.00153, p=0.03 and p=0.0032, respectively). Finally, IL8 (interleukin 8) and ITGB4 (integrin subunit beta 4) expression was similar in control and ALS cases (p=0.92 and p=0.40, respectively) (Figure 3).
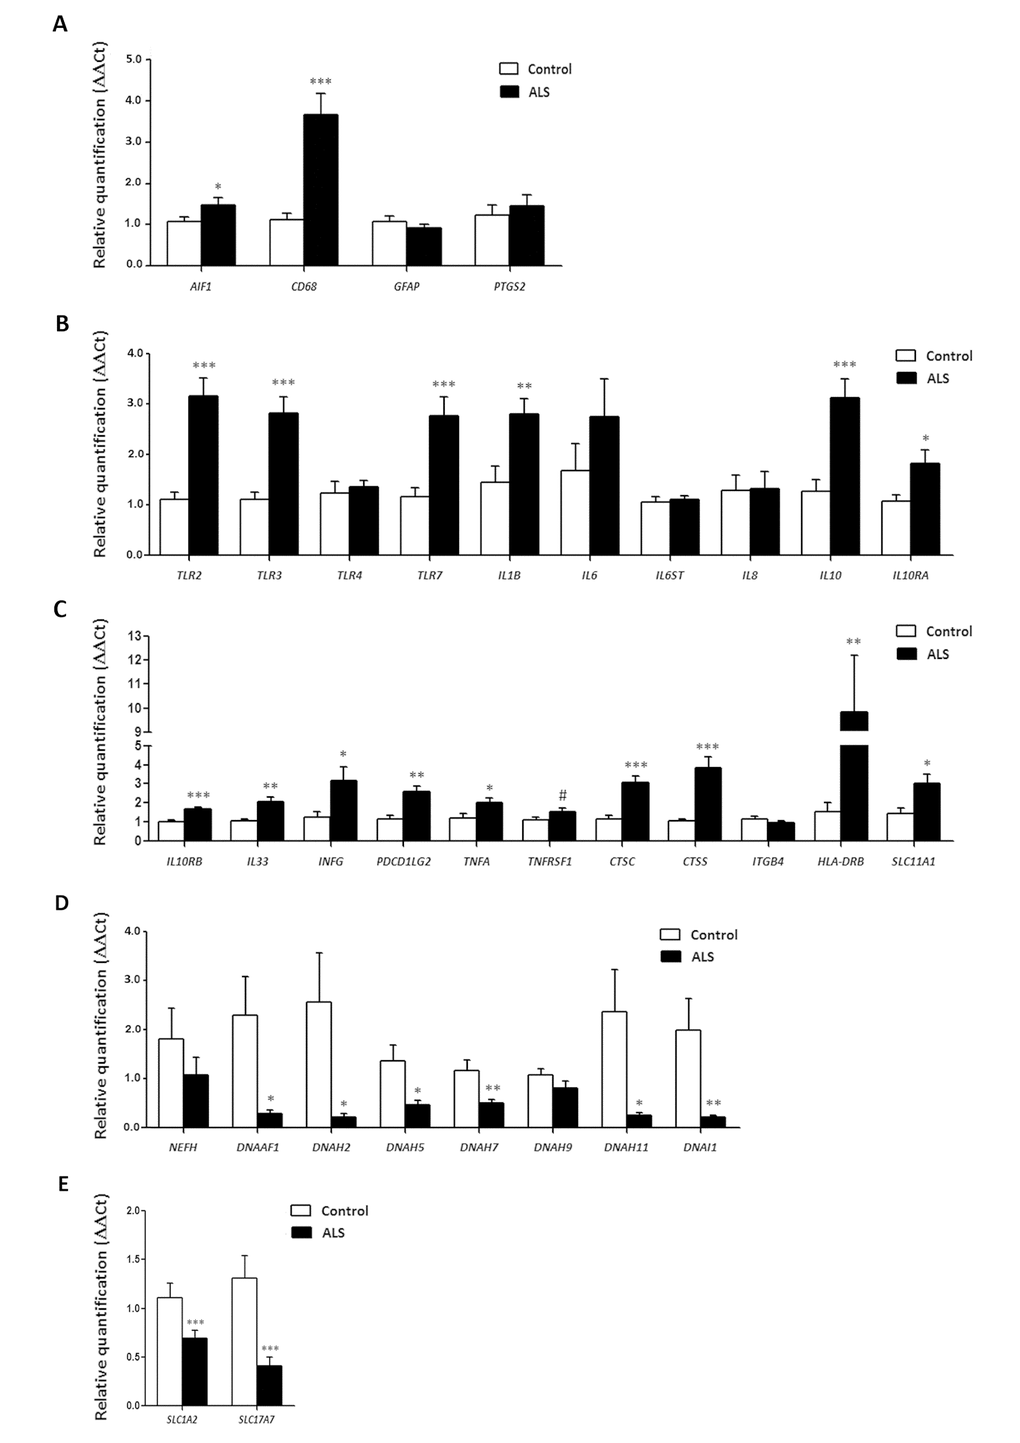
Figure 3. mRNA expression levels of selected deregulated genes identified by microarray analysis in the anterior horn of the spinal cord in ALS determined by TaqMan RT-qPCR assays. (A) general glial markers; (B-C) mediators of the inflammatory response; and (D) axolemal components. Up of AIGF1 and CD68, toll-like receptors, cytokines and receptors, chemokines and other mediators of the innate and adaptative inflammatory responses. Axolemal genes, excepting NEFH, which shows a non-significant trend to decrease, are significantly down-regulated. (E) glutamate transporter coding genes. The significance level is set at * p < 0.05, ** p < 0.01 and *** p < 0.001.
Axonemal gene expression in anterior horn of the spinal cord
No modifications in the expression levels of NEFH, which codes for neurofilament heavy polypeptide protein, was seen in ALS when compared with controls (p=0.30). However, DNAAF1 levels were significantly reduced (p=0.019). Expression of DNAH2, DNAH5, DNAH7 and DNAH11 mRNA was significantly reduced in ALS (p=0.029, p=0.012, p=0.005 and p=0.023, respectively), whereas DNAH9 mRNA was not altered (p=0.14). DNAI1 mRNA expression was also significantly reduced in ALS (p=0.0086) (Figure 3).
SLC1A2 and SC17A7 expression in anterior horn of the spinal cord
SLC1A2 and SLC17A7 expression levels were significantly decreased in the anterior horn of the spinal cord in ALS anterior (p=0.000115 and p=0.000125, respectively). See Figure 3.
Neurotransmission-related gene expression in frontal cortex area 8
GRIA1, which codes for the ionotropic glutamate receptor AMPA 1, and GRIN2A and GRIN2B, coding for NMDA receptors, were significantly up-regulated (p=0.018, p=0.018 and p=0.029, respectively) in frontal cortex in ALS cases. GRM5, which codes for the glutamate metabotropic receptor 5, was also up-regulated (p=0.0079). However, no significant alteration was seen in the expression of NETO1 (p=0.165). Regarding the GABAergic system, GAD1 was up-regulated in ALS (p=0.034). Gene expression of GABA receptors GABRA1, GABRD, GABRB2 was increased (p=0.09, tendency, p=0.006 and p=0.0029, respectively). GABBR2 mRNA levels were also significantly elevated in the frontal cortex in ALS (p=0.01) (Figure 4).
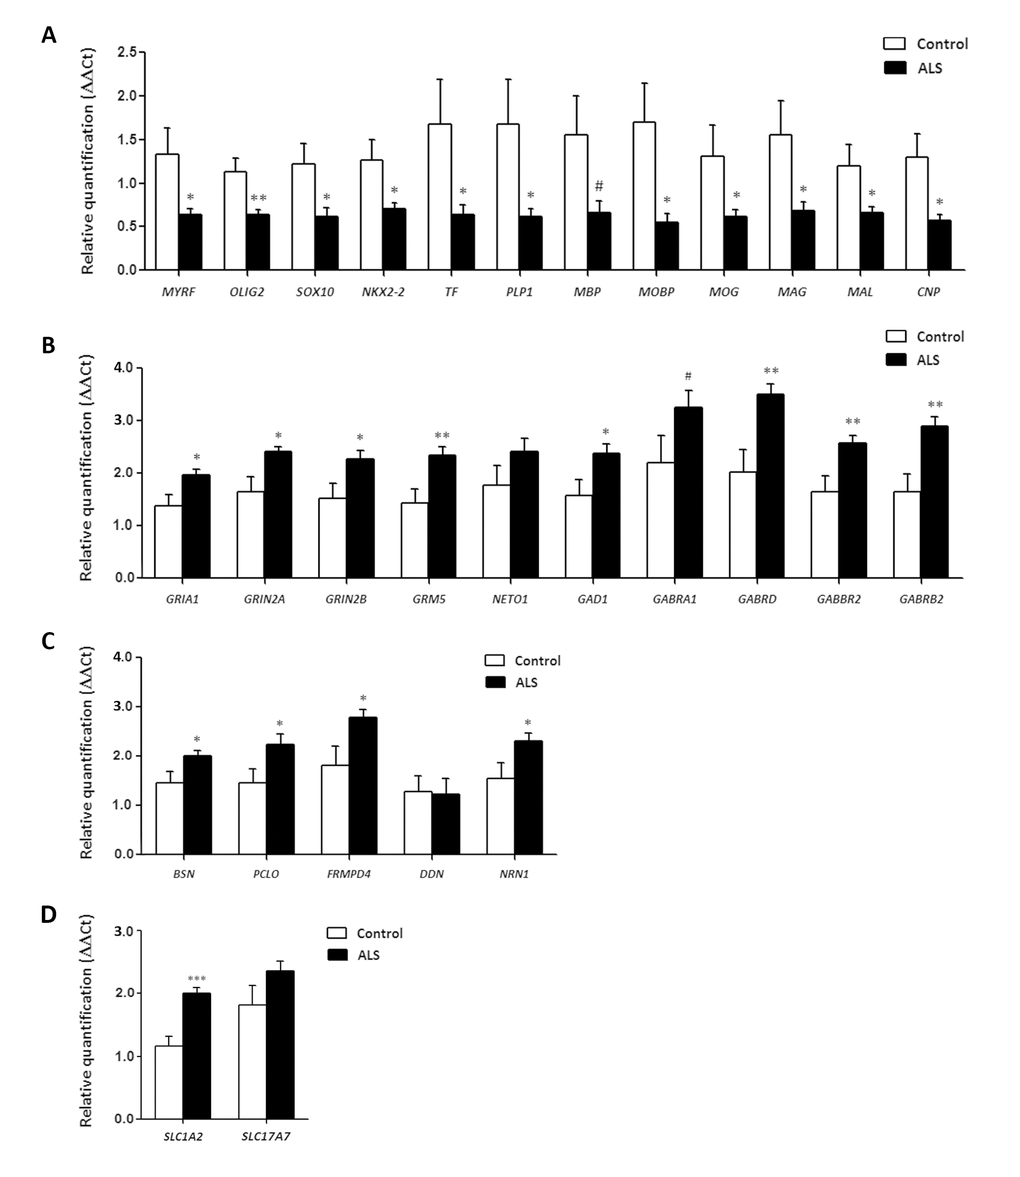
Figure 4. mRNA expression levels of selected deregulated genes identified by microarray analysis in frontal cortex area 8 of ALS cases determined by TaqMan RT-qPCR assays. (A) oligodendroglial and myelin-related genes; (B) glutamatergic and GABAergic-related genes and corresponding ionotropic and metabotropic receptors; (C) genes coding for synaptic cleft proteins. Significant up of genes linked to neurotransmission and synapses, and significant down of genes linked to oligodendroglia and myelination. (D) Glutamate transporter coding genes. The significance level is set at * p < 0.05, ** p < 0.01 and *** p < 0.001, and tendencies at # < 0.1.
Synaptic cleft gene expression in frontal cortex area 8
BSN, which codes for Bassoon, a pre-synaptic cytoskeletal matrix, was up-regulated in ALS (p=0.04). mRNA levels of PCLO, coding gene for Piccolo protein, and FRMPD4 were also increased in ALS (p=0.036 and p=0.029, respectively), Finally, NRN1, which codes for neuritin 1, but not DDN, which codes for dendrin protein, was up-regulated in the frontal cortex in ALS (p=0.04 and p=0.92, respectively) (Figure 4).
SLC1A2 and SLC17A7 expression in frontal cortex area 8
SLC1A2 expression was significantly increased (p=5.25e-5) whereas SLC17A7 mRNA showed a non-significant increase (p=0.42) in frontal cortex area 8 in ALS (Figure 4).
Immunohistochemistry in spinal cord
The anterior horn of the spinal cord in ALS cases showed decreased number of neurons and altered morphology of most remaining motor neurons including loss of endoplasmic reticulum (chromatolysis) and axonal ballooning (Figure 5a) and intracytoplasmic TDP-43-immunoreactive inclusions (Figure 5b). Immunohistochemistry was carried out in the lumbar spinal cord in control and sALS cases (Figure 5a and b). VDAC was reduced in a subpopulation of neurons in the anterior horn in ALS, but not in neurons of the Clarke’s column and posterior horn, when compared with controls (Figure 5c and d). Increased expression of GFAP was found in reactive astrocytes in the lateral columns and anterior horn of the spinal cord in ALS cases (Figure 5e and f). Marked differences were seen regarding microglial cell markers: IBA-1 and CD68 immunoreactivity was dramatically increased in the pyramidal tracts and anterior horn in ALS; moreover the morphology of microglia was modified in pathological cases with predominance of round, amoeboid microglia (Figure 5g-j). Similar immunoreactivity, distribution and morphology were found in reactive microglia using antibodies against HLA-DRB1 and HLA-DRB5 (Figure 5k-n). In contrast IL-10 and TNF-α immunoreactivity predominated in neurons; immunoreactivity was increased in neurons in ALS cases compared with controls (Figure 5o-r). Finally, GluT (SLC1A2), the transporter of glutamate from the extracellular space at synapses, was expressed in the membrane of neurons and in the neuropil; SLC1A2 immunoreactivity was decreased in neurons and neuropil of the anterior horn in ALS (Figure 5s, t).
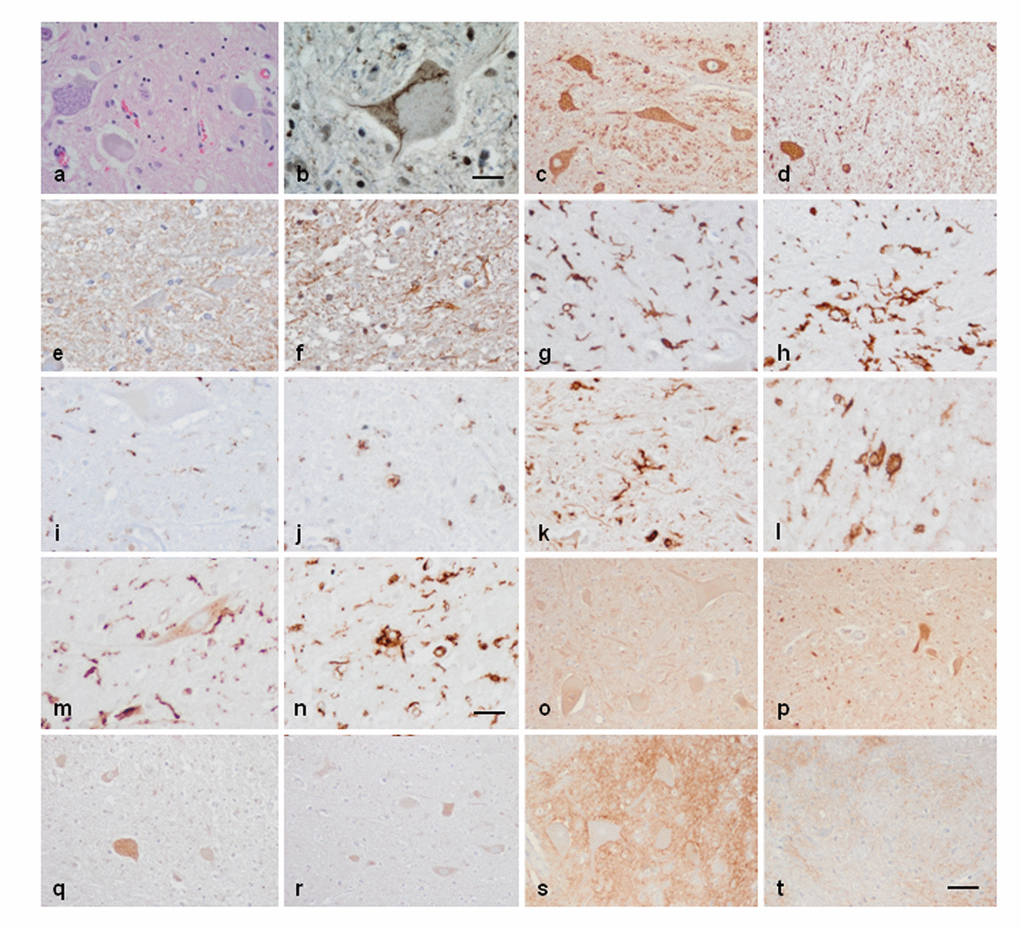
Figure 5. Anterior horn of the spinal cord. Haematoxilin and eosin staining showing damaged neurons in ALS (a). Immunohistochemistry to TDP-43 showing skein-like intracytoplasmic inclusions (b), VDAC (c, d), GFAP (e, f), IBA-1 (g, h), CD68 (i, j), HLA-DRB1 (k, l), HLA-DRB5 (m, n), IL-10 (o, p), TNF-α (q, r) and GluT (SLC1A2) (s, t) in the anterior horn of the lumbar spinal cord in control (c, e, g, I, k, m, o, q, s) and sALS (a, b, d, f, h, j, l, n, p, r, t) cases. TDP-43-immunoreactive cytoplasmic inclusions are seen in motor neurons in sALS. GFAP is increased in reactive astrocytes; microglial cells have a round, amoeboid morphology as seen with IBA-1, CD-68, HLA-DRB1, and HLA-DRB5 antibodies. VDAC immunoreactivity is decreased whereas IL-10 and TNF-α is increased in remaining motor neurons in sALS. SLC1A2 immunoreactivity is reduced in the membrane of neurons and in neuropil of the anterior horn in sALS. Paraffin sections, slightly counterstained with haematoxylin; a, c-d, o-t, bar in t = 40μm; e-n, bar in = 20μm; bar in b = 10μm.
Gel electrophoresis and western blotting in frontal cortex area 8
A few tested antibodies were eventually suitable for western blotting studies. No differences in the expression levels of glutamate receptor ionotropic, NMDA 2A (NMDAR2A) and glutamate decarboxylase 1 (GAD1) were observed between control and ALS cases. However, a significant increase in α-amino-3-hydroxy-5-methyl-4-isoxazolepropionic acid receptor 1 (AMPAR GluR-1) ** p < 0.01 and a tendency to increase in the expression of gamma-aminobutyric acid receptor subunit beta-2 (GABAAB2) (# p < 0.1) was found in the frontal cortex in ALS when compared to controls (Figure 6).
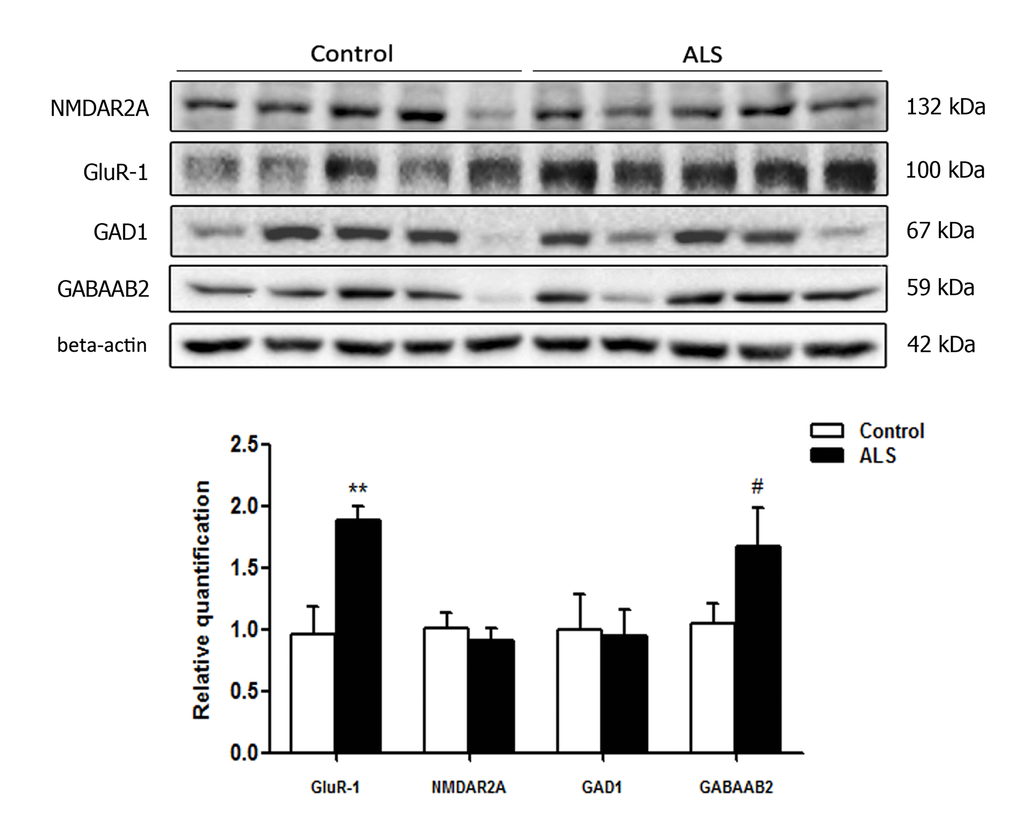
Figure 6. Gel electrophoresis and western blotting to glutamate receptor ionotropic, NMDA 2A (NMDAR2A), α-amino-3-hydroxy-5-methyl-4-isoxazolepropionic acid receptor 1 (GluR-1), glutamate decarboxylase 1 (GAD1) and gamma-aminobutyric acid receptor subunit beta-2 (GABAAB2) in the frontal cortex area 8 of control and ALS. Significant increased levels of GluR-1 and a tendency to increased levels of GABAAB2 are seen in ALS when compared with controls. The significance level is set at ** p < 0.01 and tendencies at # < 0.1.
Discussion
Transcriptomic profiles in ALS are region-dependent when comparing the anterior horn of the lumbar spinal cord and frontal cortex area 8 in the same individuals. As an important regional difference related to excitotoxicity, the expression of glutamate transporters is markedly different in the anterior horn of the spinal cord and the frontal cortex area 8. SLC1A2 and SLC17A7 mRNA expression is significantly decreased in the anterior horn of the spinal cord, whereas SLC1A2 is significantly increased in frontal cortex area 8. SLC1A2 encodes the solute carrier family 1 member 2 or excitatory amino-acid transporter 2 (EAAT2) which clears glutamate from the extracellular space at synapses in the central nervous system. Immunohistochemistry has shown decreased SLC1A2 protein expression in the membrane of neurons and neuropil of the anterior horn in ALS. SLC17A7 encodes the vesicular glutamate transporter 1 (VGLUT1) which is a vesicle-bound, sodium-dependent phosphate glutamate transporter expressed in the synaptic vesicles. Decreased expression of these proteins is linked to increased excitotoxity which is postulated as primary factor triggering motor neuron degeneration in ALS [30,31].
Whole transcriptome arrays show that major up-regulated clusters in the anterior horn are related with innate inflammatory and adaptative inflammatory responses. Genes involved in hemostasis and ion transport forms a small up-regulated group. The major group of down-regulated genes is linked to the neuronal cytoskeleton. The majority of significantly differentially up-regulated transcripts in sALS in frontal cortex area 8, as revealed by whole transcriptome arrays, code for proteins linked with neurotransmission, ion channels and ion transport, synapses, and axon and dendrite maintenance, whereas down-regulated genes code for proteins involved in oligodendrocyte development and function, myelin regulation and membrane lipid metabolism.
Altered gene expression as revealed by whole transcriptome arrays has been validated by RT-qPCR in 58 of 66 assessed genes. These observations increase the list of genes which are de-regulated in the anterior spinal cord and provide, for the first time, robust evidence of gene de-regulation in frontal cortex area 8 in sALS. Increased inflammatory response in the anterior horn and increased expression of selected neurotransmitter markers in frontal cortex has been further assessed using immunohistochemistry and western blotting, respectively.
Inflammation in the anterior horn of the spinal cord
AIF1 gene codes for the Allograft Inflammatory Factor 1, a protein induced by cytokines and interferon which promotes macrophage and glial activation [32,33]. CD68 codes for the macrophage antigen CD68 glycoprotein which is expressed by microglial cells [35–37], the principal resident immune cell population in brain [38,39]. Microglia pro-inflammatory state activation can be initiated by engagement of germline-encoded pattern-recognition receptors such as Toll-like receptors (TLRs) which are expressed in glial cells [40]. TLR activation, in turn, activates phagocytosis [41–43] and pro-inflammatory responses [44]. Up-regulated interleukins in ALS are IL1B, the coding gene for interleukin 1B an important mediator of the inflammatory response [45], interleukin 10 (encoded by IL10) which has pleiotropic effects down-regulating the expression of Th1 cytokines, MHC class II antigens and co-stimulating the production of several molecules by macrophages through the activation of IL10 receptor subunit α and subunit β (encoded by IL10RA and IL10RB, respectively) [46]. However, IL6 mRNA, which encodes a specific pro-inflammatory cytokine with regenerative and anti-inflammatory activities in particular settings [47–50] is not modified. Tumor Necrosis Factor Receptor Superfamily Member 1A (encoded by TNFA) is involved in the regulation of a wide spectrum of biological processes including cell proliferation, cell differentiation, apoptosis, lipid metabolism and coagulation [50,51]. CTSC gene encodes Cathepsin C which is central coordinator of activation of many serine proteinases in immune cells [52]. CTSS codes for a protein of the same family, Cathepsin S, which acts as a key protease responsible for the removal of the invariant chain from MHC class II antigens [53]. SLC11A1 encodes natural resistance-associated macrophage protein 1, which acts as a host resistance to certain pathogens [54].
Major Histocompatibility Complex Class II (MHC-II) DR β1 protein, encoded by HLA-DRB-1, plays a central role in the immune system by presenting peptides derived from extracellular proteins [55,56] and participate in the activation of autophagosomes [57].
PDCD1LG2 codes for Programmed Cell Death 1 Ligand 2, a protein involved in co-stimulatory signals essential for T-cell proliferation and IFN-γ production [58]. IFNγ gene, which codes for the cytokine interferon-γ, is key player in antigen-specific immune responses [59]. Finally, interleukin 33, encoded by IL33, acts as a chemo-attractant for Th2 cells and functions as an ‘alarm’ that amplifies immune responses during tissue injury [60].
Increased inflammatory response in the anterior horn of the spinal cord has been further documented by immunohistochemistry showing increased expression of IBA-1, the protein encoded by AIF1, CD68, and HLA-DRB1 and HLA-DRB5 in reactive microglia. Reactive microglia has a round, amoeboid morphology and is also localized, as expected in the lateral and anterior pyramidal tracts. IL-10 and TNF-α are mainly localized in neurons of the spinal cord, and its expression is increased in remaining motor neurons of the spinal cord in ALS. These findings indicate a parallelism between gene expression and protein expression regarding inflammatory responses of assessed molecules. On the other hand the different localization of microglial markers, and IL-10 and TNF-α in neurons points to a cross-talk between microglia and neurons in the anterior horn of the spinal cord in ALS.
This is in contrast with other markers as glial fibrillary acidic protein and voltage dependent anion channel in which levels of mRNA differ from levels (or intensity) of protein expression. No modifications in the expression of GFAP mRNA are observed in the present study, but GFAP immunoreactivity is clearly increased in reactive astrocytes, as already reported in classical neuropathological studies. VDAC mRNA is not abnormally regulated in gene arrays; yet VDAC is decreased in motor neurons, but not in neurons of the Clarke’s column and neurons of the posterior horn, of the spinal cord in ALS. VDAC immunohistochemistry is in line with observations in human sALS showing deficiencies in mitochondria and energy metabolism [61,62].
Reduced expression of axolemal genes in anterior horn of the spinal cord
The expression levels of NEFH, which codes for neurofilament heavy polypeptide protein [63], are preserved in ALS. However, DNAAF1, which encodes dynein (axonemal) assembly factor 1, and mRNAs encoding several dynein axonemal heavy chains (DHC) are down-regulated thus suggesting impairment of motor ATPases involved in the transport of various cellular cargoes by ‘walking’ along cytoskeletal microtubules towards the minus-end of the microtubule [64–66].
Myelin and oligodendrocyte genes in frontal cortex area 8
Myelin transcription factor (encoded by MYRF) regulates oligodendrocyte differentiation and is required for central nervous system myelination [78–81]. The basic loop- helix protein OLIG2 mediates motor neuron and oligodendrocyte differentiation [22,82]. High mobility group protein SOX10 modulates myelin protein transcription [83,84]. NKX2.2 homeodomain transcription factor is a key regulator of oligodendrocyte differentiation [85]. Transferrin encoded by TF participates in the early stages of myelination [86,87]. Proteolipid protein 1 (encoded by PLP1) plays a role in the compaction, stabilization, and maintenance of myelin sheaths, as well as in oligodendrocyte development and axonal survival [88,89]. Myelin basic protein (encoded by MBP) is the second most abundant myelin-associated protein, constituting about 30% of total myelin protein [90]. Myelin-associated oligodendrocyte basic protein (encoded by MOBP) constitutes the third most abundant protein in CNS myelin and it acts by compacting and stabilizing myelin sheaths [91]. Myelin oligodendrocyte glycoprotein (encoded by MOG) is a cell surface marker of oligodendrocyte maturation [92]. Myelin associated glycoprotein (encoded by MAG) is a type I membrane protein and member of the immunoglobulin super-family involved in the process of myelination and certain myelin-neuron cell-cell interactions [93]. Mal T-cell differentiation protein (encoded by MAL) is involved in myelin biogenesis [94]. Finally, 2',3'-cyclic nucleotide 3' phosphodiesterase (encoded by CNP1) participates in early oligodendrocyte differentiation and myelination [95–97].
Concluding comments
Results of the present study validate gene expression of individual studies performed in a limited number of samples identifying a limited number of de-regulated genes in the anterior horn of the spinal cord [17,20,21,25]. Present results are more close to those carried out by using laser micro-dissection of anterior horn spinal motor neurons [27] thus reinforcing the consistence of observations in both studies. Whether some changes are related to the variable progression of the disease need further study with a larger number of cases of rapid or slow clinical course. In this line, altered mitochondria, protein degradation and axonal transport predominate in the 129Sv-SOD1(G93A) transgenic mouse with rapidly progressive motor neuron disease, whereas increased immune response is found in the C57-SOD1(G93A) transgenic mouse with more benign course [98].
The most important aspect of the present study is the description of altered gene expression and identification of altered clusters of genes in the frontal cortex area 8 in sALS cases without apparent cognitive impairment. It is worth stressing that altered clusters differ in the spinal cord and frontal cortex in sALS at terminal stages thus providing valuable information of molecular abnormalities which can also be present within the spectrum of FTLD-TDP. Noteworthy, altered regulation of transcription related to synapses and neurotransmission covering neurotransmitter receptors, synaptic proteins and ion channels in the frontal cortex in the absence of overt clinical symptoms of cognitive impairment are particularly important to identify early molecular alterations in frontal cortex with the spectrum of ALS/FTLD-TDP.
Materials and Methods
Tissue collection
Post-mortem fresh-frozen lumbar spinal cord (SC) and frontal cortex (FC) (Brodmann area 8) tissue samples were from the Institute of Neuropathology HUB-ICO-IDIBELL Biobank following the guidelines of Spanish legislation on this matter and the approval of the local ethics committee. The post-mortem interval between death and tissue processing was between 2 and 17 hours. One hemisphere was immediately cut in coronal sections, 1-cm thick, and selected areas of the encephalon were rapidly dissected, frozen on metal plates over dry ice, placed in individual air-tight plastic bags, numbered with water-resistant ink and stored at -80°C until use for biochemical studies. The other hemisphere was fixed by immersion in 4% buffered formalin for 3 weeks for morphologic studies. Transversal sections of the spinal cord were alternatively frozen at -80°C or fixed by immersion in 4% buffered formalin. The whole series included 18 sALS cases and 23 controls. The anterior horn of the spinal cord was examined in 14 sALS (mean age 57 years; 6 men and 8 women) and the frontal cortex area 8 in 15 sALS (mean age 54 years; 11 men and 4 women). Spinal cord and frontal cortex were available in 11 cases. Lumbar anterior spinal cord was dissected on a dry-ice frozen plate under a binocular microscope at a magnification x4. TDP-43-immunoreactive small dystrophic neurites and/or TDP-43-positive granules and/or small cytoplasmic globules in cortical neurons in the contralateral frontal cortex area 8 were observed in 11 of 18 cases, but only abundant in three cases (cases 29, 30 and 31 in Table 3). Spongiosis in the upper cortical layers was found only in one case (case 28 in Table 3). Cases with frontotemporal dementia were not included in the present series. Patients with associated pathology including Alzheimer’s disease (excepting neurofibrillary tangle pathology stages I-II of Braak and Braak), Parkinson's disease, tauopathies, vascular diseases, neoplastic diseases affecting the nervous system, metabolic syndrome, hypoxia and prolonged axonal states such as those occurring in intensive care units were excluded. Cases with infectious, inflammatory and autoimmune diseases, either systemic or limited to the nervous system were not included. Age-matched control cases had not suffered from neurologic or psychiatric diseases, and did not have abnormalities in the neuropathologic examination, excepting sporadic neurofibrillary tangle pathology stages I-II of Braak and Braak. No C9ORF72, SOD1, TARDBP and FUS mutations occurred in any case. Table 3 shows a summary of cases.
Table 3. Summary of the fifty six cases analyzed including frontal cortex area 8 of 14 controls and 15 ALS cases, and anterior horn of the spinal cord of 13 controls and 14 ALS cases.
| RIN value | |||||||||||||||||||||||||||||||||||||||||||||||||||||||||||||||||||||||||||||||||||||||||||||||||||
| Case | Age | Gender | Diagnosis | PM delay | Initial symptoms | SC | FC | ||||||||||||||||||||||||||||||||||||||||||||||||||||||||||||||||||||||||||||||||||||||||||||
| 1 | 49 | F | Control | 07 h 00 min | - | - | 7.2 | ||||||||||||||||||||||||||||||||||||||||||||||||||||||||||||||||||||||||||||||||||||||||||||
| 2 | 75 | F | Control | 03 h 00 min | - | - | 7.2 | ||||||||||||||||||||||||||||||||||||||||||||||||||||||||||||||||||||||||||||||||||||||||||||
| 3 | 55 | M | Control | 05 h 40 min | - | - | 7.7 | ||||||||||||||||||||||||||||||||||||||||||||||||||||||||||||||||||||||||||||||||||||||||||||
| 4 | 59 | M | Control | 12 h 05 min | - | 6.4 | - | ||||||||||||||||||||||||||||||||||||||||||||||||||||||||||||||||||||||||||||||||||||||||||||
| 5 | 59 | M | Control | 07 h 05 min | - | - | 7.8 | ||||||||||||||||||||||||||||||||||||||||||||||||||||||||||||||||||||||||||||||||||||||||||||
| 6 | 43 | M | Control | 05 h 55 min | - | 6.6 | 7.7 | ||||||||||||||||||||||||||||||||||||||||||||||||||||||||||||||||||||||||||||||||||||||||||||
| 7 | 53 | M | Control | 07 h 25 min | - | - | 5.3 | ||||||||||||||||||||||||||||||||||||||||||||||||||||||||||||||||||||||||||||||||||||||||||||
| 8 | 56 | M | Control | 03 h 50 min | - | - | 7.6 | ||||||||||||||||||||||||||||||||||||||||||||||||||||||||||||||||||||||||||||||||||||||||||||
| 9 | 47 | M | Control | 04 h 55 min | - | 5.6 | 7.7 | ||||||||||||||||||||||||||||||||||||||||||||||||||||||||||||||||||||||||||||||||||||||||||||
| 10 | 64 | F | Control | 11 h 20 min | - | 6.2 | - | ||||||||||||||||||||||||||||||||||||||||||||||||||||||||||||||||||||||||||||||||||||||||||||
| 11 | 46 | M | Control | 15 h 00 min | - | 5.9 | 7.9 | ||||||||||||||||||||||||||||||||||||||||||||||||||||||||||||||||||||||||||||||||||||||||||||
| 12 | 56 | M | Control | 07 h 10 min | - | 6.1 | - | ||||||||||||||||||||||||||||||||||||||||||||||||||||||||||||||||||||||||||||||||||||||||||||
| 13 | 71 | F | Control | 08 h 30 min | - | 5.9 | - | ||||||||||||||||||||||||||||||||||||||||||||||||||||||||||||||||||||||||||||||||||||||||||||
| 14 | 64 | F | Control | 05 h 00 min | - | 7.0 | - | ||||||||||||||||||||||||||||||||||||||||||||||||||||||||||||||||||||||||||||||||||||||||||||
| 15 | 79 | F | Control | 06 h 25 min | - | 6.7 | - | ||||||||||||||||||||||||||||||||||||||||||||||||||||||||||||||||||||||||||||||||||||||||||||
| 16 | 75 | M | Control | 07 h 30 min | - | 5.0 | - | ||||||||||||||||||||||||||||||||||||||||||||||||||||||||||||||||||||||||||||||||||||||||||||
| 17 | 55 | M | Control | 09 h 45 min | - | 5.3 | - | ||||||||||||||||||||||||||||||||||||||||||||||||||||||||||||||||||||||||||||||||||||||||||||
| 18 | 52 | M | Control | 03 h 00 min | - | - | 8.3 | ||||||||||||||||||||||||||||||||||||||||||||||||||||||||||||||||||||||||||||||||||||||||||||
| 19 | 52 | M | Control | 04 h 40 min | - | - | 6.3 | ||||||||||||||||||||||||||||||||||||||||||||||||||||||||||||||||||||||||||||||||||||||||||||
| 20 | 76 | M | Control | 06 h 30 min | - | 6.6 | - | ||||||||||||||||||||||||||||||||||||||||||||||||||||||||||||||||||||||||||||||||||||||||||||
| 21 | 60 | F | Control | 11 h 30 min | - | - | 7.5 | ||||||||||||||||||||||||||||||||||||||||||||||||||||||||||||||||||||||||||||||||||||||||||||
| 22 | 51 | F | Control | 04 h 00 min | - | 6.3 | 7.9 | ||||||||||||||||||||||||||||||||||||||||||||||||||||||||||||||||||||||||||||||||||||||||||||
| 23 | 54 | M | Control | 08 h 45 min | - | - | 7.0 | ||||||||||||||||||||||||||||||||||||||||||||||||||||||||||||||||||||||||||||||||||||||||||||
| 24 | 56 | M | ALS | 10 h 50 min | NA | 7.1 | - | ||||||||||||||||||||||||||||||||||||||||||||||||||||||||||||||||||||||||||||||||||||||||||||
| 25 | 70 | M | ALS | 03 h 00 min | Respiratory | 7.3 | 7.0 | ||||||||||||||||||||||||||||||||||||||||||||||||||||||||||||||||||||||||||||||||||||||||||||
| 26 | 77 | M | ALS | 04 h 30 min | NA | 7.4 | - | ||||||||||||||||||||||||||||||||||||||||||||||||||||||||||||||||||||||||||||||||||||||||||||
| 27 | 56 | F | ALS | 03 h 45 min | NA | 8.2 | 7.7 | ||||||||||||||||||||||||||||||||||||||||||||||||||||||||||||||||||||||||||||||||||||||||||||
| 28 | 59 | M | ALS | 03 h 15 min | NA | 7.5 | 7.7 | ||||||||||||||||||||||||||||||||||||||||||||||||||||||||||||||||||||||||||||||||||||||||||||
| 29 | 63 | F | ALS | 13 h 50 min | Bulbar | 6.8 | 8.2 | ||||||||||||||||||||||||||||||||||||||||||||||||||||||||||||||||||||||||||||||||||||||||||||
| 30 | 59 | F | ALS | 14 h 15 min | NA | 6.4 | 6.7 | ||||||||||||||||||||||||||||||||||||||||||||||||||||||||||||||||||||||||||||||||||||||||||||
| 31 | 54 | M | ALS | 04 h 50 min | Spinal | - | 7.8 | ||||||||||||||||||||||||||||||||||||||||||||||||||||||||||||||||||||||||||||||||||||||||||||
| 32 | 76 | M | ALS | 12 h 40 min | Spinal | - | 7.4 | ||||||||||||||||||||||||||||||||||||||||||||||||||||||||||||||||||||||||||||||||||||||||||||
| 33 | 64 | M | ALS | 16 h 30 min | NA | 6.3 | 7.3 | ||||||||||||||||||||||||||||||||||||||||||||||||||||||||||||||||||||||||||||||||||||||||||||
| 34 | 57 | F | ALS | 04 h 00 min | Bulbar | 6.2 | 8.6 | ||||||||||||||||||||||||||||||||||||||||||||||||||||||||||||||||||||||||||||||||||||||||||||
| 35 | 75 | F | ALS | 04 h 05 min | Bulbar | 6.8 | 6.8 | ||||||||||||||||||||||||||||||||||||||||||||||||||||||||||||||||||||||||||||||||||||||||||||
| 36 | 79 | F | ALS | 02 h 10 min | NA | 7.0 | - | ||||||||||||||||||||||||||||||||||||||||||||||||||||||||||||||||||||||||||||||||||||||||||||
| 37 | 57 | F | ALS | 10 h 00 min | Bulbar | 6.5 | 7.1 | ||||||||||||||||||||||||||||||||||||||||||||||||||||||||||||||||||||||||||||||||||||||||||||
| 38 | 50 | M | ALS | 10 h 10 min | Spinal | - | 5.9 | ||||||||||||||||||||||||||||||||||||||||||||||||||||||||||||||||||||||||||||||||||||||||||||
| 39 | 59 | F | ALS | 02 h 30 min | Spinal | - | 7.5 | ||||||||||||||||||||||||||||||||||||||||||||||||||||||||||||||||||||||||||||||||||||||||||||
| 40 | 46 | M | ALS | 07 h 00 min | Spinal | 7.0 | 8.0 | ||||||||||||||||||||||||||||||||||||||||||||||||||||||||||||||||||||||||||||||||||||||||||||
| 41 | 69 | F | ALS | 17 h 00 min | Spinal | 6.4 | 6.3 | ||||||||||||||||||||||||||||||||||||||||||||||||||||||||||||||||||||||||||||||||||||||||||||
| Abbreviations: ALS: amyotrophic lateral sclerosis; F: female; M: male; PM: post-mortem delay (hours, minutes); SC: anterior horn of the spinal cord lumbar level; FC: frontal cortex area 8; RIN: RNA integrity number; NA: not available. | |||||||||||||||||||||||||||||||||||||||||||||||||||||||||||||||||||||||||||||||||||||||||||||||||||
Whole-transcriptome array
RNA from frozen anterior horn of the lumbar spinal cord and frontal cortex area 8 was extracted following the instructions of the supplier (RNeasy Mini Kit, Qiagen® GmbH, Hilden, Germany). RNA integrity and 28S/18S ratios were determined with the Agilent Bioanalyzer (Agilent Technologies Inc, Santa Clara, CA, USA) to assess RNA quality, and the RNA concentration was evaluated using a NanoDrop™ Spectrophotometer (Thermo Fisher Scientific). Selected samples were analyzed by microarray hybridization with GeneChip® Human Gene 2.0 ST Array and WT Labeling Kit and microarray 7000G platform from Affymetrix® (Santa Clara, CA, USA). Microarray service was carried out at the High Technology Unit (UAT) at Vall d’Hebron Research Institute (VHIR), Barcelona, Spain.
Microarray data and statistical analysis
Microarray data quality control, normalization and filtering were performed using bioconductor packages in an R programming environment for genes [99] which enabled data preprocessing for differential gene expression analysis and enrichment analysis. Gene selection was based upon their values using a test for differential expression between two classes (Student’s t-test). Genes differentially expressed showed an absolute fold change > 2.0 in combination with a p-value ≤ 0.05.
RT-qPCR validation
Complementary DNA (cDNA) preparation used High-Capacity cDNA Reverse Transcription kit (Applied Biosystems, Foster City, CA, USA) following the protocol provided by the supplier. Parallel reactions for each RNA sample run in the absence of MultiScribe Reverse Transcriptase to assess the lack of contamination of genomic DNA. TaqMan RT-qPCR assays were performed in duplicate for each gene on cDNA samples in 384-well optical plates using an ABI Prism 7900 Sequence Detection system (Applied Biosystems, Life Technologies, Waltham, MA, USA). For each 10μL TaqMan reaction, 4.5μL cDNA was mixed with 0.5μL 20x TaqMan Gene Expression Assays and 5μL of 2x TaqMan Universal PCR Master Mix (Applied Biosystems). Table 4 shows identification numbers and names of TaqMan probes. The mean value of one house-keeping gene, hypoxanthine-guanine phosphoribosyltransferase (HPRT1), was used as internal control for normalization of spinal cord samples, whereas the mean values of the three house-keeping genes, alanyl-transfer RNA synthase (AARS), glucuronidase Beta (GUS-β) and X-prolyl aminopeptidase (aminopeptidase P) 1 (XPNPEP1) were used as internal controls for normalization of frontal cortex samples [100,101]. The parameters of the reactions were 50°C for 2 min, 95°C for 10 min, and 40 cycles of 95°C for 15 sec and 60°C for 1 min. Finally, capture of all TaqMan PCR data used the Sequence Detection Software (SDS version 2.2.2, Applied Biosystems). The double-delta cycle threshold (ΔΔCT) method was used to analyze the data; results with T-student test. The significance level was set at * p < 0.05, ** p < 0.01 and *** p < 0.001, and tendencies at # < 0.1. Pearson’s correlation method assessed a possible linear association between TDP-43 pathology in frontal cortex area 8 and gene deregulation in the same region; significant correlations were not found.
Table 4. Genes, gene symbols and TaqMan probes used for the study of gene expression in the anterior horn of the spinal cord and frontal cortex area 8 in ALS cases and controls including probes for normalization (AARS, GUS-β, HPRT-1 and XPNPEP-1).
| Gene | Gene symbol | Reference |
| 2',3'-Cyclic Nucleotide 3' Phosphodiesterase | CNP | Hs00263981_m1 |
| Alanyl-TRNA Synthetase | AARS | Hs00609836_m1 |
| Allograft Inflammatory Factor 1 | AIF1 | Hs00741549_g1 |
| Bassoon Presynaptic Cytomatrix Protein | BSN | Hs01109152_m1 |
| Cathepsin C | CTSC | Hs00175188_m1 |
| Cathepsin S | CTSS | Hs00356423_m1 |
| C-X-C Motif Chemokine Ligand 8 | IL8 | Hs00174103_m1 |
| Dendrin | DDN | Hs00391784_m1 |
| Dynein (Axonemal) Assembly Factor 1 | DNAAF1 | Hs00698399_m1 |
| Dynein Axonemal Heavy Chain 11 | DNAH11 | Hs00361951_m1 |
| Dynein Axonemal Heavy Chain 2 | DNAH2 | Hs00325838_m1 |
| Dynein Axonemal Heavy Chain 5 | DNAH5 | Hs00292485_m1 |
| Dynein Axonemal Heavy Chain 7 | DNAH7 | Hs00324265_m1 |
| Dynein Axonemal Heavy Chain 9 | DNAH9 | Hs00242096_m1 |
| Dynein Axonemal Intermediate Chain 1 | DNAI1 | Hs00201755_m1 |
| Gamma-Aminobutyric Acid Type A Receptor Alpha 1 Subunit | GABRA1 | Hs00971228_m1 |
| Gamma-Aminobutyric Acid Type A Receptor Beta 2 Subunit | GABRB2 | Hs00241451_m1 |
| Gamma-Aminobutyric Acid Type A Receptor Delta Subunit | GABRD | Hs00181309_m1 |
| Gamma-Aminobutyric Acid Type B Receptor Subunit 2 | GABBR2 | Hs01554996_m1 |
| Glial Fibrillary Acidic Protein | GFAP | Hs00909240_m1 |
| Glutamate Decarboxylase 1 | GAD1 | Hs01065893_m1 |
| Glutamate Ionotropic Receptor AMPA Type Subunit 1 | GRIA1 | Hs00181348_m1 |
| Glutamate Ionotropic Receptor NMDA Type Subunit 2A | GRIN2A | Hs00168219_m1 |
| Glutamate Ionotropic Receptor NMDA Type Subunit 2B | GRIN2B | Hs01002012_m1 |
| Glutamate Metabotropic Receptor 5 | GRM5 | Hs00168275_m1 |
| Hypoxanthine Phosphoribosyltransferase 1 | HPRT1 | Hs02800695_m1 |
| Integrin Subunit Beta 4 | ITGB4 | Hs00173995_m1 |
| Interferon, Gamma | IFNG | Hs00989291_m1 |
| Interleukin 1 Beta | IL1B | Hs01555410_m1 |
| Interleukin 10 | IL10 | Hs00961622_m1 |
| Interleukin 10 Receptor Subunit Alpha | IL10RA | Hs00155485_m1 |
| Interleukin 10 Receptor Subunit Beta | IL10RB | Hs00988697_m1 |
| Interleukin 33 | IL33 | Hs00369211_m1 |
| Interleukin 6 | IL6 | Hs00985639_m1 |
| Interleukin 6 Signal Transducer | IL6ST | Hs00174360_m1 |
| Macrophage Antigen CD68 | CD68 | Hs02836816_g1 |
| Major Histocompatibility Complex, Class II, DR Beta 1/4/5 | HLA-DRB | Hs04192463_mH |
| Mal T-Cell Differentiation Protein | MAL | Hs00360838_m1 |
| Myelin Associated Glycoprotein | MAG | Hs01114387_m1 |
| Myelin Basic Protein | MBP | Hs00921945_m1 |
| Myelin Oligodendrocyte Glycoprotein | MOG | Hs01555268_m1 |
| Myelin Regulatory Factor | MYRF | Hs00973739_m1 |
| Myelin-Associated Oligodendrocyte Basic Protein | MOBP | Hs01094434_m1 |
| Neuritin 1 | NRN1 | Hs00213192_m1 |
| Neurofilament, Heavy Polypeptide | NEFH | Hs00606024_m1 |
| Neuropilin And Tolloid Like 1 | NETO1 | Hs00371151_m1 |
| NK2 Homeobox 2 | NKX2-2 | Hs00159616_m1 |
| Oligodendrocyte Lineage Transcription Factor 2 | OLIG2 | Hs00377820_m1 |
| Piccolo Presynaptic Cytomatrix Protein | PCLO | Hs00382694_m1 |
| Programmed Cell Death 1 Ligand 2 | PDCD1LG2 | Hs01057777_m1 |
| Prostaglandin-Endoperoxide Synthase 2 | PTGS2 | Hs00153133_m1 |
| Proteolipid Protein 1 | PLP1 | Hs00166914_m1 |
| PSD-95-Interacting Regulator Of Spine Morphogenesis | FRMPD4 | Hs01568794_m1 |
| Solute Carrier Family 1 (Glial High Affinity Glutamate Transporter), Member 2 (EAAT-2) | SLC1A2 | Hs01102423_m1 |
| Solute Carrier Family 11 Member 1 | SLC11A1 | Hs01105516_m1 |
| Solute Carrier Family 17 (Vesicular Glutamate Transporter), Member 7 (VGLUT-1) | SLC17A7 | Hs00220404_m1 |
| SRY (Sex Determining Region Y)-Box 10 | SOX10 | Hs00366918_m1 |
| Toll Like Receptor 2 | TLR2 | Hs00610101_m1 |
| Toll Like Receptor 3 | TLR3 | Hs01551078_m1 |
| Toll Like Receptor 4 | TLR4 | Hs01060206_m1 |
| Toll Like Receptor 7 | TLR7 | Hs00152971_m1 |
| Transferrin | TF | Hs01067777_m1 |
| Tumor Necrosis Factor Receptor Superfamily Member 1A | TNFRSF1 | Hs01042313_m1 |
| Tumor Necrosis Factor-Alpha | TNFa | Hs01113624_g1 |
| X-prolyl aminopepidase P1 | XPNPEP1 | Hs00958026_m1 |
| β-glucuronidase | GUS-β | Hs00939627_m1 |
Immunohistochemistry
De-waxed sections, 4μm thick, of the lumbar spinal cord from control and ALS cases were processed in parallel for immunohistochemistry. Endogenous peroxidases were blocked by incubation in 10% methanol-1% H2O2 for 15 min followed by 3% normal horse serum. Then the sections were incubated at 4ºC overnight with one of the primary antibodies: rabbit polyclonal antibodies to IBA-1 (019-19749, Wako Chemicals Gmbh, Neuss, GE) were used at a dilution of 1:1,000; VDAC (voltage dependent anion channel, ab15895, Abcam, Cambridge, UK) at 1:100; HLA-DRB1 (GTX104919, GeneTex, Barcelona, Spain) at 1:100; HLA-DRB5 (NBP2, Novusbio, Littleton, Colorado, USA) at 1:100; IL-10 (AP52181PU, ACRIS, ProAlt, Madrid, Spain) at 1:100; and GFAP (glial fibrillary acidic protein, RP014-S, Diagnostic Biosystem, Palex Medica, Sant Cugat, Spain) at 1:400. Mouse monoclonal antibodies to CD68 (ab955, Abcam, Cambridge, UK) and TNF-α (ab1793, Abcam, Cambridge, UK), were used at dilutions of 1:200 and 1:150, respectively. Antibodies to GluT: SLC1A2 (ab1783, Millipore, Billerica, MA, USA) were used at a dilution of 1:100. Following incubation with the primary antibody, the sections were incubated with EnVision + system peroxidase (Dako, Agilent, Santa Clara, CA, USA) for 30 min at room temperature. The peroxidase reaction was visualized with diaminobenzidine and H2O2. Control of the immunostaining included omission of the primary antibody; no signal was obtained following incubation with only the secondary antibody. Sections were slightly stained with haematoxylin.
Gel electrophoresis and western blotting
Frozen samples of the somatosensory cortex were homogenized in RIPA lysis buffer composed of 50mM Tris/HCl buffer, pH 7.4 containing 2mM EDTA, 0.2% Nonidet P-40, 1mM PMSF, protease and phosphatase inhibitor cocktail (Roche Molecular Systems, USA). The homogenates were centrifuged for 20 min at 12,000 rpm. Protein concentration was determined with the BCA method (Thermo Scientific). Equal amounts of protein (20μg) for each sample were loaded and separated by electrophoresis on 10% sodium dodecyl sulfate polyacrylamide gel electrophoresis (SDS-PAGE) gels and transferred onto nitrocellulose membranes (Amersham, Freiburg, GE). Non-specific bindings were blocked by incubation in 3% albumin in PBS containing 0.2% Tween for 1 h at room temperature. After washing, membranes were incubated overnight at 4°C with antibodies against glutamate receptor ionotropic, NMDA 2A (NMDAR2A, 130 kDa, rabbit, 1:200, Abcam, Cambridge, UK), α-amino-3-hydroxy-5-methyl-4-isoxazolepropionic acid receptor 1 (AMPAR GluR-1, 100 kDa, rabbit, 1:200, Cell Signaling Technology, Danvers, MA, USA), glutamate decarboxylase 1 (GAD1, 67 kDa, rabbit, 1:200, Cell Signaling Technology, Danvers, MA, USA) and gamma-aminobutyric acid receptor subunit beta-2 (GABAAB2, 59 kDa, mouse, 1:1000, Abcam, Cambridge, UK). Protein loading was monitored using an antibody against β-actin (42 kDa, 1:30,000, Sigma). Membranes were incubated for 1 h with appropriate HRP-conjugated secondary antibodies (1:2,000, Dako); the immunoreaction was revealed with a chemiluminescence reagent (ECL, Amersham). Densitometric quantification was carried out with the ImageLab v4.5.2 software (BioRad), using β-actin for normalization. Seven samples of FC area 8 per group were analyzed. These antibodies were selected on the basis of a larger screening which included antibodies against proteins whose RNA levels were de-regulated as revealed by RT-qPCR. Only antibodies working for western blotting were eventually assessed. The significance level was set at ** p < 0.01 and tendencies at # < 0.1
Author Contributions
PA-B carried out gene expression studies and validation of gene expression; JM prepared the samples for morphological and biochemical studies; EA helped in the bioinformatics analysis; MP was in charge of the clinical studies; IF designed and supervised the study and wrote the advanced version of the manuscript which was then circulated among the contributors. All the authors agree with the final version of the manuscript.
Acknowledgements
We wish to thank the High Technology Unit (HTU) and Statistics and Bioinformatics Unit (SBU) of the Vall d’Hebron Research Institute (VHIR) (Barcelona, Spain), and particularly Ricardo Gonzalo and Ferran Briansó for the array procedure and data processing, respectively, and T. Yohannan for editorial help.
Conflicts of Interest
The authors declare no conflict of interest.
Funding
This study was supported by grants from CIBERNED and Instituto de Salud Carlos III, and co-funded by FEDER funds/European Regional Development Fund (ERDF) – a way to build Europe PIE14/00034 and PI14/00757, and intra-CIBERNED project to IF, and IFI15/00035 fellowship to PA-B.
References
- 1. Horobágyi T, Cairns NJ. Amyotrophic lateral sclerosis and frontotemporal lobar degeneration. In: Kovacs GG (ed) Neuropathology of neurodegenerative diseases: a practical guide. Cambridge Press, Cambridge, 2015; pp 209-248.
- 2. Strong MJ, Hortobágyi T, Okamoto K, Kato S. Amyotrophic lateral sclerosis, primary lateral sclerosis, and spinal muscular atrophy. In: Dickson DW (ed) Neurodegeneration: the molecular pathology of dementia and movement disorders, 2 ed. Wiley-Blackwell, Oxford, 2011; pp: 418-433.
- 3. Boillée S, Vande Velde C, Cleveland DW. ALS: a disease of motor neurons and their nonneuronal neighbors. Neuron. 2006; 52:39–59. https://doi.org/10.1016/j.neuron.2006.09.018 [PubMed]
- 4. Calvo A, Moglia C, Balma M, Chiò A. Involvement of immune response in the pathogenesis of amyotrophic lateral sclerosis: a therapeutic opportunity? CNS Neurol Disord Drug Targets. 2010; 9:325–30. https://doi.org/10.2174/187152710791292657 [PubMed]
- 5. D’Amico E, Factor-Litvak P, Santella RM, Mitsumoto H. Clinical perspective on oxidative stress in sporadic amyotrophic lateral sclerosis. Free Radic Biol Med. 2013; 65:509–27. https://doi.org/10.1016/j.freeradbiomed.2013.06.029 [PubMed]
- 6. Evans MC, Couch Y, Sibson N, Turner MR. Inflammation and neurovascular changes in amyotrophic lateral sclerosis. Mol Cell Neurosci. 2013; 53:34–41. https://doi.org/10.1016/j.mcn.2012.10.008 [PubMed]
- 7. Hooten KG, Beers DR, Zhao W, Appel SH. Protective and toxic neuroinflammation in amyotrophic lateral sclerosis. Neurotherapeutics. 2015; 12:364–75. https://doi.org/10.1007/s13311-014-0329-3 [PubMed]
- 8. King AE, Woodhouse A, Kirkcaldie MT, Vickers JC. Excitotoxicity in ALS: Overstimulation, or overreaction? Exp Neurol. 2016; 275:162–71. https://doi.org/10.1016/j.expneurol.2015.09.019 [PubMed]
- 9. Lin CL, Bristol LA, Jin L, Dykes-Hoberg M, Crawford T, Clawson L, Rothstein JD. Aberrant RNA processing in a neurodegenerative disease: the cause for absent EAAT2, a glutamate transporter, in amyotrophic lateral sclerosis. Neuron. 1998; 20:589–602. https://doi.org/10.1016/S0896-6273(00)80997-6 [PubMed]
- 10. Maragakis NJ, Rothstein JD. Glutamate transporters in neurologic disease. Arch Neurol. 2001; 58:365–70. https://doi.org/10.1001/archneur.58.3.365 [PubMed]
- 11. Peters OM, Ghasemi M, Brown RH
Jr . Emerging mechanisms of molecular pathology in ALS. J Clin Invest. 2015; 125:1767–79. https://doi.org/10.1172/JCI71601 [PubMed] - 12. Philips T, Robberecht W. Neuroinflammation in amyotrophic lateral sclerosis: role of glial activation in motor neuron disease. Lancet Neurol. 2011; 10:253–63. https://doi.org/10.1016/S1474-4422(11)70015-1 [PubMed]
- 13. Philips T, Rothstein JD. Glial cells in amyotrophic lateral sclerosis. Exp Neurol. 2014; 262:111–20. https://doi.org/10.1016/j.expneurol.2014.05.015 [PubMed]
- 14. Rossi S, Cozzolino M, Carrì MT. Old versus new mechanisms in the pathogenesis of ALS. Brain Pathol. 2016; 26:276–86. https://doi.org/10.1111/bpa.12355 [PubMed]
- 15. Strong MJ, Leystra-Lantz C, Ge WW. Intermediate filament steady-state mRNA levels in amyotrophic lateral sclerosis. Biochem Biophys Res Commun. 2004; 316:317–22. https://doi.org/10.1016/j.bbrc.2004.02.051 [PubMed]
- 16. Taylor JP, Brown RH
Jr , Cleveland DW. Decoding ALS: from genes to mechanism. Nature. 2016; 539:197–206. https://doi.org/10.1038/nature20413 [PubMed] - 17. Dangond F, Hwang D, Camelo S, Pasinelli P, Frosch MP, Stephanopoulos G, Stephanopoulos G, Brown RH
Jr , Gullans SR. Molecular signature of late-stage human ALS revealed by expression profiling of postmortem spinal cord gray matter. Physiol Genomics. 2004; 16:229–39. https://doi.org/10.1152/physiolgenomics.00087.2001 [PubMed] - 18. Heath PR, Kirby J, Shaw PJ. Investigating cell death mechanisms in amyotrophic lateral sclerosis using transcriptomics. Front Cell Neurosci. 2013; 7:259. https://doi.org/10.3389/fncel.2013.00259 [PubMed]
- 19. Henriques A, Gonzalez De Aguilar JL. Can transcriptomics cut the gordian knot of amyotrophic lateral sclerosis? Curr Genomics. 2011; 12:506–15. https://doi.org/10.2174/138920211797904043 [PubMed]
- 20. Ishigaki S, Niwa J, Ando Y, Yoshihara T, Sawada K, Doyu M, Yamamoto M, Kato K, Yotsumoto Y, Sobue G. Differentially expressed genes in sporadic amyotrophic lateral sclerosis spinal cords--screening by molecular indexing and subsequent cDNA microarray analysis. FEBS Lett. 2002; 531:354–58. https://doi.org/10.1016/S0014-5793(02)03546-9 [PubMed]
- 21. Malaspina A, Kaushik N, de Belleroche J. Differential expression of 14 genes in amyotrophic lateral sclerosis spinal cord detected using gridded cDNA arrays. J Neurochem. 2001; 77:132–45. https://doi.org/10.1046/j.1471-4159.2001.t01-1-00231.x [PubMed]
- 22. Lederer CW, Torrisi A, Pantelidou M, Santama N, Cavallaro S. Pathways and genes differentially expressed in the motor cortex of patients with sporadic amyotrophic lateral sclerosis. BMC Genomics. 2007; 8:26. https://doi.org/10.1186/1471-2164-8-26 [PubMed]
- 23. Li H, de Faria JP, Andrew P, Nitarska J, Richardson WD. Phosphorylation regulates OLIG2 cofactor choice and the motor neuron-oligodendrocyte fate switch. Neuron. 2011; 69:918–29. https://doi.org/10.1016/j.neuron.2011.01.030 [PubMed]
- 24. Wang XS, Simmons Z, Liu W, Boyer PJ, Connor JR. Differential expression of genes in amyotrophic lateral sclerosis revealed by profiling the post mortem cortex. Amyotroph Lateral Scler. 2006; 7:201–10. https://doi.org/10.1080/17482960600947689 [PubMed]
- 25. Offen D, Barhum Y, Melamed E, Embacher N, Schindler C, Ransmayr G. Spinal cord mRNA profile in patients with ALS: comparison with transgenic mice expressing the human SOD-1 mutant. J Mol Neurosci. 2009; 38:85–93. https://doi.org/10.1007/s12031-007-9004-z [PubMed]
- 26. Woodruff RH, Tekki-Kessaris N, Stiles CD, Rowitch DH, Richardson WD. Oligodendrocyte development in the spinal cord and telencephalon: common themes and new perspectives. Int J Dev Neurosci. 2001; 19:379–85. https://doi.org/10.1016/S0736-5748(00)00083-6 [PubMed]
- 27. Jiang YM, Yamamoto M, Kobayashi Y, Yoshihara T, Liang Y, Terao S, Takeuchi H, Ishigaki S, Katsuno M, Adachi H, Niwa J, Tanaka F, Doyu M, et al. Gene expression profile of spinal motor neurons in sporadic amyotrophic lateral sclerosis. Ann Neurol. 2005; 57:236–51. https://doi.org/10.1002/ana.20379 [PubMed]
- 28. Cox LE, Ferraiuolo L, Goodall EF, Heath PR, Higginbottom A, Mortiboys H, Hollinger HC, Hartley JA, Brockington A, Burness CE, Morrison KE, Wharton SB, Grierson AJ, et al. Mutations in CHMP2B in lower motor neuron predominant amyotrophic lateral sclerosis (ALS). PLoS One. 2010; 5:e9872. https://doi.org/10.1371/journal.pone.0009872 [PubMed]
- 29. Kirby J, Halligan E, Baptista MJ, Allen S, Heath PR, Holden H, Barber SC, Loynes CA, Wood-Allum CA, Lunec J, Shaw PJ. Mutant SOD1 alters the motor neuronal transcriptome: implications for familial ALS. Brain. 2005; 128:1686–706. https://doi.org/10.1093/brain/awh503 [PubMed]
- 30. Rothstein JD. Excitotoxic mechanisms in the pathogenesis of amyotrophic lateral sclerosis. Adv Neurol. 1995; 68:7–20. [PubMed]
- 31. Rothstein JD. Current hypotheses for the underlying biology of amyotrophic lateral sclerosis. Ann Neurol. 2009 (Suppl 1); 65:S3–9. https://doi.org/10.1002/ana.21543 [PubMed]
- 32. Chen X, Kelemen SE, Autieri MV. AIF-1 expression modulates proliferation of human vascular smooth muscle cells by autocrine expression of G-CSF. Arterioscler Thromb Vasc Biol. 2004; 24:1217–22. https://doi.org/10.1161/01.ATV.0000130024.50058.de [PubMed]
- 33. Kelemen SE, Autieri MV. Expression of allograft inflammatory factor-1 in T lymphocytes: a role in T-lymphocyte activation and proliferative arteriopathies. Am J Pathol. 2005; 167:619–26. https://doi.org/10.1016/S0002-9440(10)63003-9 [PubMed]
- 34. Schulze JO, Quedenau C, Roske Y, Adam T, Schüler H, Behlke J, Turnbull AP, Sievert V, Scheich C, Mueller U, Heinemann U, Büssow K. Structural and functional characterization of human Iba proteins. FEBS J. 2008; 275:4627–40. https://doi.org/10.1111/j.1742-4658.2008.06605.x [PubMed]
- 35. Beranek JT. CD68 is not a macrophage-specific antigen. Ann Rheum Dis. 2005; 64:342–43. [PubMed]
- 36. Gottfried E, Kunz-Schughart LA, Weber A, Rehli M, Peuker A, Müller A, Kastenberger M, Brockhoff G, Andreesen R, Kreutz M. Expression of CD68 in non-myeloid cell types. Scand J Immunol. 2008; 67:453–63. https://doi.org/10.1111/j.1365-3083.2008.02091.x [PubMed]
- 37. Holness CL, Simmons DL. Molecular cloning of CD68, a human macrophage marker related to lysosomal glycoproteins. Blood. 1993; 81:1607–13. [PubMed]
- 38. Colton C, Wilcock DM. Assessing activation states in microglia. CNS Neurol Disord Drug Targets. 2010; 9:174–91. https://doi.org/10.2174/187152710791012053 [PubMed]
- 39. Heneka MT, Kummer MP, Latz E. Innate immune activation in neurodegenerative disease. Nat Rev Immunol. 2014; 14:463–77. https://doi.org/10.1038/nri3705 [PubMed]
- 40. Arroyo DS, Soria JA, Gaviglio EA, Rodriguez-Galan MC, Iribarren P. Toll-like receptors are key players in neurodegeneration. Int Immunopharmacol. 2011; 11:1415–21. https://doi.org/10.1016/j.intimp.2011.05.006 [PubMed]
- 41. Chen K, Iribarren P, Hu J, Chen J, Gong W, Cho EH, Lockett S, Dunlop NM, Wang JM. Activation of Toll-like receptor 2 on microglia promotes cell uptake of Alzheimer disease-associated amyloid β peptide. J Biol Chem. 2006; 281:3651–59. https://doi.org/10.1074/jbc.M508125200 [PubMed]
- 42. Iribarren P, Zhou Y, Hu J, Le Y, Wang JM. Role of formyl peptide receptor-like 1 (FPRL1/FPR2) in mononuclear phagocyte responses in Alzheimer disease. Immunol Res. 2005; 31:165–76. https://doi.org/10.1385/IR:31:3:165 [PubMed]
- 43. Tahara K, Kim HD, Jin JJ, Maxwell JA, Li L, Fukuchi K. Role of toll-like receptor signalling in Abeta uptake and clearance. Brain. 2006; 129:3006–19. https://doi.org/10.1093/brain/awl249 [PubMed]
- 44. Facci L, Barbierato M, Marinelli C, Argentini C, Skaper SD, Giusti P. Toll-like receptors 2, -3 and -4 prime microglia but not astrocytes across central nervous system regions for ATP-dependent interleukin-1β release. Sci Rep. 2014; 4:6824. https://doi.org/10.1038/srep06824 [PubMed]
- 45. Lane T, Lachmann HJ. The emerging role of interleukin-1β in autoinflammatory diseases. Curr Allergy Asthma Rep. 2011; 11:361–68. https://doi.org/10.1007/s11882-011-0207-6 [PubMed]
- 46. Pestka S, Krause CD, Sarkar D, Walter MR, Shi Y, Fisher PB. Interleukin-10 and related cytokines and receptors. Annu Rev Immunol. 2004; 22:929–79. https://doi.org/10.1146/annurev.immunol.22.012703.104622 [PubMed]
- 47. Schellera J, Chalarisb A, Schmidt-Arrasb D, Rose-Johnb S. The pro- and anti-inflammatory properties of the cytokine interleukin-6. Biochim Biophys Acta - Mol. Cell Res. 2011; 1813:878–88. https://doi.org/10.1016/j.bbamcr.2011.01.034 [PubMed]
- 48. Simpson RJ, Hammacher A, Smith DK, Matthews JM, Ward LD. Interleukin-6: structure-function relationships. Protein Sci. 1997; 6:929–55. https://doi.org/10.1002/pro.5560060501 [PubMed]
- 49. Pal M, Febbraio MA, Whitham M. From cytokine to myokine: the emerging role of interleukin-6 in metabolic regulation. Immunol Cell Biol. 2014; 92:331–39. https://doi.org/10.1038/icb.2014.16 [PubMed]
- 50. Locksley RM, Killeen N, Lenardo MJ. The TNF and TNF receptor superfamilies: integrating mammalian biology. Cell. 2001; 104:487–501. https://doi.org/10.1016/S0092-8674(01)00237-9 [PubMed]
- 51. Olszewski MB, Groot AJ, Dastych J, Knol EF. TNF trafficking to human mast cell granules: mature chain-dependent endocytosis. J Immunol. 2007; 178:5701–09. https://doi.org/10.4049/jimmunol.178.9.5701 [PubMed]
- 52. McGuire MJ, Lipsky PE, Thiele DL. Purification and characterization of dipeptidyl peptidase I from human spleen. Arch Biochem Biophys. 1992; 295:280–88. https://doi.org/10.1016/0003-9861(92)90519-3 [PubMed]
- 53. Small DM, Burden RE, Scott CJ. The emerging relevance of the cysteine protease cathepsin S in disease. Clin Rev Bone Miner Metab. 2011; 9:122–32. https://doi.org/10.1007/s12018-011-9095-5
- 54. Archer NS, Nassif NT, O’Brien BA. Genetic variants of SLC11A1 are associated with both autoimmune and infectious diseases: systematic review and meta-analysis. Genes Immun. 2015; 16:275–83. https://doi.org/10.1038/gene.2015.8 [PubMed]
- 55. Villadangos JA. Presentation of antigens by MHC class II molecules: getting the most out of them. Mol Immunol. 2001; 38:329–46. https://doi.org/10.1016/S0161-5890(01)00069-4 [PubMed]
- 56. Hahn M, Nicholson MJ, Pyrdol J, Wucherpfennig KW. Unconventional topology of self peptide-major histocompatibility complex binding by a human autoimmune T cell receptor. Nat Immunol. 2005; 6:490–96. https://doi.org/10.1038/ni1187 [PubMed]
- 57. Menéndez-Benito V, Neefjes J. Autophagy in MHC class II presentation: sampling from within. Immunity. 2007; 26:1–3. https://doi.org/10.1016/j.immuni.2007.01.005 [PubMed]
- 58. Saunders PA, Hendrycks VR, Lidinsky WA, Woods ML. PD-L2:PD-1 involvement in T cell proliferation, cytokine production, and integrin-mediated adhesion. Eur J Immunol. 2005; 35:3561–69. https://doi.org/10.1002/eji.200526347 [PubMed]
- 59. Schoenborn JR, Wilson CB. Regulation of interferon-gamma during innate and adaptive immune responses. Adv Immunol. 2007; 96:41–101. https://doi.org/10.1016/S0065-2776(07)96002-2 [PubMed]
- 60. Miller AM. Role of IL-33 in inflammation and disease. J Inflamm (Lond). 2011; 8:22. https://doi.org/10.1186/1476-9255-8-22 [PubMed]
- 61. Ruffoli R, Bartalucci A, Frati A, Fornai F. Ultrastructural studies of ALS mitochondria connect altered function and permeability with defects of mitophagy and mitochondriogenesis. Front Cell Neurosci. 2015; 9:341. https://doi.org/10.3389/fncel.2015.00341 [PubMed]
- 62. Carrì MT, D’Ambrosi N, Cozzolino M. Pathways to mitochondrial dysfunction in ALS pathogenesis. Biochem Biophys Res Commun. 2016. [PubMed]
- 63. Figlewicz DA, Krizus A, Martinoli MG, Meininger V, Dib M, Rouleau GA, Julien JP. Variants of the heavy neurofilament subunit are associated with the development of amyotrophic lateral sclerosis. Hum Mol Genet. 1994; 3:1757–61. https://doi.org/10.1093/hmg/3.10.1757 [PubMed]
- 64. Asai DJ, Brokaw CJ. Dynein heavy chain isoforms and axonemal motility. Trends Cell Biol. 1993; 3:398–402. https://doi.org/10.1016/0962-8924(93)90090-N [PubMed]
- 65. Chapelin C, Duriez B, Magnino F, Goossens M, Escudier E, Amselem S. Isolation of several human axonemal dynein heavy chain genes: genomic structure of the catalytic site, phylogenetic analysis and chromosomal assignment. FEBS Lett. 1997; 412:325–30. https://doi.org/10.1016/S0014-5793(97)00800-4 [PubMed]
- 66. McKenney RJ, Huynh W, Tanenbaum ME, Bhabha G, Vale RD. Activation of cytoplasmic dynein motility by dynactin-cargo adapter complexes. Science. 2014; 345:337–41. https://doi.org/10.1126/science.1254198 [PubMed]
- 67. Giorda R, Peakman M, Tan KC, Vergani D, Trucco M. Glutamic acid decarboxylase expression in islets and brain. Lancet. 1991; 338:1469–70. https://doi.org/10.1016/0140-6736(91)92781-V [PubMed]
- 68. Kaufman DL, McGinnis JF, Krieger NR, Tobin AJ. Brain glutamate decarboxylase cloned in lambda gt-11: fusion protein produces gamma-aminobutyric acid. Science. 1986; 232:1138–40. https://doi.org/10.1126/science.3518061 [PubMed]
- 69. Burmakina S, Geng Y, Chen Y, Fan QR. Heterodimeric coiled-coil interactions of human GABAB receptor. Proc Natl Acad Sci USA. 2014; 111:6958–63. https://doi.org/10.1073/pnas.1400081111 [PubMed]
- 70. Hallermann S, Fejtova A, Schmidt H, Weyhersmüller A, Silver RA, Gundelfinger ED, Eilers J. Bassoon speeds vesicle reloading at a central excitatory synapse. Neuron. 2010; 68:710–23. https://doi.org/10.1016/j.neuron.2010.10.026 [PubMed]
- 71. Davydova D, Marini C, King C, Klueva J, Bischof F, Romorini S, Montenegro-Venegas C, Heine M, Schneider R, Schröder MS, Altrock WD, Henneberger C, Rusakov DA, et al. Bassoon specifically controls presynaptic P/Q-type Ca(2+) channels via RIM-binding protein. Neuron. 2014; 82:181–94. https://doi.org/10.1016/j.neuron.2014.02.012 [PubMed]
- 72. Fenster SD, Garner CC. Gene structure and genetic localization of the PCLO gene encoding the presynaptic active zone protein Piccolo. Int J Dev Neurosci. 2002; 20:161–71. https://doi.org/10.1016/S0736-5748(02)00046-1 [PubMed]
- 73. Fenster SD, Chung WJ, Zhai R, Cases-Langhoff C, Voss B, Garner AM, Kaempf U, Kindler S, Gundelfinger ED, Garner CC. Piccolo, a presynaptic zinc finger protein structurally related to bassoon. Neuron. 2000; 25:203–14. https://doi.org/10.1016/S0896-6273(00)80883-1 [PubMed]
- 74. Matosin N, Green MJ, Andrews JL, Newell KA, Fernandez-Enright F. Possibility of a sex-specific role for a genetic variant in FRMPD4 in schizophrenia, but not cognitive function. Neuroreport. 2016; 27:33–38. https://doi.org/10.1097/WNR.0000000000000491 [PubMed]
- 75. Kremerskothen J, Kindler S, Finger I, Veltel S, Barnekow A. Postsynaptic recruitment of Dendrin depends on both dendritic mRNA transport and synaptic anchoring. J Neurochem. 2006; 96:1659–66. https://doi.org/10.1111/j.1471-4159.2006.03679.x [PubMed]
- 76. Naeve GS, Ramakrishnan M, Kramer R, Hevroni D, Citri Y, Theill LE. Neuritin: a gene induced by neural activity and neurotrophins that promotes neuritogenesis. Proc Natl Acad Sci USA. 1997; 94:2648–53. https://doi.org/10.1073/pnas.94.6.2648 [PubMed]
- 77. Shimada T, Yoshida T, Yamagata K. Neuritin mediates activity-dependent axonal branch formation in part via FGF signaling. J Neurosci. 2016; 36:4534–48. https://doi.org/10.1523/JNEUROSCI.1715-15.2016 [PubMed]
- 78. Cahoy JD, Emery B, Kaushal A, Foo LC, Zamanian JL, Christopherson KS, Xing Y, Lubischer JL, Krieg PA, Krupenko SA, Thompson WJ, Barres BA. A transcriptome database for astrocytes, neurons, and oligodendrocytes: a new resource for understanding brain development and function. J Neurosci. 2008; 28:264–78. https://doi.org/10.1523/JNEUROSCI.4178-07.2008 [PubMed]
- 79. Emery B, Agalliu D, Cahoy JD, Watkins TA, Dugas JC, Mulinyawe SB, Ibrahim A, Ligon KL, Rowitch DH, Barres BA. Myelin gene regulatory factor is a critical transcriptional regulator required for CNS myelination. Cell. 2009; 138:172–85. https://doi.org/10.1016/j.cell.2009.04.031 [PubMed]
- 80. Li Z, Park Y, Marcotte EM. A Bacteriophage tailspike domain promotes self-cleavage of a human membrane-bound transcription factor, the myelin regulatory factor MYRF. PLoS Biol. 2013; 11:e1001624. https://doi.org/10.1371/journal.pbio.1001624 [PubMed]
- 81. Koenning M, Jackson S, Hay CM, Faux C, Kilpatrick TJ, Willingham M, Emery B. Myelin gene regulatory factor is required for maintenance of myelin and mature oligodendrocyte identity in the adult CNS. J Neurosci. 2012; 32:12528–42. https://doi.org/10.1523/JNEUROSCI.1069-12.2012 [PubMed]
- 82. Sun Y, Meijer DH, Alberta JA, Mehta S, Kane MF, Tien AC, Fu H, Petryniak MA, Potter GB, Liu Z, Powers JF, Runquist IS, Rowitch DH, Stiles CD. Phosphorylation state of Olig2 regulates proliferation of neural progenitors. Neuron. 2011; 69:906–17. https://doi.org/10.1016/j.neuron.2011.02.005 [PubMed]
- 83. LeBlanc SE, Ward RM, Svaren J. Neuropathy-associated Egr2 mutants disrupt cooperative activation of myelin protein zero by Egr2 and Sox10. Mol Cell Biol. 2007; 27:3521–29. https://doi.org/10.1128/MCB.01689-06 [PubMed]
- 84. Li H, Lu Y, Smith HK, Richardson WD. Olig1 and Sox10 interact synergistically to drive myelin basic protein transcription in oligodendrocytes. J Neurosci. 2007; 27:14375–82. https://doi.org/10.1523/JNEUROSCI.4456-07.2007 [PubMed]
- 85. Zhu Q, Zhao X, Zheng K, Li H, Huang H, Zhang Z, Mastracci T, Wegner M, Chen Y, Sussel L, Qiu M. Genetic evidence that Nkx2.2 and Pdgfra are major determinants of the timing of oligodendrocyte differentiation in the developing CNS. Development. 2014; 141:548–55. https://doi.org/10.1242/dev.095323 [PubMed]
- 86. Connor JR. Iron acquisition and expression of iron regulatory proteins in the developing brain: manipulation by ethanol exposure, iron deprivation and cellular dysfunction. Dev Neurosci. 1994; 16:233–47. https://doi.org/10.1159/000112115 [PubMed]
- 87. Erikson KM, Pinero DJ, Connor JR, Beard JL. Regional brain iron, ferritin and transferrin concentrations during iron deficiency and iron repletion in developing rats. J Nutr. 1997; 127:2030–38. [PubMed]
- 88. Diehl HJ, Schaich M, Budzinski RM, Stoffel W. Individual exons encode the integral membrane domains of human myelin proteolipid protein. Proc Natl Acad Sci USA. 1986; 83:9807–11. https://doi.org/10.1073/pnas.83.24.9807 [PubMed]
- 89. Griffiths I, Klugmann M, Anderson T, Yool D, Thomson C, Schwab MH, Schneider A, Zimmermann F, McCulloch M, Nadon N, Nave KA. Axonal swellings and degeneration in mice lacking the major proteolipid of myelin. Science. 1998; 280:1610–13. https://doi.org/10.1126/science.280.5369.1610 [PubMed]
- 90. Marty MC, Alliot F, Rutin J, Fritz R, Trisler D, Pessac B. The myelin basic protein gene is expressed in differentiated blood cell lineages and in hemopoietic progenitors. Proc Natl Acad Sci USA. 2002; 99:8856–61. https://doi.org/10.1073/pnas.122079599 [PubMed]
- 91. Montague P, McCallion AS, Davies RW, Griffiths IR. Myelin-associated oligodendrocytic basic protein: a family of abundant CNS myelin proteins in search of a function. Dev Neurosci. 2006; 28:479–87. https://doi.org/10.1159/000095110 [PubMed]
- 92. Roth MP, Malfroy L, Offer C, Sevin J, Enault G, Borot N, Pontarotti P, Coppin H. The human myelin oligodendrocyte glycoprotein (MOG) gene: complete nucleotide sequence and structural characterization. Genomics. 1995; 28:241–50. https://doi.org/10.1006/geno.1995.1137 [PubMed]
- 93. Lossos A, Elazar N, Lerer I, Schueler-Furman O, Fellig Y, Glick B, Zimmerman BE, Azulay H, Dotan S, Goldberg S, Gomori JM, Ponger P, Newman JP, et al. Myelin-associated glycoprotein gene mutation causes Pelizaeus-Merzbacher disease-like disorder. Brain. 2015; 138:2521–36. https://doi.org/10.1093/brain/awv204 [PubMed]
- 94. Kim T, Fiedler K, Madison DL, Krueger WH, Pfeiffer SE. Cloning and characterization of MVP17: a developmentally regulated myelin protein in oligodendrocytes. J Neurosci Res. 1995; 42:413–22. https://doi.org/10.1002/jnr.490420316 [PubMed]
- 95. Kasama-Yoshida H, Tohyama Y, Kurihara T, Sakuma M, Kojima H, Tamai Y. A comparative study of 2′,3′-cyclic-nucleotide 3′-phosphodiesterase in vertebrates: cDNA cloning and amino acid sequences for chicken and bullfrog enzymes. J Neurochem. 1997; 69:1335–42. https://doi.org/10.1046/j.1471-4159.1997.69041335.x [PubMed]
- 96. Kursula P. Structural properties of proteins specific to the myelin sheath. Amino Acids. 2008; 34:175–85. https://doi.org/10.1007/s00726-006-0479-7 [PubMed]
- 97. Lappe-Siefke C, Goebbels S, Gravel M, Nicksch E, Lee J, Braun PE, Griffiths IR, Nave KA. Disruption of Cnp1 uncouples oligodendroglial functions in axonal support and myelination. Nat Genet. 2003; 33:366–74. https://doi.org/10.1038/ng1095 [PubMed]
- 98. Nardo G, Iennaco R, Fusi N, Heath PR, Marino M, Trolese MC, Ferraiuolo L, Lawrence N, Shaw PJ, Bendotti C. Transcriptomic indices of fast and slow disease progression in two mouse models of amyotrophic lateral sclerosis. Brain. 2013; 136:3305–32. https://doi.org/10.1093/brain/awt250 [PubMed]
- 99. Gentleman RC, Carey VJ, Bates DM, Bolstad B, Dettling M, Dudoit S, Ellis B, Gautier L, Ge Y, Gentry J, Hornik K, Hothorn T, Huber W, et al. Bioconductor: open software development for computational biology and bioinformatics. Genome Biol. 2004; 5:R80. https://doi.org/10.1186/gb-2004-5-10-r80 [PubMed]
- 100. Barrachina M, Castaño E, Ferrer I. TaqMan PCR assay in the control of RNA normalization in human post-mortem brain tissue. Neurochem Int. 2006; 49:276–84. https://doi.org/10.1016/j.neuint.2006.01.018 [PubMed]
- 101. Durrenberger PF, Fernando FS, Magliozzi R, Kashefi SN, Bonnert TP, Ferrer I, Seilhean D, Nait-Oumesmar B, Schmitt A, Gebicke-Haerter PJ, Falkai P, Grünblatt E, Palkovits M, et al. Selection of novel reference genes for use in the human central nervous system: a BrainNet Europe Study. Acta Neuropathol. 2012; 124:893–903. https://doi.org/10.1007/s00401-012-1027-z [PubMed]