Submit an Article
Navigate
Home
Editorial Board
Editorial Policies
Current Volume
Archive
Scientific Integrity
Publication Ethics Statements
Interviews with Outstanding Authors
Newsroom
Sponsored Conferences
Podcast
Contact
Special Collections
Submit an Article
Online ISSN: 1945-4589
Research Paper
|
Volume 9, Issue 3
|
pp. 823–851
Amyotrophic lateral sclerosis, gene deregulation in the anterior horn of the spinal cord and frontal cortex area 8: implications in frontotemporal lobar degeneration
Back to article
Figure 2
(2 of 6)
−
100%
+
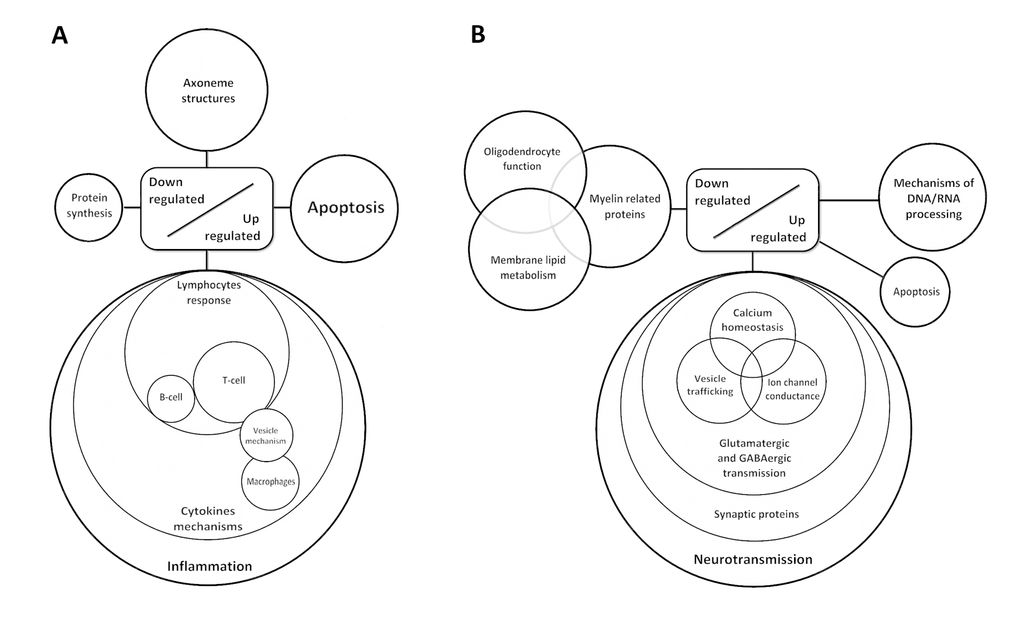
Figure 2.
Diagram showing de-regulated gene clusters in the anterior horn of the spinal cord (
A
) and frontal cortex area 8 in ALS (
B
) as revealed by whole transcriptome arrays.