


Introduction
Huntington’s disease (HD) is caused by a mutation that leads to an expansion of a polyglutamine stretch in the huntingtin (HTT) protein. Disease pathology has been traditionally confined to the central nervous system; however, mutated huntingtin (mHTT) is ubiquitously expressed throughout the body in humans and other mammals [1–4]. HD is associated with abnormalities in peripheral tissues and results in various symptoms, including weight loss, skeletal muscle atrophy, cardiac failure, testicular atrophy, osteoporosis, and blood cell dysfunction, none of which are considered connected to neurological dysfunction or general sickness (summarized in [5]).
Blood cells are affected in many ways in HD, with HD hematic cells exhibiting altered gene transcription [6,7], caspase activity [8], and mitochondrial activity [9,10]. Immune-system dysfunction is a noticeable symptom of HD pathogenesis in the periphery, where characteristic increase in the levels of circulating pro-inflammatory cytokines [11] and chemokines [12] are observed in the blood many years prior to disease onset. Additionally, HD myeloid cells are hyperactive in response to stimulation [13] and exhibit functional deficits when migrating to chemotactic stimuli [14] and phagocytosing fluorescent beads [15]. Furthermore, the level of mHTT in T lymphocytes was correlated with disease-burden scores and caudate atrophy [16]. These collective findings suggest that mHTT expression causatively affects immune-system integrity and T lymphocyte function.
The precise function of HTT is unclear. HTT is implicated in several cellular processes, including transcriptional regulation. Wild-type (wt) HTT is known to interact with a number of transcription factors and regulators, such as the tumor suppressor TP53 [16], NF-κB [17], CREB-binding protein (CBP) [16], NeuroD [18], SP1 [19], CA150 [20], TAFII130 [19], NCOR [21], CtBP [22], and REST/NRSF [23], to promote and/or repress gene transcription. Because these HTT partners are ubiquitously expressed, mHTT may disturb transcriptional mechanisms common to many genes [24,25] and hamper gene transcription in various peripheral tissues, although the mechanism of affecting the activity of transcriptional factors in HD is quite complex including inhibition, sequestration, protein degradation, and transcriptional dysregulation. Substantial alterations in mRNA expression were reported in various tissues of HD transgenic mice [26–28] and in the blood of HD patients [6,29–31]. Notably, many of HTT partners are chromatin modifiers and remodelers involved in epigenetic regulation, which raises the possibility that the integrity of the epigenetic system is affected in mHTT-expressing cells.
The relevance of epigenetics in human disease has been extended from the field of cancer research to several diverse conditions, including a variety of neuropathologies. HD has emerged as a prototypical paradigm of epigenetic dysregulation in a neurodegenerative condition [32]. Two lines of discovery have placed epigenetics central to neurodegenerative fields: reports of therapeutic benefits associated with histone deacetylase (HDAC)-inhibitor drugs in HD and genetic findings linking neuropathy or cerebellar ataxia-associated adult-onset dementia to deleterious mutations in proteins implicated in regulation of DNA methylation and covalent histone modifications [33]. These seminal observations led to the general hypothesis of epigenetic imbalance as an important characteristic in neurodegeneration. Both transcriptional and epigenetic dysregulation in HD models are important and early molecular events in the pathology [32]; however, it is unclear to what causative extent altered epigenetics plays in the altered transcriptional program observed in HD.
In this study, we examined the expression profile of “epi-driver” genes that encode epigenetic players functioning as writers, readers, and erasers of chromatin marks in the nucleus of splenic T lymphocytes from aged HD mice. We included several hundreds of epi-driver genes and their related genes in the analysis and measured their expression levels by group (functional category) using the spiking-in a neighbor genome for competitive PCR-amplicon sequencing (SiNG-PCRseq) method [34]. SiNG-PCRseq uses a genome of closely related species to the sample, i.e. neighbor genome, as an array of competitor templates to exploit genome-wide chemically equivalent but easily discriminable homologous sequences with a known copy arrangement in it. Multiplexed competitive PCRs using mouse cDNAs with a spike-in of the rat genome and subsequent high-throughput sequencing let us acquire very accurate relative quantities of murine epi-driver cDNA sequences to those of matched rat genomic DNA sequences. These relative quantities of different cDNA sequences are, as we know the quantitative relationship between different competitor templates in the neighbor genome, in turn comparable to one another in a given sample as well as between different samples after simple normalization. This large-scale analysis is necessary, especially given the strong functional redundancy among family member genes and the necessity of the relative expression of all redundant genes to be measured at the same time and under the same conditions. Our efforts could, we hope, provide insight into the complexity of HD-related epigenetics, HD pathogenesis and to the role of epigenetic dysregulation in other neurodegenerative diseases.
Results
Gene expression analysis of young and aged HD mice using SiNG-PCR sequencing
For expression analysis using multiplex-PCR, we selected a variety of epi-driver genes directly involved in epigenome modification, such as histone modifiers, DNA methylases, and other chromatin-structure regulators. Additionally, we also included senescence-associated genes and developmental genes regulated by Polycomb group (PcG) proteins; they were selected based on our own research interests and gleaned from a variety of recent research papers. The epi-driver gene panel consisted of 395 exonic amplicon sequences derived from 260 genes in total. We analyzed T lymphocytes from the spleens of young (2-month old) and aged (16–19-month old) HD mice [FVB-Tg(YAC128)53Hay/J] carrying the human HTT gene containing 128 CAG trinucleotide repeats. Endogenous mouse Htt was similarly expressed in wt and HD T cells as shown previously [16], and also between young and aged HD samples (Supplementary Fig. S1). The human HTT transgene, which is driven by its own promoter, was expressed only in HD mice at a level comparable to that of endogenous Htt (Supplementary Fig. S1). Using rat genomic DNA as a spike-in, spike-in neighbor genome-PCR (SiNG-PCR) [34] was performed, and the resulting amplicons were processed for Illumina sequencing, as illustrated in Figure 1A. The sequences of all competing amplicons were the same except single or few nucleotide positions carrying species-specific variations that could be discriminated after amplicon sequencing. In total, an average of 8.8 × 10⁶ reads were obtained from each sample, 62.3% of which mapped exactly to our amplicon-built reference.
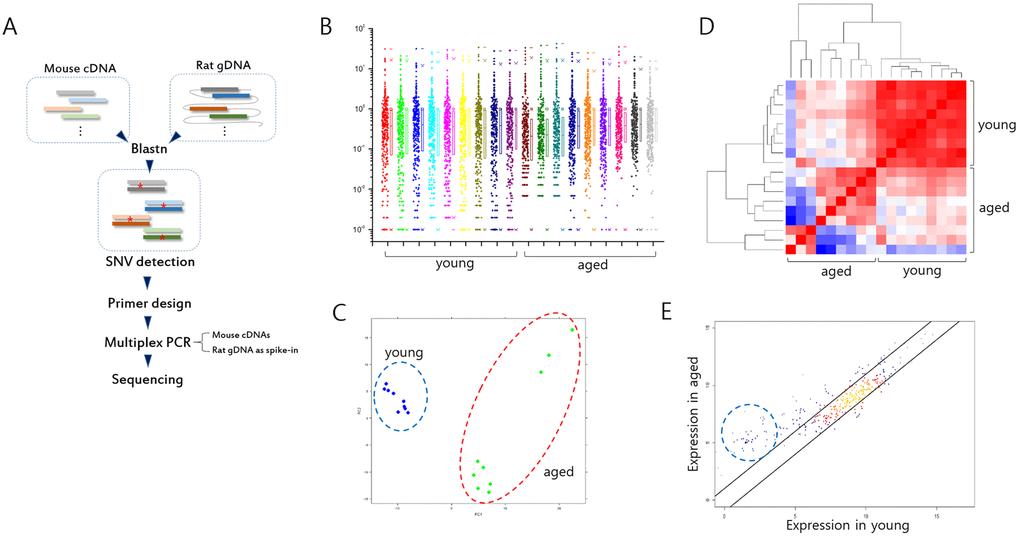
Figure 1. Analysis of gene expression in splenic T cells from mouse models of Huntington’s disease (HD). (A) Illustration of spiking-in neighbor genome PCR (SiNG-PCR) sequencing. (B) Distribution of relative counts of target-gene amplicons in young and aged HD mice. The ratio (M/R) of cDNA counts relative to rat spike-in counts was calculated to measure the expression level of each target amplicon. (C) Principal component analysis (PCA). Both young and aged sample groups are marked using colored circles. (D) Heatmap illustrating Pearson correlation between young and aged group samples. (E) Scatter plot (r = 0.9). Those of amplicons whose negligible expressions in the young group are markedly enhanced in the aged group are circled.
The expression level of each exonic sequence was measured by calculating the M/R ratio, the ratio of the mouse read counts relative to the rat’s counts. The distribution of M/R values for every target sequence is shown in Figure 1B. Principal component analysis (PCA) using the normalized M/R inputs showed differences between the young and the aged HD mice (Fig. 1C), and also between the aged wt and the aged HD mice (Supplementary Fig. S2). For aged HD samples, 16 month- and 19 month-old mice were used, and the three strong outliers in the PCA plot (also see Fig. 2A) were obtained from the older whereas the others were from the younger. We speculate that the transcriptomic distinction may come from the age difference between the aged HD samples. Unsupervised correlation analysis showed that within-group correlation was significantly stronger in the young HD than the aged HD mice group (Fig. 1D and see also Fig. S2), indicating weakening of expression control in the latter group. In the scatter plot, those of genes that were minimally expressed (M/R < 0.01) in the young HD mice showed a noticeable increase in expression level in the aged HD mice (Fig. 1E), suggesting possible derepression of normally repressed genes during the course of aging (see below).
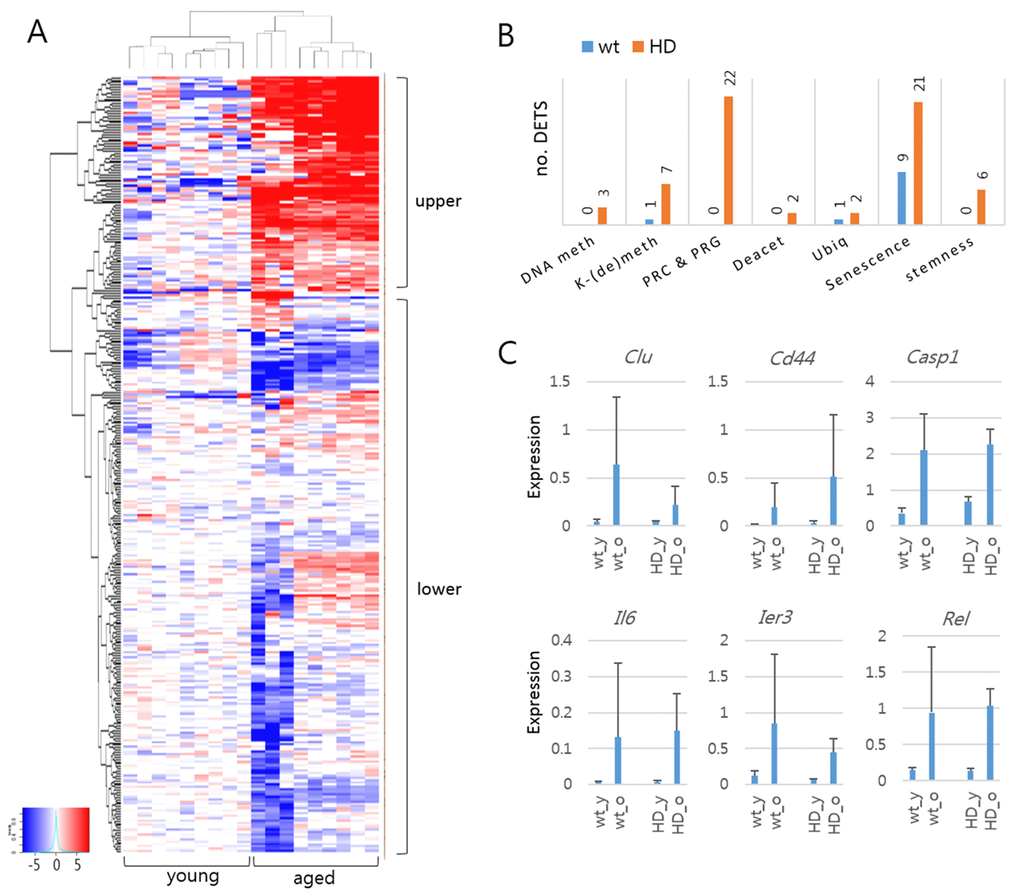
Figure 2. Differentially expressed target sequences (DETSs) in young and aged mouse models of Huntington’s disease (HD). (A) Heatmap of amplicon levels. The heatmap is arbitrarily divided into upper and lower areas, with the former containing highly expressed amplicons from the aged samples. (B) Comparison of DETSs in different functional categories between wild-type and HD samples. The number of DETSs in each category is indicated on the bar. DNA meth, DNA methylation; K-(de)meth, lysine methylation and demethylation; PRC & PRG, Polycomb group proteins and PCR-regulated genes; Deacet, histone deacetylation; Ubiq, ubiquitination. (C) Expression levels of senescence-category DETSs commonly detected in wild-type and HD samples. Error bars, standard deviation.
Identification of differentially expressed target sequences between young and aged HD mice
Figure 2A shows the heat map of amplicon levels between young and aged HD mice. Using DESeq2 (http://bioconductor.org/packages/release/bioc/html/DESeq2.html), we identified 67 differentially expressed target sequences [DETS; fold change > 2; false discovery rate (FDR) < 0.01] in the HD mice, most of which were upregulated in the aged HD mice (Table 1). These DETSs outnumbered the DETSs that identified in the comparison of wt young and aged mice by five to one (Supplementary Fig. S3). We classified the amplicons by function of their corresponding genes and found that many of the DETSs belonged to the senescence category [31% (21/67) and 64% (9/14) in HD and wt samples, respectively] (Fig. 2B). Of the 14 DETSs found in wt samples, nine were also detected as HD DETSs, with eight belonging to the senescence category (Clu, Cd44, Casp1, Il6, Rel, and Ier3) (Fig. 2C). These results showed the ability of the gene-expression analysis system to pinpoint previously identified differences between samples. In addition to the senescence-category DETSs, there were Polycomb-repressive complex (PRC)- and PRC-regulated gene (PRG)-associated DETSs that occupied the largest proportion [32% (22/67)] among the DETSs in HD mice (Fig. 2B).
Table 1. Differentially expressed exonic sequences in splenic T cells between young and aged HD mice.
| amp_id* | Category | log2FC** | FDR*** | amp_id | Category | log2FC | FDR | ||||||||||||||||||||||||||||||||||||||||||||||||||||||||||||||||||||||||||||||||||||||||||||
| Cd44_1 | Aging | 4.146 | 1.03E-12 | Scmh2_1 | PRC | 2.261 | 0.00071504 | ||||||||||||||||||||||||||||||||||||||||||||||||||||||||||||||||||||||||||||||||||||||||||||
| Rel_26 | Aging | 2.908 | 2.12E-12 | Nanog_1 | Stemness | 4.108 | 0.00073542 | ||||||||||||||||||||||||||||||||||||||||||||||||||||||||||||||||||||||||||||||||||||||||||||
| Ier3_2 | Aging | 2.534 | 7.69E-09 | Setd2_1 | K-meth | 1.480 | 0.000769123 | ||||||||||||||||||||||||||||||||||||||||||||||||||||||||||||||||||||||||||||||||||||||||||||
| Hdac10_1 | Deacet | 2.250 | 5.03E-08 | Lmx1b_1 | PRG | 3.993 | 0.000894789 | ||||||||||||||||||||||||||||||||||||||||||||||||||||||||||||||||||||||||||||||||||||||||||||
| Il6_2 | Aging | 4.598 | 0.000000229 | Clu_1 | Aging | 2.441 | 0.001019842 | ||||||||||||||||||||||||||||||||||||||||||||||||||||||||||||||||||||||||||||||||||||||||||||
| Eif2c4_1 | RNAi | 4.141 | 0.000000266 | Casp1_1 | Aging | 1.714 | 0.001462471 | ||||||||||||||||||||||||||||||||||||||||||||||||||||||||||||||||||||||||||||||||||||||||||||
| Il6_1 | Aging | 4.493 | 0.00000034 | Clu_2 | Aging | 2.287 | 0.001692421 | ||||||||||||||||||||||||||||||||||||||||||||||||||||||||||||||||||||||||||||||||||||||||||||
| Ier3_1 | Aging | 2.740 | 0.000000707 | Pax7_2 | PRG | 3.651 | 0.00266687 | ||||||||||||||||||||||||||||||||||||||||||||||||||||||||||||||||||||||||||||||||||||||||||||
| Zic2_2 | PRG | 4.234 | 0.00000115 | Rnf39_1 | Ubiq | 3.159 | 0.00266687 | ||||||||||||||||||||||||||||||||||||||||||||||||||||||||||||||||||||||||||||||||||||||||||||
| Cbx5_1 | PRC | -2.156 | 0.00000352 | Prmt5_3 | Arg_meth | -1.253 | 0.003176115 | ||||||||||||||||||||||||||||||||||||||||||||||||||||||||||||||||||||||||||||||||||||||||||||
| Ig1_108 | Aging | 4.266 | 0.00000357 | Lbr_1 | Chr_str | -1.496 | 0.003415818 | ||||||||||||||||||||||||||||||||||||||||||||||||||||||||||||||||||||||||||||||||||||||||||||
| Uhrf1_2 | DNA_meth | -2.049 | 0.00000388 | Onecut1_6 | PRG | 3.537 | 0.003788077 | ||||||||||||||||||||||||||||||||||||||||||||||||||||||||||||||||||||||||||||||||||||||||||||
| Zic2_1 | PRG | 3.303 | 0.00000389 | Pik3cd_9 | Aging | -1.281 | 0.004038879 | ||||||||||||||||||||||||||||||||||||||||||||||||||||||||||||||||||||||||||||||||||||||||||||
| Cbx5_3 | PRC | -2.145 | 0.00000487 | Tbx3_3 | PRG | 2.982 | 0.004288935 | ||||||||||||||||||||||||||||||||||||||||||||||||||||||||||||||||||||||||||||||||||||||||||||
| Cbx3_3 | PRC | 5.257 | 0.00000524 | Uhrf1_4 | DNA_meth | 1.754 | 0.004416562 | ||||||||||||||||||||||||||||||||||||||||||||||||||||||||||||||||||||||||||||||||||||||||||||
| Hdacc9_2 | Deacet | 3.309 | 0.00000539 | Kdm6b_3 | K-demeth | 1.058 | 0.004532551 | ||||||||||||||||||||||||||||||||||||||||||||||||||||||||||||||||||||||||||||||||||||||||||||
| Tbx3_4 | PRG | 2.744 | 0.0000242 | Slc14a1_1 | Aging | -1.036 | 0.004691194 | ||||||||||||||||||||||||||||||||||||||||||||||||||||||||||||||||||||||||||||||||||||||||||||
| Rnf39_2 | Ubiq | 3.898 | 0.0000711 | Otx2_1 | PRG | 4.790 | 0.004691194 | ||||||||||||||||||||||||||||||||||||||||||||||||||||||||||||||||||||||||||||||||||||||||||||
| Cdx2_1 | PRG | 4.403 | 0.000072 | Ppargc1a_1 | Aging | 3.435 | 0.004965943 | ||||||||||||||||||||||||||||||||||||||||||||||||||||||||||||||||||||||||||||||||||||||||||||
| Axin2_1 | Stemness | -1.727 | 0.000072 | Prdm2_3 | K-meth | 2.067 | 0.004965943 | ||||||||||||||||||||||||||||||||||||||||||||||||||||||||||||||||||||||||||||||||||||||||||||
| Jmjd7_1 | K-demeth | 2.028 | 0.0000773 | Hoxa1_1 | PRG | 3.181 | 0.004965943 | ||||||||||||||||||||||||||||||||||||||||||||||||||||||||||||||||||||||||||||||||||||||||||||
| Bub1b_51 | Aging | -1.540 | 0.000139024 | Hoxb1_3 | PRG | 3.249 | 0.004965943 | ||||||||||||||||||||||||||||||||||||||||||||||||||||||||||||||||||||||||||||||||||||||||||||
| Slc14a1_2 | Aging | -1.644 | 0.000145455 | Ppargc1a_1 | Aging | 3.280 | 0.005252247 | ||||||||||||||||||||||||||||||||||||||||||||||||||||||||||||||||||||||||||||||||||||||||||||
| Kdm6b_2 | K-demeth | 1.500 | 0.000145455 | Chaf1a_3 | chaperon | -0.998 | 0.005664136 | ||||||||||||||||||||||||||||||||||||||||||||||||||||||||||||||||||||||||||||||||||||||||||||
| Casp1_2 | Aging | 1.738 | 0.000154164 | Prdm9_4 | K-meth | 2.446 | 0.005664136 | ||||||||||||||||||||||||||||||||||||||||||||||||||||||||||||||||||||||||||||||||||||||||||||
| Ppargc1a_2 | Aging | 4.100 | 0.00018008 | Neurog1_1 | PRG | 3.446 | 0.006245221 | ||||||||||||||||||||||||||||||||||||||||||||||||||||||||||||||||||||||||||||||||||||||||||||
| Sox6_3 | PRG | 1.976 | 0.000209766 | Pax7_3 | PRG | 3.786 | 0.006245221 | ||||||||||||||||||||||||||||||||||||||||||||||||||||||||||||||||||||||||||||||||||||||||||||
| Nkx2.2_3 | PRG | 4.032 | 0.000328876 | Rbl2_2 | Stemness | -1.331 | 0.006245221 | ||||||||||||||||||||||||||||||||||||||||||||||||||||||||||||||||||||||||||||||||||||||||||||
| Deptor_46 | Aging | 2.549 | 0.000334226 | Nodal_2 | Stemness | 3.430 | 0.006294356 | ||||||||||||||||||||||||||||||||||||||||||||||||||||||||||||||||||||||||||||||||||||||||||||
| Dnmt1_2 | DNA_meth | -1.651 | 0.00045605 | Nkx2.2_2 | PRG | 3.503 | 0.007498966 | ||||||||||||||||||||||||||||||||||||||||||||||||||||||||||||||||||||||||||||||||||||||||||||
| Phc3_4 | PRC | 1.980 | 0.000664392 | Ash1l_7 | K-meth | 1.597 | 0.008258801 | ||||||||||||||||||||||||||||||||||||||||||||||||||||||||||||||||||||||||||||||||||||||||||||
| * indicated by gene name | |||||||||||||||||||||||||||||||||||||||||||||||||||||||||||||||||||||||||||||||||||||||||||||||||||
| ** Expression levels of aged over young samples. FC, fold-change | |||||||||||||||||||||||||||||||||||||||||||||||||||||||||||||||||||||||||||||||||||||||||||||||||||
| *** FDR, false discovery rate | |||||||||||||||||||||||||||||||||||||||||||||||||||||||||||||||||||||||||||||||||||||||||||||||||||
Target genes of the Polycomb-repressive complex were significantly upregulated in aged HD mice
The heat map in Figure 2A shows two large upper (86 amplicons; 26%) and lower (242 amplicons; 74%) clusters, with the upper one consisting of genes highly expressed in the aged HD mice. Profiling the functional categories associated with the aged-high amplicons revealed that the cluster was enriched with PRGs. Of the 23 PRGs in the panel, 19 (83%) were present in this cluster (Fig. 3A). Although the transcript levels of PRGs were very low (see below), they were consistently high in aged HD mice compared with those in young HD (Fig. 3B) and also compared with those in aged wt mice (Fig. 3C). Similar findings were observed in wt mice, although the aged-to-young difference was smaller (Fig. 3D). In the comparison between young HD and wt samples, there was no biased expressions of PRGs (Fig. 3E). In line with the increased expression of PRGs, Ezh2, the H3K27-methylating enzyme that activates PRC2-mediated chromatin repression was downregulated in aged HD mice (Fig. 3F). This result was reminiscent of previous reports that Ezh2 deficiency and subsequent decrease of repression-associated H3K27me3 lead to a rapid senescence [35,36]. Our result suggested that the age-dependent derepression of PRGs was biased toward HD mice. Wt HTT interacts with Ezh2 to facilitate the histone H3K27 trimethylase activity of PRC2 [37]. It remains unclear whether mHTT can maintain interaction with Ezh2; however, our result suggested that mHTT dysregulated Ezh2 at the mRNA level. We verified the derepression of various PRGs in aged HD mice by RT-PCR (Fig. 3G).
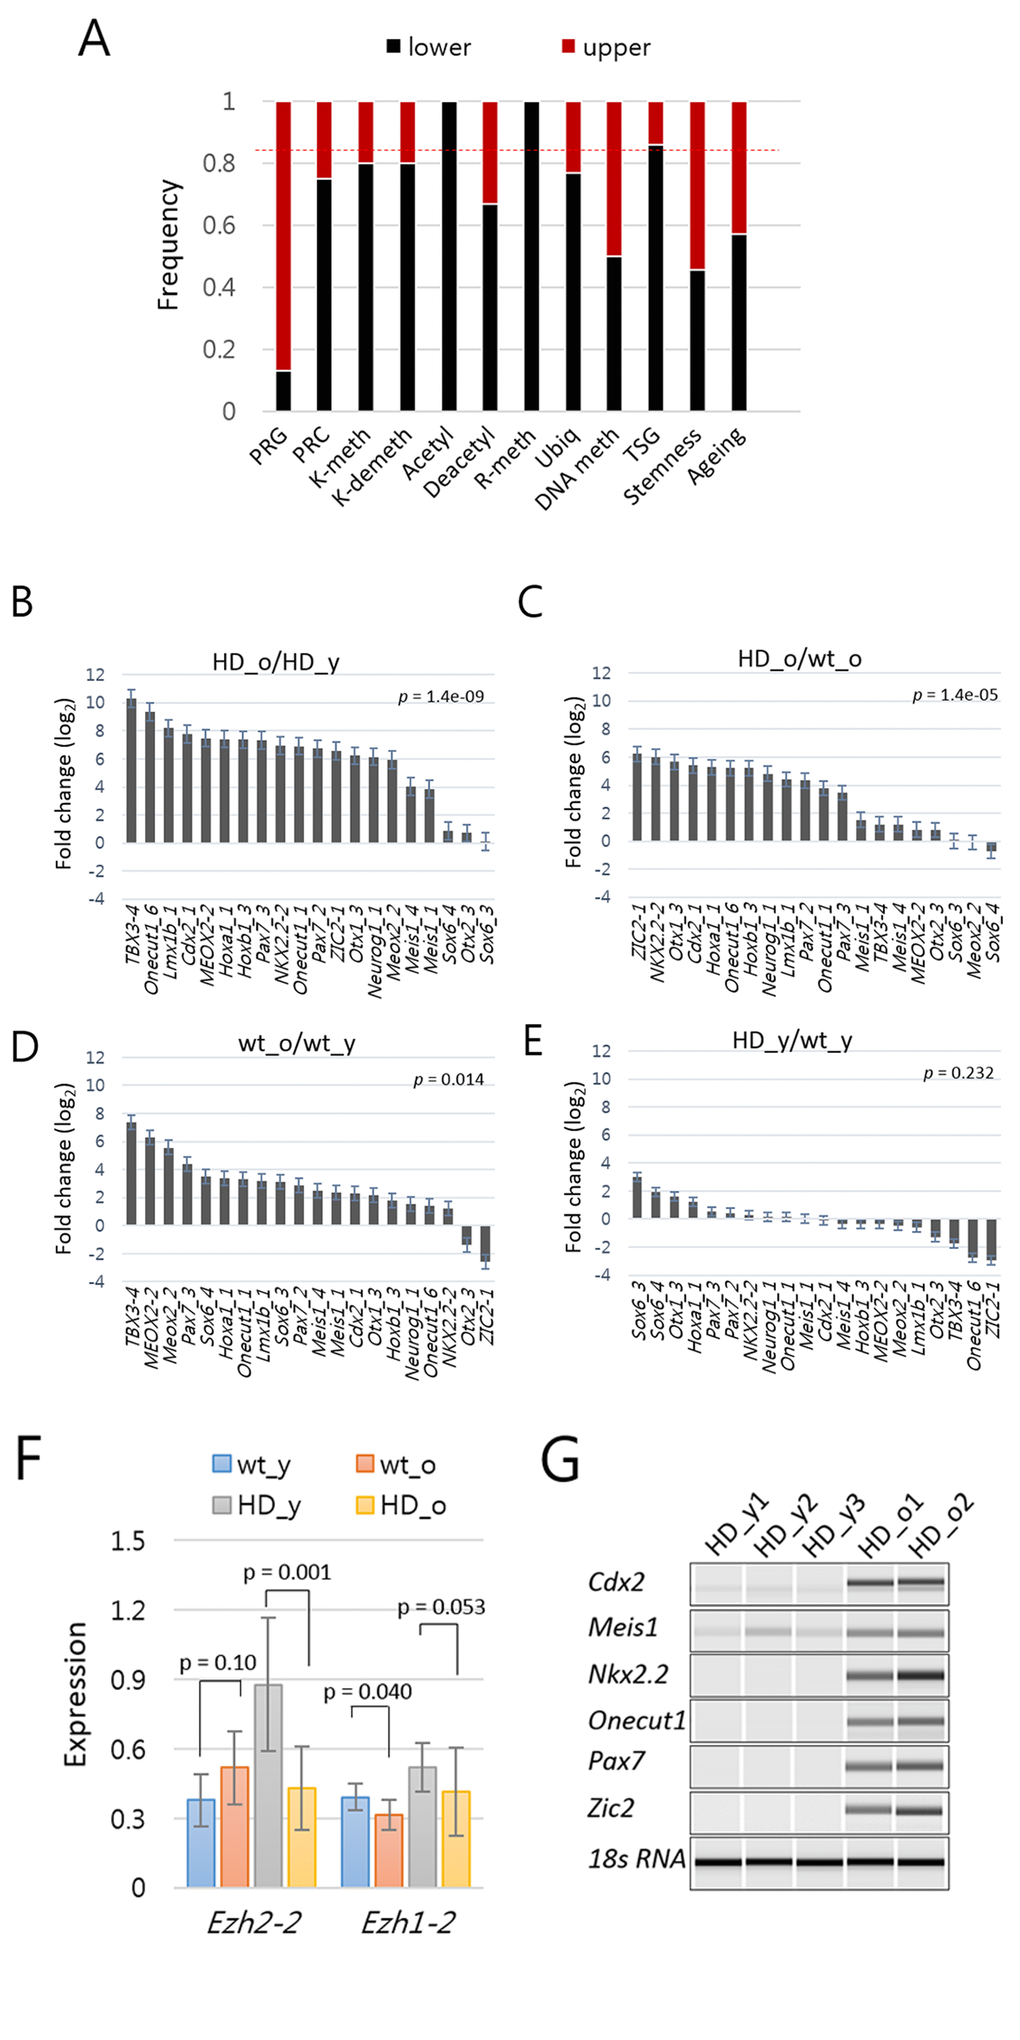
Figure 3. Increased expression of Polycomb repressive complex (PRC)-regulated genes (PRG) in aged mouse models of Huntington’s disease (HD). (A) The proportion of amplicons in each category that belong to the upper (red) and lower (black) clusters in the heat map shown in Figure 2A. The upper cluster amplicons represent 26% of the total amplicons as indicated by dotted line (red). TSG, tumor suppressor genes. For other abbreviations, refer to the Figure 2 legend. (B-E) Fold difference (log2) in the amount of PRG amplicons between aged HD vs. young HD (B), between aged HD vs. aged wild-type (wt) (C), between aged wt and young wt (D), and between young HD vs. young wt samples (E). P-values, paired-sample t-test. Error bar, standard error. (F) Comparison of expression levels of Ezh2 in HD and wild type samples. P-value, paired-sample t-test. Error bar, standard deviation. (G) RT-PCR analysis of PRGs. PRGs were randomly chosen, and expression levels were examined in splenic T cells from young (HD_y) and aged HD (HD_o) mice. 18s RNA, loading control.
Analysis of the pattern of age-associated change in epi-driver gene expression suggests a shift in chromatin to a more relaxed and accessible state in HD mice.
We next calculated mean ratios of the expression levels of epi-driver genes in each category between aged and young samples in HD and wt control mice (Fig. 4). Acetylation-category transcripts were downregulated with great consistency in the aged samples in both wt (p = 0.0001) and HD (p = 0.0055) groups while there was no age-related difference (p = 0.2186) between the HD and wt groups. K methylation- and K demethylation-category genes were significantly downregulated in the aged wt samples whereas they appeared to be oppositely upregulated (though not significantly) in the aged HD samples. PRC-category genes showed age-related expression difference in the HD samples (p = 0.0003) and to a lesser extent in the wt samples (p = 0.0013). PRG-category amplicons exhibited age-associated difference in both wt and HD samples but the difference was far more significant in the HD samples (p = 1.4e-09 vs. p = 0.0146; see also Fig. 3) and, more importantly, they showed the highest age-associated difference (p = 0.0011) between the HD and wt mice. The expression levels of R methylation- category genes were also altered in the aged HD (p = 0.0299).
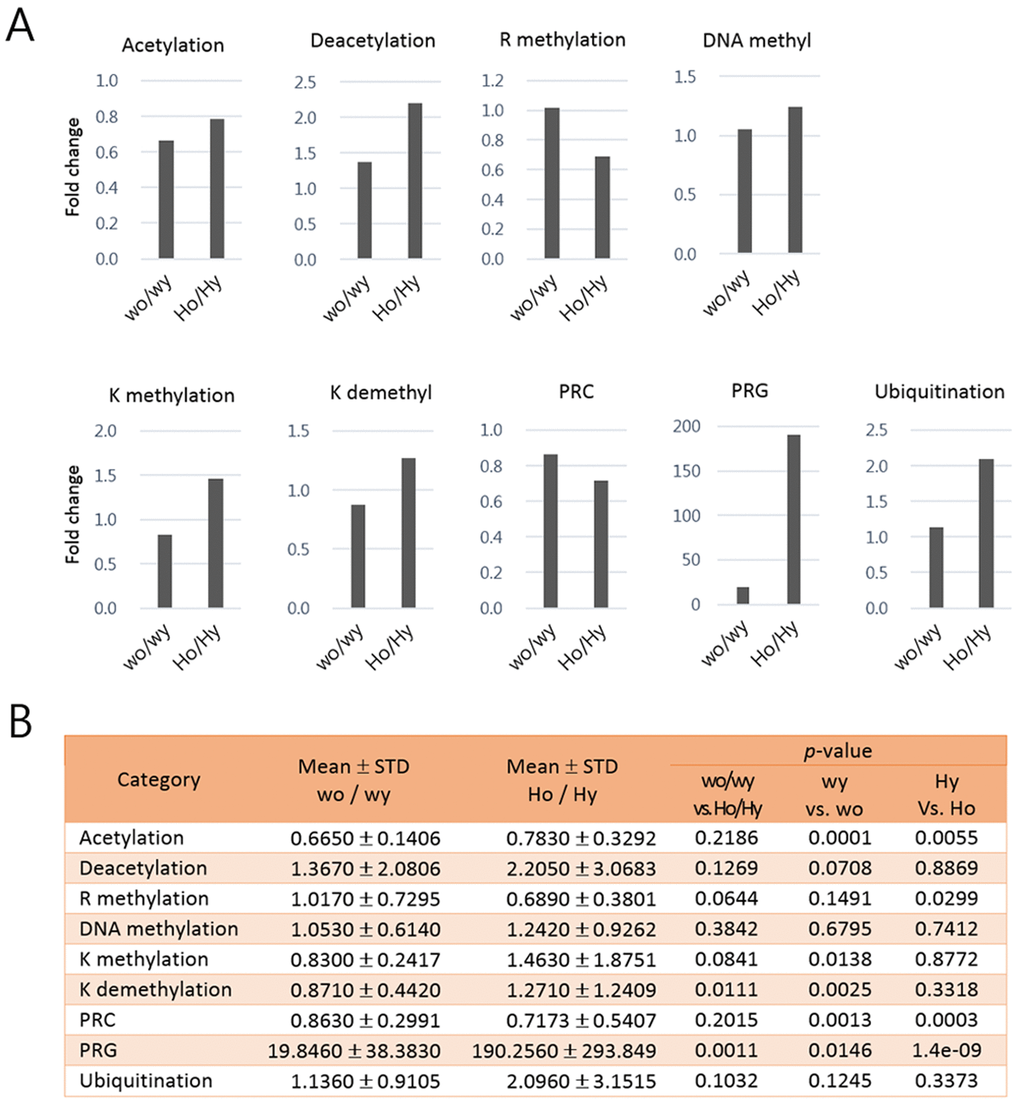
Figure 4. Comparison of the mean ratios of epi-driver gene expression levels in each category between young and aged samples of Huntington’s disease (HD) mice and control mice. In (A) each bar shows the fold change of epi-driver gene expression levels in each category between aged and young samples. In (B) the mean fold changes, standard deviations (STD), and p-values (paired-sample t-test) between indicated comparisons are represented for the graphs in A. Wo and wy, old and young wild-type samples; Ho and Hy, old and young HD samples.
We measured the fold changes in the amount of individual amplicons between the aged and the young samples of HD mice (Fig. 5). The acetylation-category amplicons were mostly downregulated in aged HD samples (Fig. 5A, see also Fig. 4). A variety of genes are involved in histone K-methylation and demethylation. Lysine methyltransferases can switch chromatin to a relaxed or closed state depending upon which lysine residues they attack, similar to lysine demethylases. In the aged HD mice, chromatin-relaxing lysine methyltransferases, such as Setd2 (H3K36-specific), Ash1l (H3K4), and Prdm9 (H3K4), were upregulated whereas chromatin-packing enzymes, such as Ezh2 (H3K27) and Setdb1 (H3K9), were downregulated (Fig. 5B). Among the lysine demethylases, Kdm4d (H3K9-specific) and Kdm6b (H3K27) were upregulated, whereas Kdm1b (H3K4), Kdm5c (H3K4), and Kdm8 (H3K36) were downregulated in the aged HD mice (Fig. 5C). We also examined the K methylation- and K demethylation-category genes in the wt samples but they did not exhibit the pattern of change observed in the HD samples (Supplementary Fig. S4). We already identified the underrepresentation of PRC genes in the aged HD mice (Fig. 4), which agreed with the upregulation of PRGs in the same set of samples (Fig. 3 and 4). In DNA-methylation category, Dnmt1 and Uhrf1, both involved in the maintenance of methylation, were downregulated in the aged HD samples (also see Supplementary Fig. S5), whereas Tet2 and Tet3, which are implicated in DNA demethylation, were upregulated (Fig. 5D). Figure 5E summarizes the upward or downward changes in expression levels of epi-driver genes in each category according to HD mouse age. Most of the changes are evident of relaxed chromatin structure and increased chromatin accessibility to nuclear proteins. These changes are, however, ambiguous in the wt samples (Supplementary Fig. S4) and thus considered to be characteristic of HD samples.
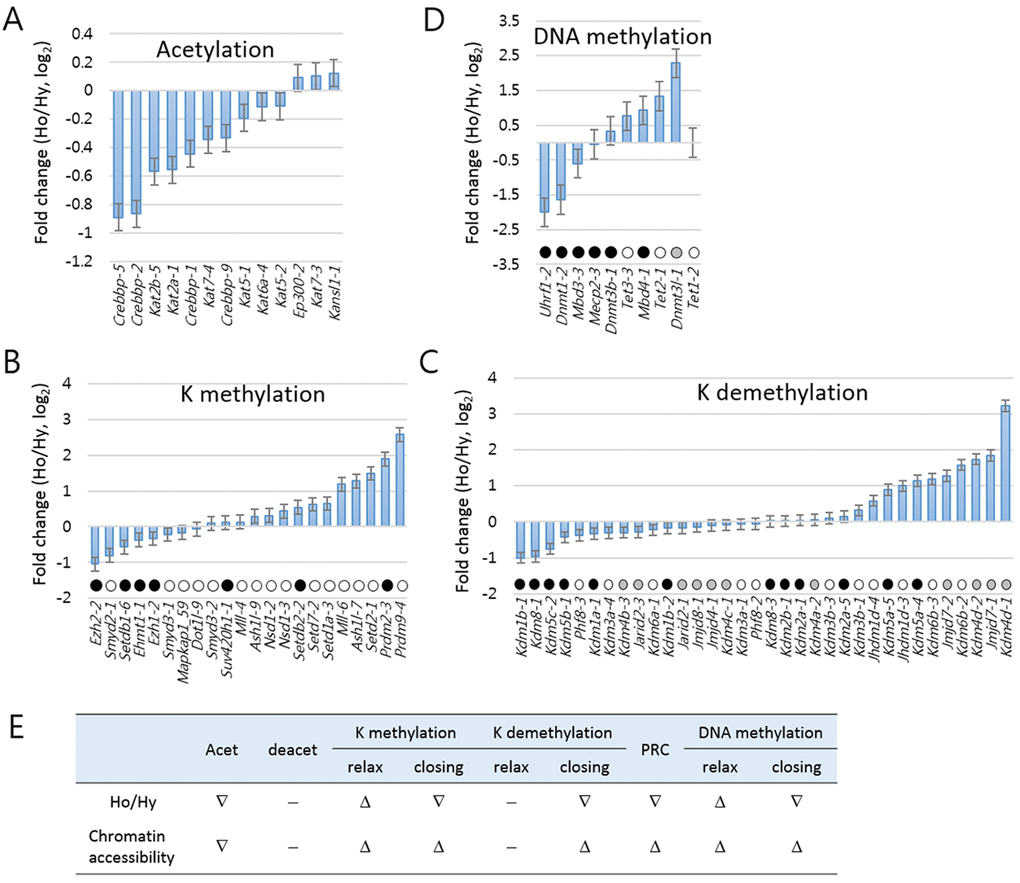
Figure 5. Analysis of age-associated pattern of change in epi-driver gene expressions in Huntington’s disease mice. Fold changes were measured for the epi-driver gene amplicons in the categories of acetylation (A), lysine (K) methylation (B), K demethylation (C), Polycomb-repressive complex (PRC, C), and DNA methylation (D). In B-D, amplicons are differentially marked according to their modification effects on chromatin accessibility: open circles indicate increased accessibility; solid circles indicate reduced accessibility; and grey circles for cases involving either increased or reduced accessibility. (E) Summary of the upward (Δ) or downward (∇) change in expression of epi-driver genes in each category. ‘-‘ indicate no significant change. Ho and Hy, old and young HD samples.
DNase-I hypersensitivity sequencing (DNase-seq) result demonstrates an increase of chromatin accessibility in aged HD cells compared to wild-type control
To examine if there was alteration in chromatin accessibility at transcription start site (TSS) in aged HD samples, we performed DNase I hypersensitivity (DHS) assay using splenic mononuclear cells obtained from 15 -16 month-old HD mice. Fifty - 100 bp in size of DNase I-digested genomic DNA fragments that were largely derived from nucleosome-deficient genomic regions [40] were collected and sequenced. We inspected DHS signals at 36,728 TSSs (± 2 kb) in aged HD and wt samples. As shown by a scatter plot in Fig. 6A (r = 0.32), DHS signals were shown skewed toward HD sample as they were enriched in HD sample more than in wt (6,778 vs. 4,444 TSSs, respectively). A clustering analysis using the k-means algorithm divided the 36,728 TSSs in total into two clusters (Fig. 6B). Cluster-1 consisted of 4,994 gene promoters having relatively condensed DHS reads at TSSs in both HD and wt samples, with the average read density marginally smaller in HD sample (fold-change = 0.704, p < 2.2e-16; Fig. 6C). On the contrary, the remained 31,734 gene promoters in cluster-2 displayed rather shallow DHS signals at TSSs, and these weak signals were more enriched in HD sample compared to wt (fold-change = 1.287, p < 2.2e-16; Fig. 6D). We examined the 16 PRGs listed in Fig. 3. All of them except Meis1 belonged to the cluster-2 and two-third (10 PRGs) of them had higher DHS read counts in HD sample, agreeing with the upregulation of PRGs in aged HD sample (Fig. 3C). The enrichment of weak DHS signals in cluster-2 indicates that HD chromatin becomes more accessible than wt chromatin with age, conforming to the theory of an enhanced shift in chromatin to a more relaxed structure with age in HD sample. Together, it suggests that age-associated deregulation of overall chromatin structure increases decondensation of closed chromatin, which subsequently results in a partial activation of normally repressed genes.
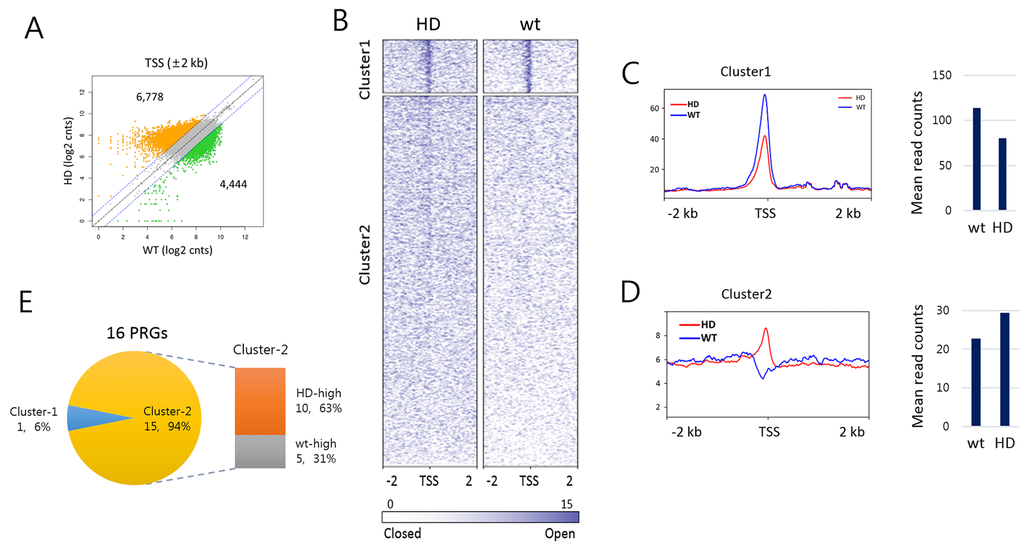
Figure 6. DNase-I hypersensitive site profiling in aged Huntington’s disease (HD) and wild-type splenic cells. (A) Scatter plot of DNase-I hypersensitive (DHS) read counts (log2) between HD and wt around transcription start site (TSS). DHS reads ± 2 kb around TSSs were counted. Colored dots (orange for HD-high and green for wt-high) indicate DHSs reads with 2-fold or more count differences. (B) Heatmaps of DHS signals around TSSs (± 2 kb) in HD and wt mice. DHS signals were clustered by the k-means algorithm (k = 2). Sites are ordered by DHS signal intensity around TSS. (C-D) Read count distribution around TSSs (± 2 kb, left) and the mean DHS signal density around TSSs (± 300 bp, right) in cluster-1 (C) and cluster-2 (D). (E) Comparison of DHS signal density at PRG TSSs between HD and wt samples. Shown are the proportions of PRGs with HD-high (orange) and wt-high (gray) DHS signals. Of the 16 PRGs, 15 PRGs belong to cluster-2 and 10 (63%) have denser signals in HD sample than in wt.
Discussion
Our results from the expression analysis of epi-driver genes and DNase-seq experiment indicated that aging was accompanied by chromatin-conformation changes, shifting chromatin into a more relaxed and accessible state. HTT mutation appears to speed up and/or broaden the epigenomic alterations, and the resulting global changes subsequently causes de-repression of many genes that should otherwise have been kept tightly suppressed. Concomitantly increasing transcriptional noise over the aging genome and accompanying chaotic biochemical activities of proteins derived from leaked mRNAs can disturb homeostasis in cell physiology. The reduced expression of epi-driver genes implicated in chromatin-mediated gene repression may be responsible for the activation of silenced genes, possibly through repositioning insufficient transcriptional repressors to more demanding genomic regions and resulting in their depletion in situ.
Genome-wide studies in aging cells and tissues have uncovered epigenetic drift that reflects age-related decline of epigenetic integrity of the genome mediated by imperfect maintenance of epigenetic marks (for review, see [41,42]). One important theme about key signature of aging chromatin or epigenetic drift is the loss of repressive marks (or heterochromatin) and gain of activating marks that have profound effects on gene expression [36]. In worms, knockdown of the H3K4me3 (activating mark) methyltransferase set-2 extends lifespan while knockdown of the H3K4me3 demethylase rbr-2 shortens lifespan [43], the two of which regulate H3K4me3 at global level [44]. In contrast, the expression of H3K27me3 (repressive mark) demethylase utx-1 increases during worm aging, accompanied by a reduction of global H3K27me3 level [45]. RNAi depletion of utx-1 in worm increases global levels of H3K27me3 and improves longevity [46], although in other aging model organisms the modulation of H3K27me3 methyltransferase or demethylase activity manifests a confounding phenotypes (for detail, see [36,47]). In mammals, constitutive heterochromatin structure is disturbed in senescent cells, as evidenced by reduced global DNA methylation, H3K9me3, and HP1 levels [48,49]. The loss of EZH2 and subsequent decrease of H3K27me3 level are marked in human senescent cells, and overexpression of EZH2 suppresses cellular senescence [35,50,51]. In human progeria models, global H3K9me3 (repressive mark) and H3K27me3 levels decrease [48,52,53]. We here showed in aged HD mice that H3K4 methyltransferases Ash1l and Prdm9 were upregulated whereas Ezh2 and H3K9 methyltransferases Setdb1 were downregulated, and that H3K4 demethylases Kdm1b and Kdm5c were downregulated whereas H3K9 demethylase Kdm4d and H3K27 demethylase Kdm6b were upregulated (Fig. 5B). These orchestrated changes in the expression levels of epi-driver genes of certain categories predict a shift in chromatin to a more relaxed state which fits the general aging chromatin signature - heterochromatin loss.
Slight derepression of genes by epigenomic change in some portion of genome pool would result in many fold increase of expression compared to complete repression. On the other hand, the change in expression level would not be easily noticed from slight repression by epigenetic drift of actively expressed genes (it was, in reality, observed from the DNase-seq result in Fig. 6C). In HD mouse, the increase of expression level in the aged samples was broadly observed for the genes whose expression level was kept low or naught in young samples (Fig. 1E). Wt mice also exhibited this trend but far lesser degree. We therefore conclude that the tendency of epigenetic drift is more enhanced in HD than in wt mouse.
mHTT expression leads to reduced histone acetylation through its association with histone acetyltransferases, including CBP and P300/CBP-associated factor [17,54], or aggregating CBP and other transcriptional regulators in the nucleus and cytoplasm [55]. Additionally, global histone hypoacetylation was induced in cells stably transfected with mHTT [54]. These studies reported mHTT toxicity to CBP and other histone acetyltransferases. In addition to the influence of mHTT at the protein level, we here analyzed the effect of mHTT on these histone acetyltransferases at the transcriptional level. We found that the amount of the acetylation-category transcripts in the aged samples by a similar level both in the wt and HD groups (the mean aged vs. young fold-changes were 0.665 (± 0.1406) and 0.780 (± 0.3292), respectively; Fig. 4). The result suggests that the reduced transcription of acetyltransferase genes was typical of aged cells, not further intensified in HD samples, and that mHTT is unlikely to regulate the histone acetyltransferases at the transcriptional level. Meanwhile, it is known that the sequestration of CBP protein by mHTT causes histone hypermethylation as well as hyperacetylation, and the subsequent transcriptional dysfunction of neurons in HD [56–60]. These observations were in agreement with our result of increased expressions (~1.4 fold) of K methylation-category genes specifically in aged HD samples, but not in the aged wt samples (Fig. 4). In HD brain, a loss of CBP leads to elevated expression of SETDB1, an H3K9 trimethylating enzyme [38,39] and subsequently to condensation of heterochromatin structure [60,61]. This is not the case with HD blood cells because Setdb1 expression was oppositely slightly decreased in both aged wt and HD samples (Fig. 5B). This discrepancy probably reflects tissue-specific effects of mHTT.
The alteration in gene expression of the epi-driver genes in HD mice suggested a potential use of epigenetic drugs as therapeutics to mitigate the HD phenotype. Studies using models of polyglutamine diseases reported that HDAC inhibitors might serve as useful agents to ameliorate the polyglutamine pathology found in HD [6,54,55,62,63]. This is based on the hypothesis that if the polyglutamine pathology involves suppression of histone acetylation (or acetylation of other proteins), inhibition of the deacetylation process would slow or reduce polyglutamine pathogenesis in vivo [54]. Our results presented here showed that levels of deacetylation-category genes remained unchanged (p > 0.188) in the aged HD samples (Fig. 4), thereby supporting the possible use of HDAC inhibitors to increase histone acetylation in HD patients.
Materials and Methods
HD model animals
In this study, we used YAC128 mice, which contain 128 CAG repeats of the human HTT gene under the control of yeast artificial chromosome [64], as HD model. These mice were previously reported with abnormal motor control and neuronal loss in striatum [64]. YAC128 mice were purchased from the Jackson Laboratories (Bar Harbor, ME, USA) and maintained under a 12 hours of dark/light life cycle in a temperature and humidity-controlled environment with free access to food and water. The presence of transgene in YAC128 was determined by genotyping with polymerase chain reaction (PCR) using primers as follows: forward 5’-CCGCTCAGGTTCTGCTTTTA-3’, reverse 5’-TGGAAGGACTTGAGGGACTC-3’. A total 7 of female littermate (wt) mice were used for this study at 16-19 months (n=4) and 2 months (n=3) of age. A total 7 of female mutant (HD) mice at 16-19 months (n=3) and 2 months (n=4) were used for this study. All procedures were performed with approval by Hanyang Institutional Animal Care and Use Committee (HY-IACUC-09-017).
T cell isolation and nucleic acid preparation
Single-cell suspensions were prepared from spleens by mechanical dissociation, followed by removal of red blood cells (RBCs) with ACK Lysing Buffer (Lonza). T cells were further isolated by using Pan T cell Isolaton Kit II, mouse (Miltenyi Biotec). Untouched T cells were isolated with a mixture of CD11b, CD11c, CD19, CD45R, CD49b, CD105, Anti-MHC-class II, and Ter-119 and corresponding streptavidin microbeads on MACS-LS columns according to the manufacturer’s protocol. Cell viability was assessed by trypan blue exclusion, and cell purity, which was > 95%, was determined by flow cytometry. Total RNAs were isolated from Magnetic-activated cell sorting (MACS) purified T-cells and macrophages using commercially available kit (RNeasy mini kit, Qiagen). cDNA was synthesized using iScriptTM cDNA Synthesis Kit (BioRad) according to the manufacture’s instruction.
Multiplex PCR
Mouse reference mRNA sequences for 260 genes were retrieved from the NCBI Reference Sequence Database and individually aligned to their respective rat genome sequence via BLAST to find homologous sequence stretches containing as few nucleotide inter-species variations (ISVs) as possible. The genes in this study were selected based on our own research interests: they are mostly related to epigenetic regulation mechanisms as we described elsewhere [34]. Homologous sequence stretches were subjected to Primer3 [65] to design primer pairs that bind both mouse and rat sequences simultaneously in PCR amplicon while encompassing the small numbers of ISV nucleotides in its amplicons to discriminate species origin. Primers were pooled into 19 groups of ~28 pairs in such a way that multiple primer pairs for a single transcript are separately assigned to different groups, to avoid the production of unintended amplicons. A multiplex PCR was carried out using each primer group with the following conditions: 15 min of enzyme activation at 95 °C followed by 45 cycles of 95 °C for 20 sec, 57 °C for 40 sec, and 68 °C for 1 min.
Library construction and sequencing
All amplicons generated with 19 rounds of multiplex PCR were pooled together using equal volumes for each sample. For amplicon library construction, a series of enzymatic reactions with intermittent purifications using ExpinTM PCR (GeneAll) were performed, including 5′-end phosphorylation, adaptor ligation and two further PCR amplifications to attach the sequence module enabling flow cell attachment, sequencing primer binding and barcoding, as we described before [34,66,67]. The barcoded sequencing libraries were pooled with equivalent amount and subjected to a multiple parallel sequence using Illumina HiSeq 2500 platform.
Species-specific reference sequences
Before identification of individual sequence reads, all sequences were processed to merge every pair of reads and to remove those with ambiguous nucleotide using the make.contigs command implemented in MOTHUR program [68]. Interspecific variations were initially inferred from the NCBI database used to construct temporary reference database (TEMP_REF) for BLAST analysis for the amplicon sequences derived from pure mouse and rat samples. The resulting alignment information was parsed using a series of Strawberry Perl (version 5.12.3.0) scripts. Reads that matched a reference sequence were collected and used to make consensus sequences. At each aligned position, sequences exhibiting at least 25% of total reads were retained. For each amplicon, consensus sequences form two species were compared and discard the amplicon if any consensus sequence of one species is identical to any of the other. A new BLAST reference database (ISV_REF) was created using the retained consensus sequences to consist of amplicon sequences with real ISVs.
Quantitative analysis
The identity of all amplicon sequences from spike-in samples were determined by aligning them to ISV_REF reference database using BLAST. The read that matches to any of reference sequences with 100% sequence identity and a coverage of 90% were assigned to the reference sequence and counted. For each amplicon target, numbers of reads derived from the mouse mRNA and the rat genome were counted and their ratio was calculated. Deviations in the fractional quantities of amplicons from original values in the sample were corrected as previously reported [34]. The relative abundance of mouse to rat amplicon sequences (RAM/R) were then determined and normalized by dividing them with average relative abundance of all amplicons.
RT PCR
Total RNA was prepared using RNeasy Plus Mini Kit (QIAGEN) according to the manufacturer’s instructions, and cDNA was synthesized using Superscript III (Invitrogen). Primers used in PRG detection were as followings: 5’-ATAGTGGAAATGGCCCACCA-3’ and 5’-GGAGCTGACGGGAGATGAC-3’ for Pax7, 5’-ACCTTCTGGACAAGGACGTG-3’ and 5’-AGTGGCGCACGGAGCTA-3’ for Cdx2, 5’-TGGTCTTCACAGACGTCCAA-3’ and 5’-TTGGACGGACGCTTATTTTC-3’ for Onecut1, 5’-ATGGCCATGTACACGTTCTG-3’ and 5’-CTAGCGATATTTACAACGAA-3’ for Nkx2.2, 5’-AGTGTGAGTTCGAGGGCTGT-3’ and 5’-TGCATGTGCTTCTTCCTGTC-3’ for Zic2, and 5’-TCCACTCGTTCAGGAGGAAC-3’ and 5’-TGCTGTTATCCCCACTGTGT-3’ for Meis1. In order to detect mouse endogenous Htt expression, we used primers 5’-AGAGCCCCATTCATTGCC-3’ and 5’-TTCTTTGGTCGGTGCAGC-3 for Htt (1) and 5’-ACCCTGGAAAAGCTGATGA-3’ and 5’- TTCTTTGGTCGGTGCAGC-3’ for Htt (2). To detect human mutant HTT (mHTT) we used primers 5’-CCGCTCAGGTTCTGCTTTTA-3’ and 5’-TGGAAGGACTTGAGGGACTC-3’. PCR products were resolved on automatic electrophoresis machine (MultiNA, SHIMADZU). Dnmt1 transcript level was measured with TOPreal™ qPCR 2x Premix (Enzynomics) using QuantStudio3 Real-Time PCR System (Applied Biosystems). Primers used for detection of Dnmt1 transcript were 5’-CCACAGTGTTCACAGAGGA-3’ and 5’-CACACAGCATCTCCACATC-3’ [69].
DNase-seq library generation
Five HD and six WT mice, aged fifteen to sixteen months, were sacrificed, and their spleens were removed for the isolation of mononuclear cells. Each spleen was ground, and cells were collected in cold DPBS (Gibco). Mononuclear cells (MCs) were isolated using Lymphoprep (STEMCELL) according to the manufacturer’s protocol. After brief washing, number of isolated MCs were counted and aliquoted for the DNase I treatment. From 1x10⁷ HD or WT splenic MCs, nuclei were extracted using NE-PER Nuclear and Cytoplasmic Extraction Reagents (Thermo) according to the manufacturer’s instruction, and the nuclei were digested with 5 units of DNase I (Takara) at 20 °C for 4 minutes. 100 μl Stop buffer (50 mM Tris-Cl, pH 8.0, 100 mM NaCl, 0.1% SDS, 100 mM EDTA, pH 8.0) was added to deactivate DNase I. The mixture was incubated with 2 μl RNase A (100 mg/ml, Thermo) at 55 °C for 10 minutes followed by 4 μl Proteinase K (10 mg/ml) for 2 hours to free the DNAs from proteins. DNAs were purified using phenol/chloroform and ethanol precipitation methods, and 50 ~ 100 bp DNA fragments were size-selected for Illumina NGS library preparation. The size selected DNA fragments were used for Illumina NGS libraries using TruSeq DNA Sample Prep Kit (Illumina) according to the manufacturer’s instruction. The resulting NGS libraries were sequenced by HiSeq2000 (Illumina).
DNase-seq data analysis
Raw sequencing reads were pre-processed to removed unwanted bases, and the resulting reads were mapped on a mouse reference genome (mm10) using ‘bowtie2’ [70] with default options. Mapping efficiency was assessed by visualizing the mapped reads on IGV. To calculate read density around TSS and draw heatmaps, ‘deepTools’ [71] was used. All other plots were generated by in-house R scripts.
Supplementary Materials
Acknowledgments
This work was supported by grants from the National Research Foundation of Korea (015R1A2A2A01003117), National Research Foundation-Science Research Center program (2011-0030049), KIOM program (K16130), and KRIBB Program.
Conflicts of Interest
The authors declare no conflicts of interests.
References
- 1. Hoogeveen AT, Willemsen R, Meyer N, de Rooij KE, Roos RA, van Ommen GJ, Galjaard H. Characterization and localization of the Huntington disease gene product. Hum Mol Genet. 1993; 2:2069–73. https://doi.org/10.1093/hmg/2.12.2069 [PubMed]
- 2. Li SH, Schilling G, Young WS
3rd , Li XJ, Margolis RL, Stine OC, Wagster MV, Abbott MH, Franz ML, Ranen NG, Folstein SE, Hedreen JC, Ross CA. Huntington’s disease gene (IT15) is widely expressed in human and rat tissues. Neuron. 1993; 11:985–93. https://doi.org/10.1016/0896-6273(93)90127-D [PubMed] - 3. Marques Sousa C, Humbert S. Huntingtin: here, there, everywhere!. J Huntingtons Dis. 2013; 2:395–403. [PubMed]
- 4. Trottier Y, Devys D, Imbert G, Saudou F, An I, Lutz Y, Weber C, Agid Y, Hirsch EC, Mandel JL. Cellular localization of the Huntington’s disease protein and discrimination of the normal and mutated form. Nat Genet. 1995; 10:104–10. https://doi.org/10.1038/ng0595-104 [PubMed]
- 5. van der Burg JM, Björkqvist M, Brundin P. Beyond the brain: widespread pathology in Huntington’s disease. Lancet Neurol. 2009; 8:765–74. https://doi.org/10.1016/S1474-4422(09)70178-4 [PubMed]
- 6. Borovecki F, Lovrecic L, Zhou J, Jeong H, Then F, Rosas HD, Hersch SM, Hogarth P, Bouzou B, Jensen RV, Krainc D. Genome-wide expression profiling of human blood reveals biomarkers for Huntington’s disease. Proc Natl Acad Sci USA. 2005; 102:11023–28. https://doi.org/10.1073/pnas.0504921102 [PubMed]
- 7. Anderson AN, Roncaroli F, Hodges A, Deprez M, Turkheimer FE. Chromosomal profiles of gene expression in Huntington’s disease. Brain. 2008; 131:381–88. https://doi.org/10.1093/brain/awm312 [PubMed]
- 8. Maglione V, Cannella M, Gradini R, Cislaghi G, Squitieri F. Huntingtin fragmentation and increased caspase 3, 8 and 9 activities in lymphoblasts with heterozygous and homozygous Huntington’s disease mutation. Mech Ageing Dev. 2006; 127:213–16. https://doi.org/10.1016/j.mad.2005.09.011 [PubMed]
- 9. Panov AV, Gutekunst CA, Leavitt BR, Hayden MR, Burke JR, Strittmatter WJ, Greenamyre JT. Early mitochondrial calcium defects in Huntington’s disease are a direct effect of polyglutamines. Nat Neurosci. 2002; 5:731–36. [PubMed]
- 10. Sawa A, Wiegand GW, Cooper J, Margolis RL, Sharp AH, Lawler JF
Jr , Greenamyre JT, Snyder SH, Ross CA. Increased apoptosis of Huntington disease lymphoblasts associated with repeat length-dependent mitochondrial depolarization. Nat Med. 1999; 5:1194–98. https://doi.org/10.1038/13518 [PubMed] - 11. Björkqvist M, Wild EJ, Thiele J, Silvestroni A, Andre R, Lahiri N, Raibon E, Lee RV, Benn CL, Soulet D, Magnusson A, Woodman B, Landles C, et al. A novel pathogenic pathway of immune activation detectable before clinical onset in Huntington’s disease. J Exp Med. 2008; 205:1869–77. https://doi.org/10.1084/jem.20080178 [PubMed]
- 12. Wild E, Magnusson A, Lahiri N, Krus U, Orth M, Tabrizi SJ, Björkqvist M. Abnormal peripheral chemokine profile in Huntington’s disease. PLoS Curr. 2011; 3:RRN1231. https://doi.org/10.1371/currents.RRN1231 [PubMed]
- 13. Träger U, Andre R, Lahiri N, Magnusson-Lind A, Weiss A, Grueninger S, McKinnon C, Sirinathsinghji E, Kahlon S, Pfister EL, Moser R, Hummerich H, Antoniou M, et al. HTT-lowering reverses Huntington’s disease immune dysfunction caused by NFκB pathway dysregulation. Brain. 2014; 137:819–33. https://doi.org/10.1093/brain/awt355 [PubMed]
- 14. Kwan W, Träger U, Davalos D, Chou A, Bouchard J, Andre R, Miller A, Weiss A, Giorgini F, Cheah C, Möller T, Stella N, Akassoglou K, et al. Mutant huntingtin impairs immune cell migration in Huntington disease. J Clin Invest. 2012; 122:4737–47. https://doi.org/10.1172/JCI64484 [PubMed]
- 15. Träger U, Andre R, Magnusson-Lind A, Miller JR, Connolly C, Weiss A, Grueninger S, Silajdžić E, Smith DL, Leavitt BR, Bates GP, Björkqvist M, Tabrizi SJ. Characterisation of immune cell function in fragment and full-length Huntington’s disease mouse models. Neurobiol Dis. 2015; 73:388–98. https://doi.org/10.1016/j.nbd.2014.10.012 [PubMed]
- 16. Weiss A, Träger U, Wild EJ, Grueninger S, Farmer R, Landles C, Scahill RI, Lahiri N, Haider S, Macdonald D, Frost C, Bates GP, Bilbe G, et al. Mutant huntingtin fragmentation in immune cells tracks Huntington’s disease progression. J Clin Invest. 2012; 122:3731–36. https://doi.org/10.1172/JCI64565 [PubMed]
- 17. Steffan JS, Kazantsev A, Spasic-Boskovic O, Greenwald M, Zhu YZ, Gohler H, Wanker EE, Bates GP, Housman DE, Thompson LM. The Huntington’s disease protein interacts with p53 and CREB-binding protein and represses transcription. Proc Natl Acad Sci USA. 2000; 97:6763–68. https://doi.org/10.1073/pnas.100110097 [PubMed]
- 18. Takano H, Gusella JF. The predominantly HEAT-like motif structure of huntingtin and its association and coincident nuclear entry with dorsal, an NF-kB/Rel/dorsal family transcription factor. BMC Neurosci. 2002; 3:15. https://doi.org/10.1186/1471-2202-3-15 [PubMed]
- 19. Marcora E, Gowan K, Lee JE. Stimulation of NeuroD activity by huntingtin and huntingtin-associated proteins HAP1 and MLK2. Proc Natl Acad Sci USA. 2003; 100:9578–83. https://doi.org/10.1073/pnas.1133382100 [PubMed]
- 20. Dunah AW, Jeong H, Griffin A, Kim YM, Standaert DG, Hersch SM, Mouradian MM, Young AB, Tanese N, Krainc D. Sp1 and TAFII130 transcriptional activity disrupted in early Huntington’s disease. Science. 2002; 296:2238–43. https://doi.org/10.1126/science.1072613 [PubMed]
- 21. Holbert S, Denghien I, Kiechle T, Rosenblatt A, Wellington C, Hayden MR, Margolis RL, Ross CA, Dausset J, Ferrante RJ, Néri C. The Gln-Ala repeat transcriptional activator CA150 interacts with huntingtin: neuropathologic and genetic evidence for a role in Huntington’s disease pathogenesis. Proc Natl Acad Sci USA. 2001; 98:1811–16. https://doi.org/10.1073/pnas.98.4.1811 [PubMed]
- 22. Yohrling GJ
4th , Farrell LA, Hollenberg AN, Cha JH. Mutant huntingtin increases nuclear corepressor function and enhances ligand-dependent nuclear hormone receptor activation. Mol Cell Neurosci. 2003; 23:28–38. https://doi.org/10.1016/S1044-7431(03)00032-0 [PubMed] - 23. Kegel KB, Meloni AR, Yi Y, Kim YJ, Doyle E, Cuiffo BG, Sapp E, Wang Y, Qin ZH, Chen JD, Nevins JR, Aronin N, DiFiglia M. Huntingtin is present in the nucleus, interacts with the transcriptional corepressor C-terminal binding protein, and represses transcription. J Biol Chem. 2002; 277:7466–76. https://doi.org/10.1074/jbc.M103946200 [PubMed]
- 24. Zuccato C, Tartari M, Crotti A, Goffredo D, Valenza M, Conti L, Cataudella T, Leavitt BR, Hayden MR, Timmusk T, Rigamonti D, Cattaneo E. Huntingtin interacts with REST/NRSF to modulate the transcription of NRSE-controlled neuronal genes. Nat Genet. 2003; 35:76–83. https://doi.org/10.1038/ng1219 [PubMed]
- 25. Luthi-Carter R, Strand A, Peters NL, Solano SM, Hollingsworth ZR, Menon AS, Frey AS, Spektor BS, Penney EB, Schilling G, Ross CA, Borchelt DR, Tapscott SJ, et al. Decreased expression of striatal signaling genes in a mouse model of Huntington’s disease. Hum Mol Genet. 2000; 9:1259–71. https://doi.org/10.1093/hmg/9.9.1259 [PubMed]
- 26. Luthi-Carter R, Hanson SA, Strand AD, Bergstrom DA, Chun W, Peters NL, Woods AM, Chan EY, Kooperberg C, Krainc D, Young AB, Tapscott SJ, Olson JM. Dysregulation of gene expression in the R6/2 model of polyglutamine disease: parallel changes in muscle and brain. Hum Mol Genet. 2002; 11:1911–26. https://doi.org/10.1093/hmg/11.17.1911 [PubMed]
- 27. Kumar A, Zhang J, Tallaksen-Greene S, Crowley MR, Crossman DK, Morton AJ, Van Groen T, Kadish I, Albin RL, Lesort M, Detloff PJ. Allelic series of Huntington’s disease knock-in mice reveals expression discorrelates. Hum Mol Genet. 2016; 25:1619–36. https://doi.org/10.1093/hmg/ddw040 [PubMed]
- 28. Langfelder P, Cantle JP, Chatzopoulou D, Wang N, Gao F, Al-Ramahi I, Lu XH, Ramos EM, El-Zein K, Zhao Y, Deverasetty S, Tebbe A, Schaab C, et al. Integrated genomics and proteomics define huntingtin CAG length-dependent networks in mice. Nat Neurosci. 2016; 19:623–33. https://doi.org/10.1038/nn.4256 [PubMed]
- 29. Mastrokolias A, Ariyurek Y, Goeman JJ, van Duijn E, Roos RA, van der Mast RC, van Ommen GB, den Dunnen JT, ’t Hoen PA, van Roon-Mom WM. Huntington’s disease biomarker progression profile identified by transcriptome sequencing in peripheral blood. Eur J Hum Genet. 2015; 23:1349–56. https://doi.org/10.1038/ejhg.2014.281 [PubMed]
- 30. Hu Y, Chopra V, Chopra R, Locascio JJ, Liao Z, Ding H, Zheng B, Matson WR, Ferrante RJ, Rosas HD, Hersch SM, Scherzer CR. Transcriptional modulator H2A histone family, member Y (H2AFY) marks Huntington disease activity in man and mouse. Proc Natl Acad Sci USA. 2011; 108:17141–46. https://doi.org/10.1073/pnas.1104409108 [PubMed]
- 31. Runne H, Kuhn A, Wild EJ, Pratyaksha W, Kristiansen M, Isaacs JD, Régulier E, Delorenzi M, Tabrizi SJ, Luthi-Carter R. Analysis of potential transcriptomic biomarkers for Huntington’s disease in peripheral blood. Proc Natl Acad Sci USA. 2007; 104:14424–29. https://doi.org/10.1073/pnas.0703652104 [PubMed]
- 32. Valor LM, Guiretti D. What’s wrong with epigenetics in Huntington’s disease? Neuropharmacology. 2014; 80:103–14. https://doi.org/10.1016/j.neuropharm.2013.10.025 [PubMed]
- 33. Jakovcevski M, Akbarian S. Epigenetic mechanisms in neurological disease. Nat Med. 2012; 18:1194–204. https://doi.org/10.1038/nm.2828 [PubMed]
- 34. Oh SA, Yang I, Hahn Y, Kang YK, Chung SK, Jeong S. SiNG-PCRseq: accurate inter-sequence quantification achieved by spiking-in a neighbor genome for competitive PCR amplicon sequencing. Sci Rep. 2015; 5:11879. https://doi.org/10.1038/srep11879 [PubMed]
- 35. Bracken AP, Kleine-Kohlbrecher D, Dietrich N, Pasini D, Gargiulo G, Beekman C, Theilgaard-Mönch K, Minucci S, Porse BT, Marine JC, Hansen KH, Helin K. The Polycomb group proteins bind throughout the INK4A-ARF locus and are disassociated in senescent cells. Genes Dev. 2007; 21:525–30. https://doi.org/10.1101/gad.415507 [PubMed]
- 36. Sen P, Shah PP, Nativio R, Berger SL. Epigenetic mechanisms of longevity and aging. Cell. 2016; 166:822–39. https://doi.org/10.1016/j.cell.2016.07.050 [PubMed]
- 37. Seong IS, Woda JM, Song JJ, Lloret A, Abeyrathne PD, Woo CJ, Gregory G, Lee JM, Wheeler VC, Walz T, Kingston RE, Gusella JF, Conlon RA, MacDonald ME. Huntingtin facilitates polycomb repressive complex 2. Hum Mol Genet. 2010; 19:573–83. https://doi.org/10.1093/hmg/ddp524 [PubMed]
- 38. Kang YK. SETDB1 in early embryos and embryonic stem cells. Curr Issues Mol Biol. 2015; 17:1–10. [PubMed]
- 39. Cho S, Park JS, Kang YK. AGO2 and SETDB1 cooperate in promoter-targeted transcriptional silencing of the androgen receptor gene. Nucleic Acids Res. 2014; 42:13545–56. https://doi.org/10.1093/nar/gku788 [PubMed]
- 40. He HH, Meyer CA, Hu SS, Chen MW, Zang C, Liu Y, Rao PK, Fei T, Xu H, Long H, Liu XS, Brown M. Refined DNase-seq protocol and data analysis reveals intrinsic bias in transcription factor footprint identification. Nat Methods. 2014; 11:73–78. https://doi.org/10.1038/nmeth.2762 [PubMed]
- 41. Zampieri M, Ciccarone F, Calabrese R, Franceschi C, Bürkle A, Caiafa P. Reconfiguration of DNA methylation in aging. Mech Ageing Dev. 2015; 151:60–70. https://doi.org/10.1016/j.mad.2015.02.002 [PubMed]
- 42. Teschendorff AE, West J, Beck S. Age-associated epigenetic drift: implications, and a case of epigenetic thrift? Hum Mol Genet. 2013; 22:R7–15. https://doi.org/10.1093/hmg/ddt375 [PubMed]
- 43. Han S, Brunet A. Histone methylation makes its mark on longevity. Trends Cell Biol. 2012; 22:42–49. https://doi.org/10.1016/j.tcb.2011.11.001 [PubMed]
- 44. Greer EL, Maures TJ, Hauswirth AG, Green EM, Leeman DS, Maro GS, Han S, Banko MR, Gozani O, Brunet A. Members of the H3K4 trimethylation complex regulate lifespan in a germline-dependent manner in C. elegans. Nature. 2010; 466:383–87. https://doi.org/10.1038/nature09195 [PubMed]
- 45. Jin C, Li J, Green CD, Yu X, Tang X, Han D, Xian B, Wang D, Huang X, Cao X, Yan Z, Hou L, Liu J, et al. Histone demethylase UTX-1 regulates C. elegans life span by targeting the insulin/IGF-1 signaling pathway. Cell Metab. 2011; 14:161–72. https://doi.org/10.1016/j.cmet.2011.07.001 [PubMed]
- 46. Maures TJ, Greer EL, Hauswirth AG, Brunet A. The H3K27 demethylase UTX-1 regulates C. elegans lifespan in a germline-independent, insulin-dependent manner. Aging Cell. 2011; 10:980–90. https://doi.org/10.1111/j.1474-9726.2011.00738.x [PubMed]
- 47. Booth LN, Brunet A. The Aging Epigenome. Mol Cell. 2016; 62:728–44. https://doi.org/10.1016/j.molcel.2016.05.013 [PubMed]
- 48. Scaffidi P, Misteli T. Lamin A-dependent nuclear defects in human aging. Science. 2006; 312:1059–63. https://doi.org/10.1126/science.1127168 [PubMed]
- 49. Scaffidi P, Misteli T. Reversal of the cellular phenotype in the premature aging disease Hutchinson-Gilford progeria syndrome. Nat Med. 2005; 11:440–45. https://doi.org/10.1038/nm1204 [PubMed]
- 50. Kheradmand Kia S, Solaimani Kartalaei P, Farahbakhshian E, Pourfarzad F, von Lindern M, Verrijzer CP. EZH2-dependent chromatin looping controls INK4a and INK4b, but not ARF, during human progenitor cell differentiation and cellular senescence. Epigenetics Chromatin. 2009; 2:16. https://doi.org/10.1186/1756-8935-2-16 [PubMed]
- 51. Fan T, Jiang S, Chung N, Alikhan A, Ni C, Lee CC, Hornyak TJ. EZH2-dependent suppression of a cellular senescence phenotype in melanoma cells by inhibition of p21/CDKN1A expression. Mol Cancer Res. 2011; 9:418–29. https://doi.org/10.1158/1541-7786.MCR-10-0511 [PubMed]
- 52. Zhang J, Lian Q, Zhu G, Zhou F, Sui L, Tan C, Mutalif RA, Navasankari R, Zhang Y, Tse HF, Stewart CL, Colman A. A human iPSC model of Hutchinson Gilford Progeria reveals vascular smooth muscle and mesenchymal stem cell defects. Cell Stem Cell. 2011; 8:31–45. https://doi.org/10.1016/j.stem.2010.12.002 [PubMed]
- 53. Liu GH, Barkho BZ, Ruiz S, Diep D, Qu J, Yang SL, Panopoulos AD, Suzuki K, Kurian L, Walsh C, Thompson J, Boue S, Fung HL, et al. Recapitulation of premature ageing with iPSCs from Hutchinson-Gilford progeria syndrome. Nature. 2011; 472:221–25. https://doi.org/10.1038/nature09879 [PubMed]
- 54. Steffan JS, Bodai L, Pallos J, Poelman M, McCampbell A, Apostol BL, Kazantsev A, Schmidt E, Zhu YZ, Greenwald M, Kurokawa R, Housman DE, Jackson GR, et al. Histone deacetylase inhibitors arrest polyglutamine-dependent neurodegeneration in Drosophila. Nature. 2001; 413:739–43. https://doi.org/10.1038/35099568 [PubMed]
- 55. McCampbell A, Taylor JP, Taye AA, Robitschek J, Li M, Walcott J, Merry D, Chai Y, Paulson H, Sobue G, Fischbeck KH. CREB-binding protein sequestration by expanded polyglutamine. Hum Mol Genet. 2000; 9:2197–202. https://doi.org/10.1093/hmg/9.14.2197 [PubMed]
- 56. Ferrante RJ, Ryu H, Kubilus JK, D’Mello S, Sugars KL, Lee J, Lu P, Smith K, Browne S, Beal MF, Kristal BS, Stavrovskaya IG, Hewett S, et al. Chemotherapy for the brain: the antitumor antibiotic mithramycin prolongs survival in a mouse model of Huntington’s disease. J Neurosci. 2004; 24:10335–42. https://doi.org/10.1523/JNEUROSCI.2599-04.2004 [PubMed]
- 57. Sadri-Vakili G, Bouzou B, Benn CL, Kim MO, Chawla P, Overland RP, Glajch KE, Xia E, Qiu Z, Hersch SM, Clark TW, Yohrling GJ, Cha JH. Histones associated with downregulated genes are hypo-acetylated in Huntington’s disease models. Hum Mol Genet. 2007; 16:1293–306. https://doi.org/10.1093/hmg/ddm078 [PubMed]
- 58. McFarland KN, Das S, Sun TT, Leyfer D, Xia E, Sangrey GR, Kuhn A, Luthi-Carter R, Clark TW, Sadri-Vakili G, Cha JH. Genome-wide histone acetylation is altered in a transgenic mouse model of Huntington’s disease. PLoS One. 2012; 7:e41423. https://doi.org/10.1371/journal.pone.0041423 [PubMed]
- 59. Gardian G, Browne SE, Choi DK, Klivenyi P, Gregorio J, Kubilus JK, Ryu H, Langley B, Ratan RR, Ferrante RJ, Beal MF. Neuroprotective effects of phenylbutyrate in the N171-82Q transgenic mouse model of Huntington’s disease. J Biol Chem. 2005; 280:556–63. https://doi.org/10.1074/jbc.M410210200 [PubMed]
- 60. Ryu H, Lee J, Hagerty SW, Soh BY, McAlpin SE, Cormier KA, Smith KM, Ferrante RJ. ESET/SETDB1 gene expression and histone H3 (K9) trimethylation in Huntington’s disease. Proc Natl Acad Sci USA. 2006; 103:19176–81. https://doi.org/10.1073/pnas.0606373103 [PubMed]
- 61. Sadri-Vakili G, Cha JH. Mechanisms of disease: histone modifications in Huntington’s disease. Nat Clin Pract Neurol. 2006; 2:330–38. https://doi.org/10.1038/ncpneuro0199 [PubMed]
- 62. Hughes RE, Lo RS, Davis C, Strand AD, Neal CL, Olson JM, Fields S. Altered transcription in yeast expressing expanded polyglutamine. Proc Natl Acad Sci USA. 2001; 98:13201–06. https://doi.org/10.1073/pnas.191498198 [PubMed]
- 63. Hockly E, Richon VM, Woodman B, Smith DL, Zhou X, Rosa E, Sathasivam K, Ghazi-Noori S, Mahal A, Lowden PA, Steffan JS, Marsh JL, Thompson LM, et al. Suberoylanilide hydroxamic acid, a histone deacetylase inhibitor, ameliorates motor deficits in a mouse model of Huntington’s disease. Proc Natl Acad Sci USA. 2003; 100:2041–46. https://doi.org/10.1073/pnas.0437870100 [PubMed]
- 64. Slow EJ, van Raamsdonk J, Rogers D, Coleman SH, Graham RK, Deng Y, Oh R, Bissada N, Hossain SM, Yang YZ, Li XJ, Simpson EM, Gutekunst CA, et al. Selective striatal neuronal loss in a YAC128 mouse model of Huntington disease. Hum Mol Genet. 2003; 12:1555–67. https://doi.org/10.1093/hmg/ddg169 [PubMed]
- 65. Untergasser A, Cutcutache I, Koressaar T, Ye J, Faircloth BC, Remm M, Rozen SG. Primer3--new capabilities and interfaces. Nucleic Acids Res. 2012; 40:e115. https://doi.org/10.1093/nar/gks596 [PubMed]
- 66. Min B, Cho S, Park JS, Jeon K, Kang YK. The HIST1 locus escapes reprogramming in cloned bovine embryos. G3 (Bethesda). 2016; 6:1365–71. https://doi.org/10.1534/g3.115.026666 [PubMed]
- 67. Min B, Cho S, Park JS, Lee YG, Kim N, Kang YK. Transcriptomic features of bovine blastocysts derived by somatic cell nuclear transfer. G3 (Bethesda). 2015; 5:2527–38. https://doi.org/10.1534/g3.115.020016 [PubMed]
- 68. Schloss PD, Westcott SL, Ryabin T, Hall JR, Hartmann M, Hollister EB, Lesniewski RA, Oakley BB, Parks DH, Robinson CJ, Sahl JW, Stres B, Thallinger GG, et al. Introducing mothur: open-source, platform-independent, community-supported software for describing and comparing microbial communities. Appl Environ Microbiol. 2009; 75:7537–41. https://doi.org/10.1128/AEM.01541-09 [PubMed]
- 69. Jeong YS, Oh KB, Park JS, Kim JS, Kang YK. Cytoplasmic localization of oocyte-specific variant of porcine DNA methyltransferase-1 during early development. Dev Dyn. 2009; 238:1666–73. https://doi.org/10.1002/dvdy.21975 [PubMed]
- 70. Langdon WB. Performance of genetic programming optimised Bowtie2 on genome comparison and analytic testing (GCAT) benchmarks. BioData Min. 2015; 8:1. https://doi.org/10.1186/s13040-014-0034-0 [PubMed]
- 71. Ramírez F, Dündar F, Diehl S, Grüning BA, Manke T. deepTools: a flexible platform for exploring deep-sequencing data. Nucleic Acids Res. 2014; 42:W187-91. https://doi.org/10.1093/nar/gku365 [PubMed]