


Introduction
Several hallmarks of aging are related to autophagy, which is a mechanism protecting from chronic organ degeneration and prolonging life span by contributing to proteostasis and mitochondrial homeostasis [1]. The process of autophagy regulates many aspects of metabolic homeostasis and stress response and involves the inclusion of cellular components into vesicles called autophagosomes, which then fuse to the lysosome, the principle organelle for bulk degradation in eukaryotic cells. Autophagic flux decreases with age in many organs [2], whereas its upregulation is involved in life span extension by mitochondrial stress-adaptation and caloric restriction [3]. Genetic restoration of autophagy improves liver function in aged rodents, and pharmacological stimulation of autophagy prolongs the life span of various model organisms [4,5].
Another prominent mechanism that affects the mammalian aging process is the circadian clock. It confers rhythmic gene expression to a large part of the genome, which leads to overt rhythmic changes in physiology and behaviour. In the centre of the mammalian circadian clock lies a negative feedback loop of Period (PER) and Cryptochrome (CRY) gene expression, which is activated by the transcription factors Aryl hydrocarbon receptor nuclear translocator-like (ARNTL/BMAL1) and Circadian locomotor output cycles kaput (CLOCK). All body clocks are under the control of a light-sensitive master oscillator in the suprachiasmatic nucleus (SCN) of the hypothalamus, and additionally receive input from a variety of metabolic signals informing on physiological parameters such as energy and redox levels or body temperature [6]. Circadian clock genes regulate several pathways involved in life span modulation and organ aging. These include DNA repair and antioxidative or xenobiotic defence systems [7,8]. Robust functionality of the molecular clockwork is linked to the cellular redox metabolism and declines with age in the master clock of the SCN [9]. Mouse models defective in specific clock genes have a shortened life span and exhibit features of accelerated organ aging [10]. In humans, disruption of circadian rhythmicity is associated with an earlier onset of metabolic and cardiovascular dysfunction. It is therefore evident that both autophagy and the circadian clock are crucial to counteract aging. However, if and how these mechanisms are connected in aged cells and if key regulators exist that coordinate the circadian clock and autophagy to promote longevity is an important unresolved question.
Results
Decreased autophagy levels in aged primary human skin fibroblasts
We chose to study the link between the circadian clock, autophagy and aging in dermal fibroblasts. Skin cells are subjected to actinic stress leading to protein oxidation and mitochondrial dysfunction, which are typically cleared by autophagy [11]. Moreover, mice that are challenged by UV irradiation at different times of the day display a varied multiplicity of sunburn apoptosis, erythema, and skin cancer [7]. First, we tested the hypothesis that changes of molecular oscillator functions might entail a decline of autophagy levels during the mammalian aging process. For this purpose an established cellular aging model was employed that consists of primary fibroblasts derived from surgical skin samples of human donors aged 20 – 67 years. Skin samples were obtained during female breast reduction surgeries ruling out tissue- or sex-specific effects in the analyses. Cells were analysed well below the replication limit to exclude possible influences of replicative senescence, which was demonstrated by comparable levels of β–galactosidase staining in cells from young and old donors with the same passage numbers (Fig. S1) and had been shown with various markers in previous studies [12,13]. The model has been demonstrated to display several features typically associated with skin ageing including altered protein secretion, altered hyaluronidase activity, altered gene expression, decreased proliferative capacity, decreased genome stability and impaired mitochondrial function [12–14]. Autophagic flux was measured by determining the levels of the lipidated form of Microtubule-associated protein 1 light chain 3 (LC3-II), a generally accepted marker for autophagosome formation [15]. LC3-II levels without treatment with the lysosome inhibitor Chloroquine were subtracted from LC3-II levels in the presence of Chloroquine to determine a value for autophagic flux [16]. Autophagic flux values correlated strongly to the age of the donors (Fig. 1A) whereby a difference between the highest value in a donor aged 21 years and the lowest value observed in a donor aged 67 years of more than 10-fold was observed, but a large scatter within biological samples of similar age indicated a marked impact of biological diversity on this parameter. Additionally, cellular LC3 levels measured by immunostaining (Fig. 1B-C) and, more importantly, the number of LC3B positive punctae revealing LC3B molecules engaged in the autophagy process (Fig. 1B and D) were reduced in cells from aged donors after lysosome inhibitor treatment. Thus, in human dermal fibroblasts, autophagy appears to decline with age in a similar fashion as in other human organs and cell types [2,17,18].
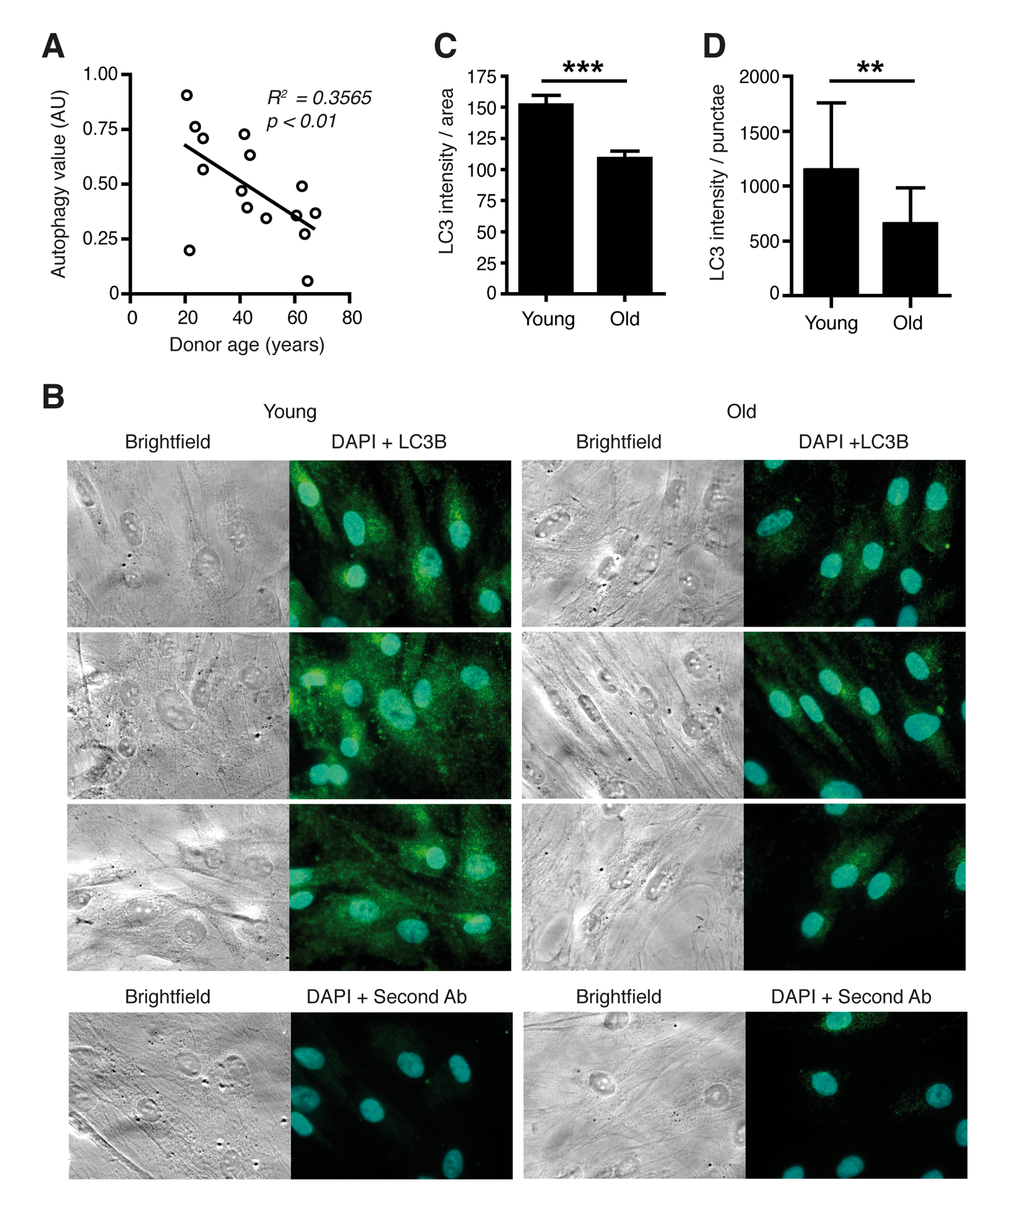
Figure 1. Autophagic flux is reduced in aged primary human fibroblasts. (A) Correlation of age and LC3-II protein levels in primary dermal human fibroblasts from differently aged donors. AU: artificial units. (B) Immunostaining of LC3B protein in cells from young and old donors after Bafilomycin treatment. In the bottom row cells stained only with secondary antibody (Cy3) and DAPI are shown. Total signal strength (C) and the number of LC3 positive punctae in a defined area (D) were quantified.
Clock gene expression, autophagy levels, and donor age are correlated in primary human skin fibroblasts
We then asked whether reduced autophagic flux in cells from old donors might be linked to a defective circadian oscillator. However, in both young and aged cells the circadian clock showed highly rhythmic behaviour as determined by mRNA expression of the endogenous BMAL1 and PER2 genes (Fig. 2A) and luciferase activity driven by the circadian BMAL1 promoter after lentivirus transduction (Fig. S2) [19,20], excluding a total loss of circadian regulation as a major detrimental factor in aged fibroblasts. Next, we addressed the possibility that expression changes of individual clock genes rather than breakdown of the oscillator as a whole might play a role in age-related changes of autophagy regulation. The determination of core clock gene expression levels in the same set of cells revealed a significant age-related deregulation of a subset of genes. In particular several genes of the negative and interconnecting limbs of the clock (PER1, PER2, CRY2, NR1D1) exhibited age-related down regulation at the mRNA level, while BMAL1, a member of the positive limb, was the only gene exhibiting an increase in expression in aged fibroblasts (Fig. 2B). Analogous to the changed mRNA levels, BMAL1 protein expression was increased and PER2 protein expression was decreased in primary fibroblasts from old donors (Fig. 2C). Moreover, a highly age-dependent linear relationship existed between autophagic flux as determined by LC3-II accumulation after lysosome inhibition and the mRNA expression levels of PER2 (Fig. 2D) and BMAL1 (Fig. S3A). In addition, mRNA expression of CRY2, PER1 and NR1D1 was similarly correlated to donor age and LC3-II levels (Fig. S3B-D), while no such correlation could be detected for the mRNA abundance of CRY1, RORA, CLOCK or DBP (Fig. S3E-H). Therefore the deregulation of individual clock genes rather than dysfunction of the molecular oscillator as a whole might contribute to the decline of autophagy in aged human fibroblasts.
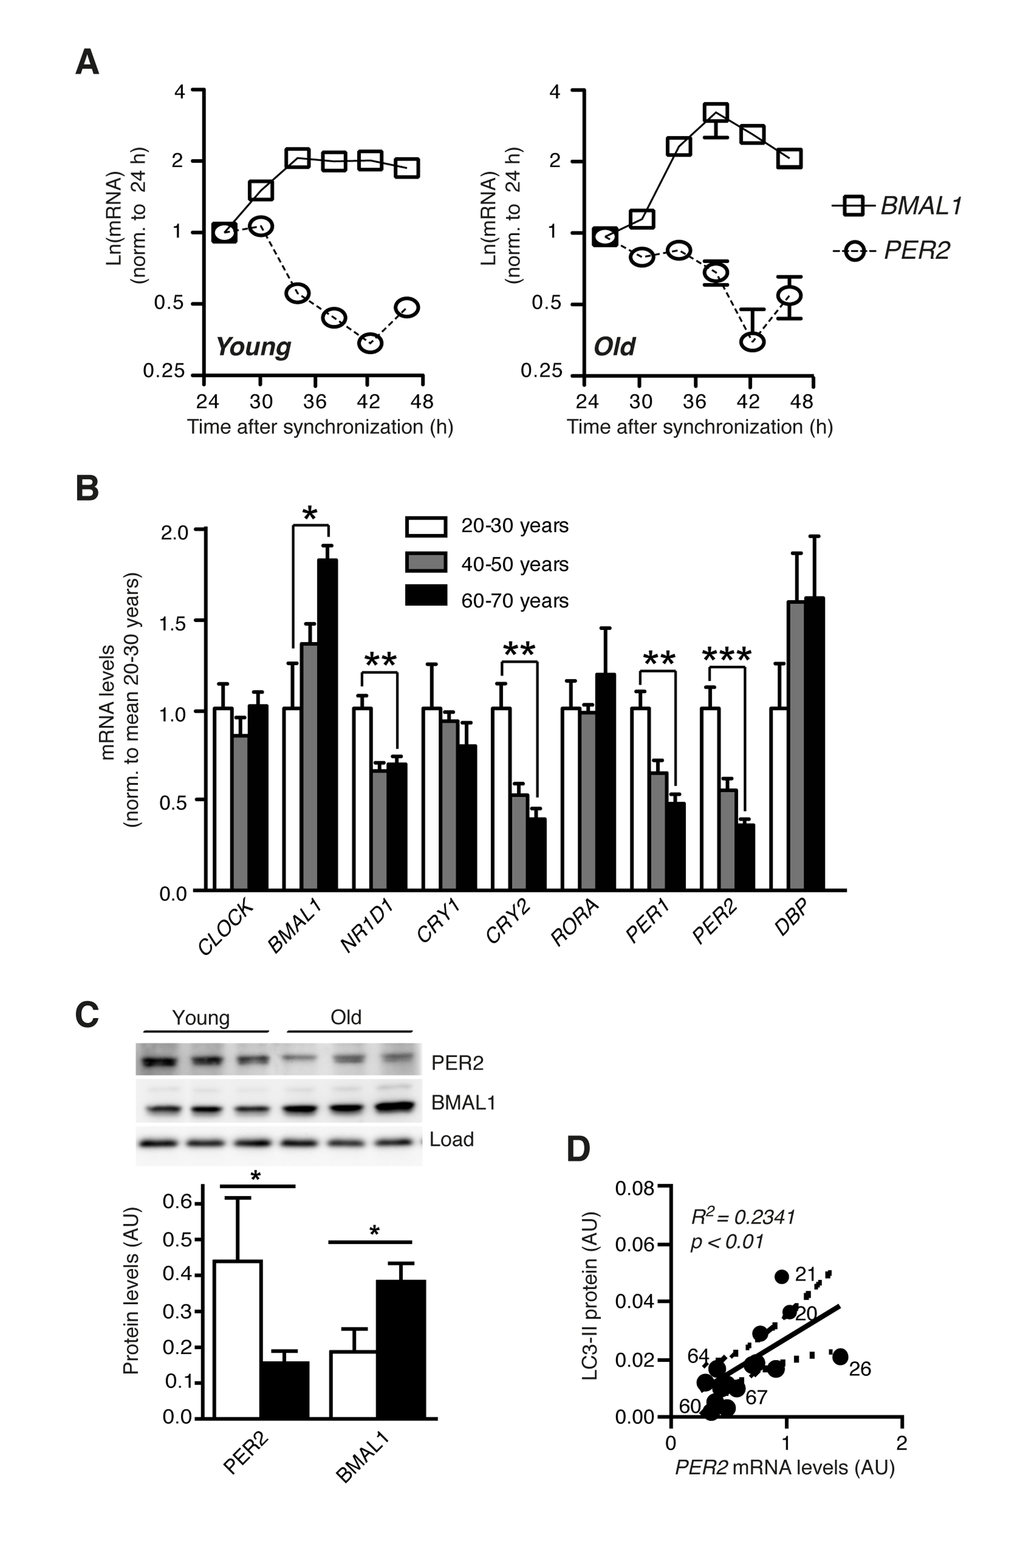
Figure 2. Clock gene expression is deregulated in aged primary human fibroblasts. (A) Circadian expression of Bmal1 mRNA (squares) and Per2 mRNA (circles) in primary human dermal fibroblasts from one young (age 21) and one old (age 67) donor of the cohort. (B) mRNA levels of core clock genes in cell lines from differently aged donors. Data obtained for age groups 20-30 years (white), 40-50 years (grey) and 60-70 years (black) are shown as mean ± SEM of five individual donors per age group. Data are normalised to the mean of age group 20-30 years. Asterisks indicate statistically significant differences between age groups 20-30 years and 60-70 years (unpaired t-test, two-tailed). (C) PER2 and BMAL1 protein levels in age groups 20-30 years (white) and 60-70 years (black). (D) Correlation of PER2 mRNA expression with LC3-II protein levels in the same cell lines. Solid and dashed lines indicate the linear regression curve and the 95% confidence band. Numbers next to data points show donor ages. Data are shown as mean values ± SEM, n=4.
In order to corroborate the finding that autophagic flux is correlated to the expression levels of individual core clock components we analysed autophagy in mouse cells deficient in both Cryptochromes Cry1 and Cry2. As expected, lack of Cry1 and Cry2 leads to the loss of rhythmic gene expression in synchronized fibroblasts (Fig. 3A) [21], but more importantly, it also results in increased levels of Per1, Per2 and Nr1d1 mRNA and decreased expression of Bmal1 mRNA (Fig. 3B). Therefore these cells present the opposite of aged human fibroblasts regarding the regulation of this subset of clock genes. Autophagic flux was significantly increased in Cry1/Cry2-deficient cells (Fig. 3C) and thus also in this respect presented the opposite of aged human fibroblasts, which showed a down-regulation of autophagic flux (Fig. 1). In summary, clock gene expression is correlated identically to autophagic flux in two highly different mammalian fibroblast cell lines.
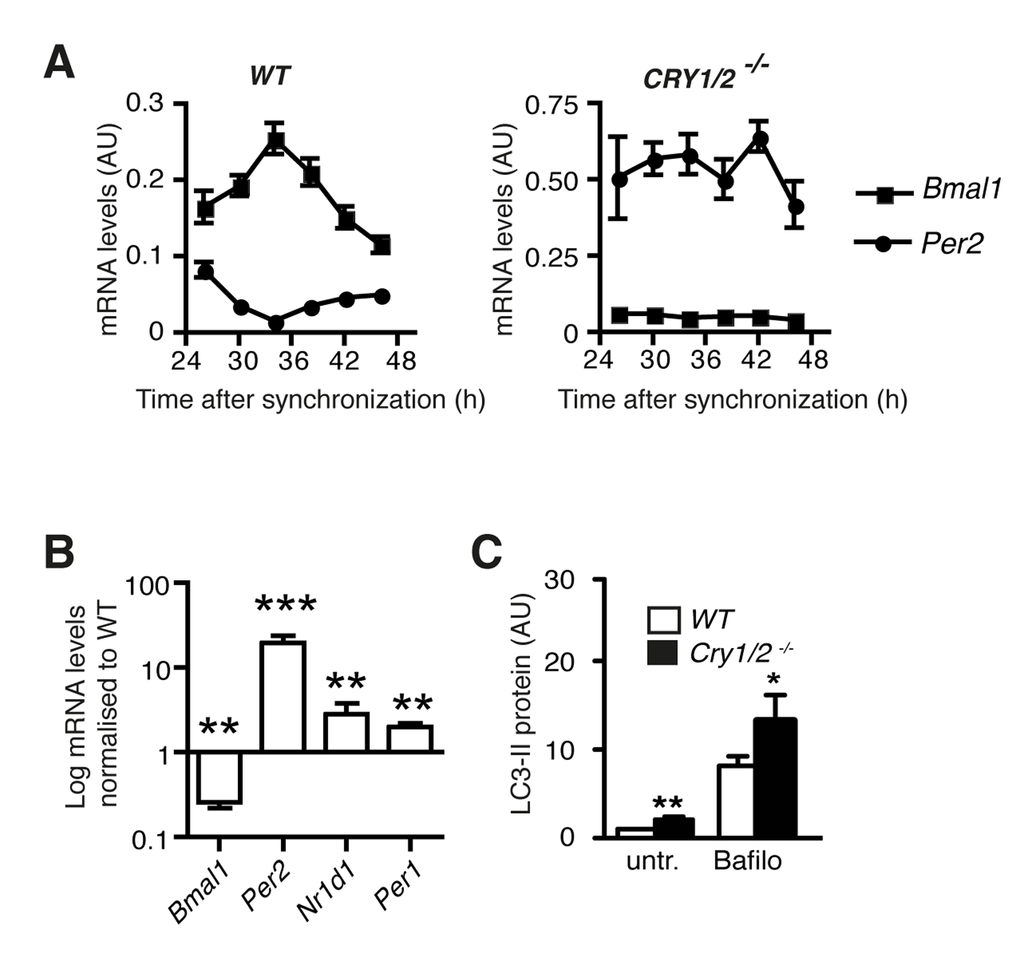
Figure 3. Autophagy in Cryptochrome-deficient MEFs. (A) Circadian accumulation of Bmal1 mRNA (squares) and Per2 mRNA (circles) in synchronised wild type and Cry1/2-/- MEFs. (B)Bmal1, Per2, Nr1d1 and Per1 mRNA levels in Cry1/2-/- MEFs normalised to the corresponding values in wild type MEFs. Data are shown as mean values ± SEM, n=8. (C) Autophagic flux in wild type MEFs (white) and Cry1/2-/- MEFs (black) determined by quantification of LC3-II protein levels in the absence or presence of bafilomycin (Bafilo).
The circadian clock drives cell-autonomous oscillations of autophagy levels in mammalian fibroblasts
These findings implied that the circadian clock might directly control autophagy levels in mammalian fibroblasts, and that autophagy levels might depend on clock gene expression levels. Circadian autophagy levels were analysed in a designated model system for circadian rhythmicity in cultured cells, namely murine NIH 3T3 cells, in which the cellular clock had been synchronized by dexamethasone treatment [22]. Autophagy was measured by quantification of LC3-II. Circadian oscillations were measured in the same cells as luciferase (Luc) activity driven by the circadian Bmal1 promoter from a stably integrated transgene [23]. Under these conditions rhythmic changes in LC3-II levels with a period length of around 24 hours were observed (Fig. 4A-B). A minimum of LC3-II levels at ∼38 h was followed by an increase and a maximum at ∼50 h. A long exposure of the LC3-II-Western blot revealed the slower migrating LC3-I band (Fig. S4A). Autophagic flux was also determined by measuring LC3-II accumulation after lysosome inhibition, which was likewise highly rhythmic in synchronized cells (Fig. 4A, lower panel). Circadian LC3-II accumulation was antiphasic to the expression of endogenous Bmal1 mRNA and in phase with Per2 mRNA expression (Fig. 4C). In support of this finding we observed rhythmic accumulation of the protein Unc-51 like autophagy activating kinase 1 (ULK1) (Fig. S4AB), which controls a rate-limiting step in autophagosome initiation [24]. In contrast, neither the mRNA expression of Ulk1 nor that of several other key autophagy genes such as Map1/Lc3b showed a circadian pattern (Fig. S14C-I). Importantly, genetic ablation of the cellular oscillator by siRNA-mediated knock down of BMAL1, which renders cells arrhythmic (Fig. 4D), abolished the circadian accumulation of LC3-II (Fig. 4E-F). From these results we concluded that the circadian clock drives cell-autonomous oscillations of autophagy levels in mammalian fibroblasts.
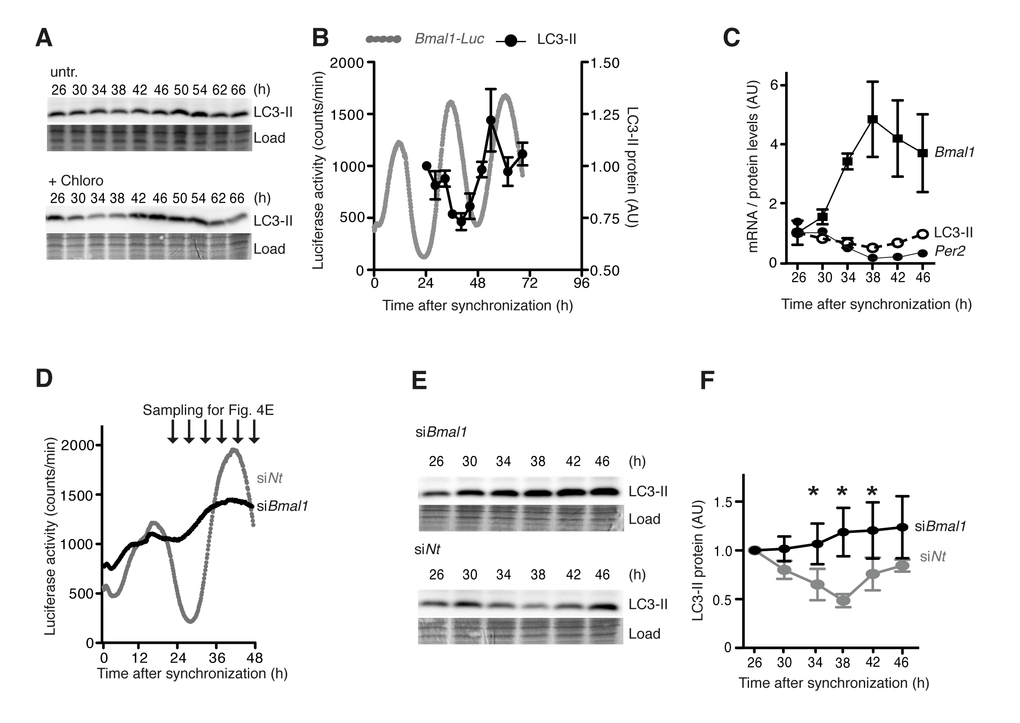
Figure 4. Cell-autonomous regulation of autophagy in mouse fibroblasts. (A) Western blots of LC3-II without (upper panel) or with (lower panel) the lysosome inhibitor Chloroquine in synchronised NIH 3T3 Bmal1-Luc fibroblasts. The time after Dexamethasone treatment is indicated on top. (B) Quantification of LC3-II protein levels (black) and Bmal1-Luc reporter gene activity (grey). (C) Levels of endogenous Bmal1 mRNA (squares), Per2 mRNA (closed circles) and LC3-II protein (open circles). Data are normalised to the respective mean value at 26 h. (D) Circadian luciferase activity in NIH 3T3 Bmal1-Luc fibroblasts after transfection with Bmal1-specific siRNA (black) or an equivalent dose of Non-target (Nt) siRNA (grey). (E) Expression of LC3-II protein at time points indicated in (D). (F) Quantification of LC3-II protein levels. Data are normalised to the mean value at 26 h. Asterisks designate statistically significant differences between siBmal1 and siNt (unpaired t-test, two-tailed). All data are shown as mean values ± SEM, n=4.
PER2 expression regulates autophagy levels
PER2 and BMAL1 were the most strongly deregulated genes in aged human fibroblasts (Fig. 2B). Therefore we asked whether these genes directly control autophagy levels. PER2 or BMAL1 were knocked down individually by siRNA-treatment in NIH 3T3 fibroblasts, and the effect on autophagy levels and autophagy gene expression was determined. Treatment with siRNA efficiently down regulated PER2 (Fig. 5A) and BMAL1 (Fig. 5B), but LC3-II levels were only reduced after knockdown of PER2 (Fig. 5C). Moreover, knockdown of PER2 altered autophagy levels while leaving core clock oscillations largely intact (Fig. S5A). This observation agrees with the findings in aged human cells (Fig. 2A-B).
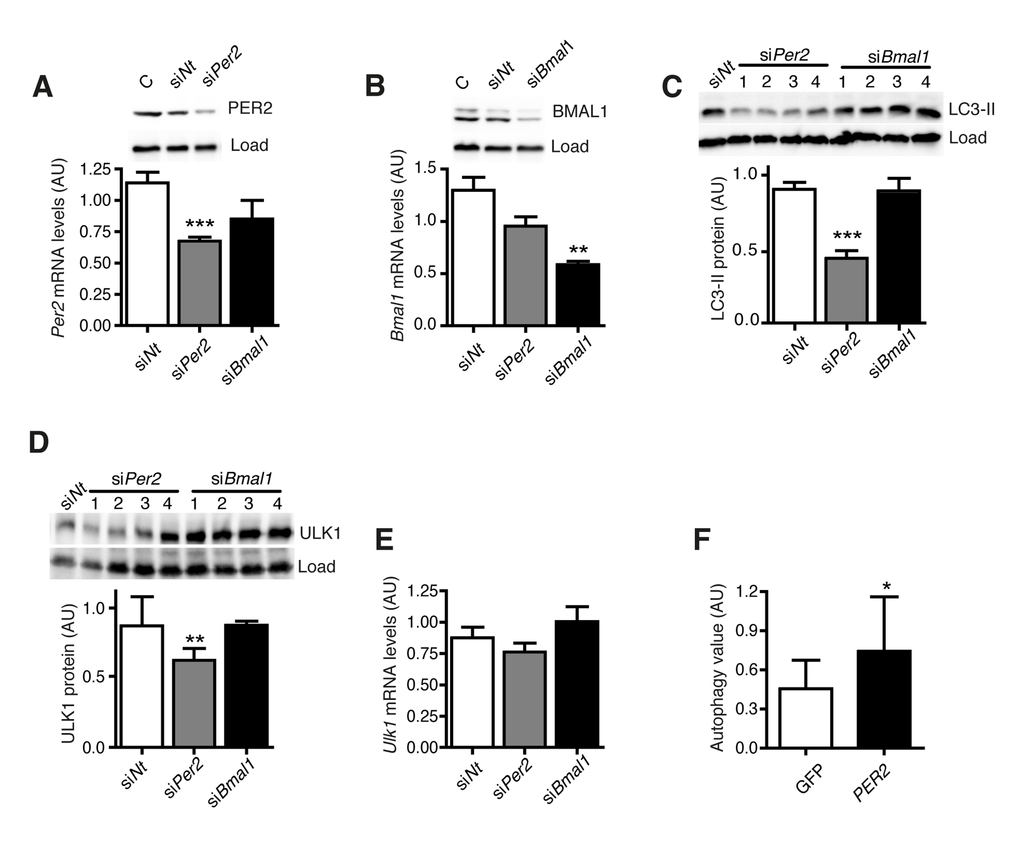
Figure 5. PER2 regulates autophagy. (A) Per2 mRNA and protein levels after transfection with Per2-or Bmal1-specific siRNA or an equivalent dose of non-target siRNA. C: untransfected control sample. (B)Bmal1 mRNA and protein levels. (C) LC3-II protein levels. (D) ULK1 protein levels. (E)Ulk1 mRNA levels. All data are shown as mean values ± SEM, n=4. Asterisks designate statistically significant differences of specific siRNA treatment versus control treatment with siNt (unpaired t-test, two-tailed). (F) Autophagy value (LC3-II in inhibitor treated cells – LC3-II in untreated cells) in two different cell lines from donors aged 60-70 years expressing only GFP (white) or PER2-GFP (black). Asterisks designate statistically significant differences of PER2-GFP versus GFP expression (unpaired t-test, two-tailed), n=3.
Knockdown of PER2 also reduced the cellular amount of ULK1 protein (Fig. 5D) while not affecting Ulk1 mRNA levels (Fig. 5E), which is in line with rhythmic ULK1 protein and non-rhythmic Ulk1 mRNA levels in these cells (Fig. S4B-C). Notably, in combination these findings put forward a mechanistic basis for the correlation between deregulated clock gene expression and decreased autophagy levels in aged human fibroblasts via PER2.
We then asked whether diminished autophagy levels in dermal fibroblasts from old human donors could be rescued by restoring core clock gene expression towards the levels observed in cells from young donors. PER2-GFP was transiently overexpressed in primary dermal fibroblasts from old human donors and autophagic flux was determined. As expected, PER2-GFP displayed distinct patterns of subcellular localization reflecting various states of its regulation by nuclear import, whereas GFP alone was evenly distributed in the cells (Fig. S5B). Importantly, expression of PER2-GFP increased autophagic flux compared to cells that were transfected with a control vector expressing only GFP (Fig. 5F). This finding provides further evidence that altered core clock gene expression contributes to the age-related reduction of autophagic flux and might thereby promote the aging process of human skin fibroblasts. It also demonstrates that the dysfunctional autophagy mechanism of aged cells can be “rejuvenated” by elevating the expression of a single core clock gene.
The C. elegans Period homologue Lin-42 regulates autophagy and longevity
A connection between Period genes and aging exists in animals as different as mice [25,26] and fruit flies [27], and might point towards an evolutionarily conserved role for Period genes in the age-dependent regulation of autophagy levels. We thus turned to the nematode Caenorhabditis elegans, a powerful genetic tractable model organism widely used for aging studies, in which autophagy is essential for development and life span extension in different genetic backgrounds [28–30]. The post-embryonic larval development of C. elegans is characterized by four molting cycles, which lead to a periodic renovation of animal cuticles through the epidermal blast cells, and which are regulated by heterochronic genes such as lin-42, a homolog of mammalian PER2 [31]. The transcript levels of lin-42 oscillate in the epidermis during post-embryonic development with peaks during the molting time, and inactivation of lin-42 leads to arrhythmic molting and causes abnormal differentiation of epidermal stem cells [31,32]. To reveal whether altered expression of lin-42 also regulates C. elegans aging we assessed the life span of animals with mutant or with extra copies of lin-42. We observed that, similar to wild-type animals, lin-42 mutants develop into fertile adults within three days after hatching, but after reaching the adult stage they quickly start dying (Fig. 6A and 6E). Although we cannot rule out a developmental problem in facilitating the dramatic reduction in life span in the absence of lin-42, it is worth noting that, conversely, overexpression of lin-42 significantly extended C. elegans life span (Fig. 6B and 6E). Notably, the strong correlation between autophagic flux and PER2 expression during aging in human fibroblasts, along with the newly disclosed connection between lin-42 and life span extension, indicate a role for lin-42 in autophagy regulation. In support of a causative role for lin-42-regulated autophagy in a “rejuvenating” process, reducing the post-developmental expression of key autophagy genes in C. elegans, such as bec-1/Beclin and atg-5/ATG5, which as expected slightly reduced the life span of wild-type animals, completely suppressed the life span extension effect elicited by lin-42 overexpression (Fig. 6C-E). Most importantly, we observed that suppression of lin-42 led to the accumulation of autophagosomal foci in a C. elegans transgenic strain expressing the mammalian LC3 orthologue LGG-1 fused to GFP [28] (Fig. 6F). To establish whether the increased accumulation of LGG-1/LC3::GFP foci is the result of an improved or blocked autophagic flux [33,34], we utilized a transgenic C. elegans strain expressing the mammalian p62 orthologue SQST-1 tagged to GFP under the sqst-1 promoter (Fig. 6G-H). Indeed, similarly to its mammalian counterpart, SQST-1 is efficiently degraded when an intact autophagic flux is induced [35], while it accumulates when autophagic flux is impaired [36]. We found that suppression of lin-42 led to increased p62 levels in the worms (Fig. 6G-H), demonstrating that lin-42 is, like the mammalian homologue PER2, a positive regulator of the autophagic flux. Our findings reveal for the first time a conserved role for Period gene-dependent regulation of autophagy in the aging process.
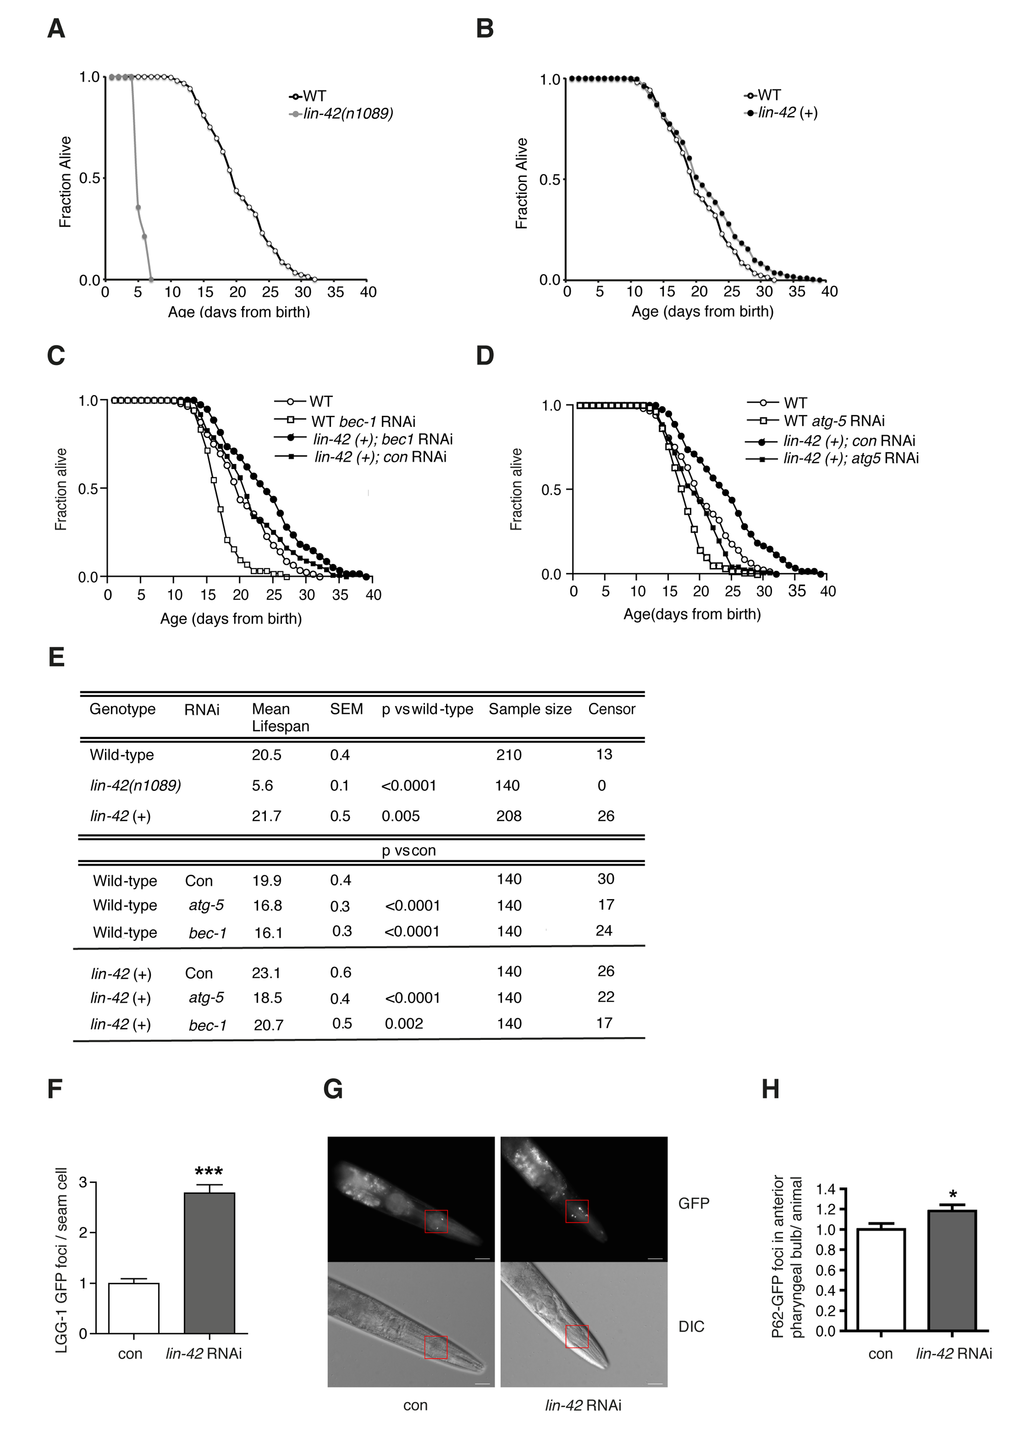
Figure 6. Lin-42 regulates lifespan and autophagy in C. elegans. Survival analyses of wild-type animals (WT) compared to lin-42(n1089) mutants (A) or to lin-42 (+) transgenic animals (B). Survival analyses of wild-type animals (WT) and lin-42 (+) transgenic animals fed bacteria transformed with empty-vector (con) or with vector expressing dsRNA against bec-1 (C) or atg-5 (D). (E) Table summarizing survival data analysis from (A-D). (F) Quantification of LGG-1/LC3::GFP positive foci in the DA2123 transgenic strain fed bacteria transformed with empty-vector (con) or with vector expressing dsRNA against lin-42 (lin-42 RNAi). Results are plotted as mean ± SEM of GFP foci (***) represent the P-value (<0.0001) calculated by performing the t-test between the 2 conditions. (G) P62/SQST-1::GFP translational reporter strain (HZ589) fed bacteria transformed with empty-vector (con) or with vector expressing dsRNA against lin-42 (lin-42 RNAi). Top panels: green fluorescence channel (GFP) images. Bottom panels: differential (Nomarski) interference contrast images (DIC). Red squares indicate selected areas used for fluorescence foci quantification. White bars = 20µm. (H) Quantification of GFP positive foci in the anterior pharyngeal bulb of HZ589 fed bacteria transformed with empty-vector (con) or with vector expressing dsRNA against lin-42 (lin-42 RNAi). Results are plotted as normalized mean ± SEM of GFP foci, relative to the control. (*) represent the P-value (<0.05) calculated by performing the t-test between the 2 conditions.
Discussion
Various studies link mammalian aging to a deterioration of autophagy and circadian clock functions with ample consequences for cellular and organismal physiology [2,9]. Nevertheless, the hypothesis that these processes might be mechanistically connected has never been addressed. Here we studied human skin cells aged in situ, in which circadian oscillator functions and autophagy levels are experimentally accessible. We analysed the mechanisms underlying age-correlated changes by genetic loss and gain of function experiments in mammalian fibroblasts and C. elegans. The central findings of our study are that core clock genes regulate autophagy in an evolutionarily conserved and cell-autonomous manner, and that clock-dependent control of autophagy is disrupted in aged mammalian cells and might in turn regulate the aging process.
In primary human fibroblasts a tight correlation between donor age, autophagic flux and core clock gene expression was observed. In accordance with our findings, age-related deregulation of clock genes has been reported before in several instances [9,27,37,38]. Subsequently, PER2 was demonstrated to play a role in cell-autonomous autophagy regulation. However, it should presently not be excluded that other clock genes also deregulated in aged fibroblasts likewise play a role in autophagy regulation and ageing. It has also been reported that the circadian clock controls autophagy levels in mouse liver via the transcription factor CCAAT/enhancer-binding protein beta (Cebpb) [39]. In agreement with this finding we observed a correlation between CEBPB expression levels, autophagy, and age in human fibroblasts (Fig. S6A). However, knockdown of Per2 in NIH 3T3 fibroblasts reduced autophagy without changing Cebpb expression levels (Fig. S6B), indicating that in these cells Cebpb is not crucial for the circadian regulation of autophagy, while still serving the regulation of autophagy in response to metabolic changes. One report showing that the transcription of Cebpb is enhanced after amino acid starvation would support this notion [40]. In liver, autophagy flux is maximal in the middle of the light phase [39] while in skin cells the maximum is reached in the middle of the dark phase (Fig. 4B). In line with this difference, the contribution of the circadian clock to autophagy regulation might vary depending on the tissue or the metabolic conditions. The circadian regulation of autophagy genes in fasting mice is different from mice fed ad libitum, and autophagy gene expression in skeletal muscle seems to be non-rhythmic [39]. Tissue-specific diversity of circadian gene regulation has been recognized for a long time [41]. Accordingly, clock-dependent autophagy regulation is bound to be different in a fibroblast adapting to actinic stress as compared to a liver cell adapting to feeding-fasting cycles [39] or a skeletal muscle cell adapting to exercise and rest [42].
Emerging evidence indicates that the circadian clock regulates major pathways of autophagy and aging processes. SIRT1 is rhythmic in mammalian cells and organs and most likely driven by the circadian clock [43,44]. Whereas the specific role of PER2 in the regulation of SIRT1 levels is still unclear, SIRT1 controls PER2 protein levels by deacetylating PER2 and thereby promoting its degradation [44]. Recently, also mTOR signalling and the circadian clock have been shown to reciprocally regulate each other’s activity [45]. Interestingly, a metabolic circadian clock regulates mTOR activity in addition to the canonical light-entrainable clock [46]. While the present study did not reveal the molecular mechanism that connects clock gene expression to the autophagy machinery in aging fibroblasts, PER2 as part of the molecular circadian oscillator affects the expression of a large number of genes in mammalian cells [47], which opens the possibility that PER2 exerts direct or indirect transcriptional control over a metabolic pathway that connects autophagy and aging. Various small molecules have been identified that modulate circadian clock function, and some of them affect cellular PER2 levels [48]. It should be of high clinical relevance to find applications for such drugs in autophagy-related pathologies of the skin, e.g. melanoma [49], in particular in aged subjects.
Lin-42, the homologue of mammalian period proteins in the worm C. elegans, was identified as a regulator of autophagy and life span. Both PER2 and lin-42 positively regulate autophagy, and the fact that this role appears largely conserved in a nematode not exhibiting a mammalian type of circadian regulation indicates that this function of Period proteins is possibly not stringently linked to core clock functionality. Previously it had been reported that lack of lin-42 expression leads to abnormal developmental changes due to altered expression of heterochronic genes. The reduced life span of lin-42-deficient worms in our experiments is unlikely to be attributed to a developmental deficit since these mutants reached the fertile stage at the same time as wild-type animals. However, we cannot exclude that the loss of lin-42 leads to developmental defects, which only become evident and kill the animals later in life. In this context it is interesting to note that middle-aged Per2-deficient mice have reproductive deficits that are comparable with those seen in aged wild-type mice [26], and these deficits might be due to reduced autophagic flux, which is highly induced in wild-type mice and is essential for survival and correct development of the embryo [50].
It should be noted that Cry1-/-;Cry2-/- and Per1-/-;Per2m/m animals have comparable life spans which are reduced compared to wild type mice [51]. In contrast, we found that loss of both Cryptochromes enhances autophagy levels while reduction of Per2 expression causes a decline in autophagic flux. This discrepancy might be explained by detrimental systemic effects on physiology and metabolism that are dominant over effects on autophagy in total knockout animals of Period or Cryptochrome genes. Moreover, we limited our study to fibroblasts while the knockout mice used by Lee at al (2010) lack Per or Cry genes in every cell of their body. Our results point directly towards a role of clock genes in skin aging but only imply an influence of clock gene expression on autophagy levels in other tissues and longevity of the whole organism. More extensive studies are therefore required to address these questions directly.
Materials and Methods
Luminometric analysis of cultured mouse fibroblasts
NIH 3T3 cells stably expressing a luciferase reporter construct of the Bmal1 promoter (NIH 3T3 Bmal1-Luc) and mouse embryonic fibroblasts (MEFs) isolated from Cry1-/-;Cry2-/- mice or wild type littermates were cultured in Dulbecco’s modified Eagle’s medium (DMEM) supplemented with 10% fetal bovine serum (FBS) and 1% penicillin/streptomycin (Life Technologies, Darmstadt, Germany). Primary human dermal fibroblasts were transduced with Bmal1-Luc expressing lentiviruses according to previously published methods [19]. For continuous circadian monitoring of Bmal1 promoter activity, cells were synchronised for 30 min with 100 nM dexamethasone and re-seeded in phenol red-free medium supplemented with 100 µM luciferin. Real time bioluminescence of the Bmal1 reporter gene was monitored in a light tight incubator equipped with photomultiplier tube detector assemblies (LumiCycler, Actimetrics, Wilmette, Illinois, USA). Period length, phase and amplitude of circadian oscillations were evaluated using the computer software supplied with the LumiCycler [52].
Culture of primary human dermal fibroblasts
Human dermal fibroblasts were isolated from skin specimen acquired in the course of cosmetic surgery from sun-protected areas at the bottom side of human female breast from donors aged 20-67. Isolation and primary culture of primary human dermal fibroblasts followed published procedures [13]. Cells were expanded up to population doubling = 9, at which telomere shortening was not yet significant. Replicative cell cycle arrest was determined to occur at population doubling > 50.
siRNA-mediated knockdown
For siRNA-mediated knockdown experiments 2 x 10⁵ cells were seeded into 35 mm culture dishes. Cells were transfected with ON-TARGETplus smartpool siRNA (Thermo Scientific, Schwerte, Germany). ON-TARGETplus Non-targeting siRNA (Nt) was used as a control. Transfection was performed according to manufacturer's instructions.
mRNA analyses
For circadian quantification of mRNA abundance cells were harvested 26, 30, 34, 38, 42 and 46 h after synchronization with dexamethasone. RNA was isolated and reversely transcribed using RNeasy mini extraction and Quantitect Reverse Transcription kits (Qiagen, Hilden, Germany). Quantitative RT-PCR was carried out using the LightCycler480II detection system and LightCycler480 Probes master mix (Roche, Penzberg, Germany). Relative crossing points (ΔCP) are calculated from cycle thresholds (CT) according to ΔCP = 2E-ΔCT and ΔCT = CT(gene of interest) – mean CT(3 housekeeping genes).
Transfection of primary human dermal fibroblasts
Expression of PER2 in human dermal fibroblasts was performed using the P2 Primary Cell 4D Nucleofector X Kit (Lonza, Switzerland) following manufacturer’s instructions. 2x10⁶ cells were suspended in 100 µl nucleofection solution together with 2.5 µg PER2-GFP or GFP vector and transferred into a nucleofection cuvette. Program FF-113 was used for transfection followed by incubation for 10 min at room temperature. 400 µl culture medium was added to the cells which were subsequently transferred into 6-well plates or 8-well Ibidi slides for microscopy.
Protein detection and autophagy measurements
Proteins were quantified by immunoblotting using rabbit antibodies against LC3B, ULK1 (Cell Signaling Technologies, Danvers, MA, USA), PER2 (Millipore, Darmstadt, Germany) and BMAL1 (Abcam, Cambridge, UK). Gel loading was equalized according to protein content of the samples and controlled by amido black staining of the blotted membranes or parallel immune staining using rabbit and mouse beta-Actin or rabbit Calnexin antibodies (Sigma Aldrich, Martinsried, Germany). Western blots were developed with Peroxidase-coupled secondary antibodies. Chemo-luminescence was quantified with a digital camera system (LAS 4000, Fuji, Düsseldorf, Germany). Autophagy flux was determined according to current guidelines by treating cells with chloroquine (50 µM, 3 h) or bafilomycin (10 nM, 3 h) prior to the analysis of LC3-II protein levels. Autophagic flux values were calculated by subtracting LC3-II levels in untreated cells from LC3-II levels in cells treated with the lysosome inhibitors Chloroquine or Bafilomycin [16].
Immunostaining
Cells were fixed with 4% formaldehyde for 10 min and then permeabilized with 0.5% Triton X-100 for 15 min. After blocking LC3B antibody in 0.1% blocking solution was added for 1h and then washed off. The secondary antibody Cy3 (goat anti-rabbit) was added for 1h, washed off again, then mounting medium with DAPI was added. Pictures were taken randomly and quantified with Image J. All steps were carried out at room temperature. Senescence-associated (SA)-β-galactosidase staining
2 x 10⁴ cells/chamber were seeded in 500 µl culture medium in 4-chamber slides and incubated over night at 37°C, 5% CO2 at saturated humidity. Thereafter cells were washed twice with PBS and fixed with 4% paraformaldehyde for 30 min at 37°C, followed by an additional washing step with PBS. X-Gal stock solution (5% in DMF) was diluted 1:4 in X-Gal dilution buffer (5mM Potassium Ferricyanide Crystalline, 5mM Potassium Ferricyanide Trihydrate, 2mM Magnesium Chloride Hexahydrate in PBS, pH = 6). 500 µl X-Gal working solution/chamber or X-Gal dilution buffer was applied to the cells and slides were incubated at 37°C over night. Slides were washed 3 times for 5 minutes in PBS and mounted with Aqua-Poly/Mount (Polyscience, Inc., PA, USA). Pictures were taken using a Zeiss Axiophot (Carl Zeiss Microscopy GmbH, Germany).
C. elegans strains and maintenance
Animals were kept (semi-)synchronized (by egg lay) at 20°C on Nematode Growth Media (NGM) plates and fed with Escherichia coli OP50. For the experiments, worms were synchronized on plates with E. coli HT115, a strain used for RNA interference (RNAi). Bacteria were grown in LB medium at 37 °C overnight. C. elegans strains used for the experiments were obtained from the Caenorhabditis Genetics Center: N2: wild-type, ALF62: bafIs62 [lin-42p::gfp + unc-119(+)], HZ589: bpIs151[(sqst-1::gfp; unc-76)IV]; him-5(e1490)V, DA2123: adIs2122 [lgg-1p::gfp::lgg-1 + rol-6(su1006)].
Life span assay
Life span analysis started from a synchronized population of eggs. From the third day after the egg lay worms were transferred to fresh NGM plates every day during the fertile phase (from day 3 to day 6) to prevent starvation and contamination by the progeny. After this time animals were transferred every second or third day on fresh plates. While transferring the number of worms alive and dead was counted. Animals that did not move spontaneously nor responded to a manual stimulus or did not show any sign of pharyngeal pumping were scored as dead. Worms showing an egg laying defect (bags) or an exploded vulva, or that died on the wall or were lost during the lifespan, were censored. Animals used for atg-5 or bec-1 RNAi life span were grown on empty vector (HT115) until L4 stage, and then transferred on the correspondent RNAi plates for the rest of the life span. The survival curve was calculated from the dead and censored animals using a Kaplan-Meier estimator for lifespan curves and the p values was calculated using the log-rank test between pooled populations of animals.
Autophagy measurement in C. elegans
LGG-1/LC3::GFP puncta from DA2123 transgenic animals were counted in the hypodermal seam cells of L3 animals, at least 4 different cells were scored in 10-12 different worms randomly chosen on the slide. Worms were mounted on 2% agarose pad and anesthetized with Sodium Azide 20mM. The LGG-1/LC3::GFP puncta were counted on a Zeiss Axio Imager 2 microscope using a 630-fold magnification. Three independent biological replica were carried out. p62/SQST-1 GFP puncta from HZ589 transgenic animals were counted in 15–20 different young adult worms mounted on 2% agarose pad and anesthetized with Sodium Azide 30mM. GFP foci were counted in the anterior pharyngeal bulb. The worms were visualized using 1000-fold magnification on a Zeiss Axio Imager 2 microscope. At least four independent biological trials were carried out.
Statistics
Results of continuous variables are given as mean ± SEM. GraphPad PRISM version 5.0 (GraphPad Software Inc., USA) was used for normal data distribution analysis (Shapiro-Wilk test) and calculation of significances (Mann-Whitney U-test). P values < 0.05 were considered significant.
Declaration of ethical approval of human studies
All donors of skin specimen have given their consent to the study in writing. The investigation conforms to the principles of the Declaration of Helsinki and was approved by the Ethics Committee of the Medical Faculty of the University of Düsseldorf.
Supplementary Materials
Acknowledgements
We are indebted to Jean Krutmann and Ellen Fritsche for providing primary human dermal fibroblasts and to Bert van der Horst for Cry1/2-deficient fibroblasts. We thank Olaf Eckermann and Joachim Altschmied for help with lentiviral transductions. Christian Mielke and Gad Asher we thank for valuable comments on the manuscript and Björn Stork for insightful discussions.
Funding
The authors gratefully acknowledge funding by the Deutsche Forschungsgemeinschaft [SFB 728 to F.B. and H.R., GK 1033 to F.B., Re 3046/2-1 to H.R.], the Human Frontier Science Program [CDA00009/2009-C to H.R.], the German Ministry of Research and Education [GerontoSys Network on Stromal Aging to F.B.], the Italian Association for Cancer Research (MFAG11509 to N.V.) and the Strategic Research Funding of the Heinrich Heine University (701301988 to N.V.).
Conflicts of Interest
The authors declare no conflicts of interest.
References
- 1. López-Otín C, Blasco MA, Partridge L, Serrano M, Kroemer G. The hallmarks of aging. Cell. 2013; 153:1194–217. https://doi.org/10.1016/j.cell.2013.05.039 [PubMed]
- 2. Rubinsztein DC, Mariño G, Kroemer G. Autophagy and aging. Cell. 2011; 146:682–95. https://doi.org/10.1016/j.cell.2011.07.030 [PubMed]
- 3. Schiavi A, Torgovnick A, Kell A, Megalou E, Castelein N, Guccini I, Marzocchella L, Gelino S, Hansen M, Malisan F, Condò I, Bei R, Rea SL, et al. Autophagy induction extends lifespan and reduces lipid content in response to frataxin silencing in C. elegans. Exp Gerontol. 2013; 48:191–201. https://doi.org/10.1016/j.exger.2012.12.002 [PubMed]
- 4. Madeo F, Zimmermann A, Maiuri MC, Kroemer G. Essential role for autophagy in life span extension. J Clin Invest. 2015; 125:85–93. https://doi.org/10.1172/JCI73946 [PubMed]
- 5. Pyo JO, Yoo SM, Ahn HH, Nah J, Hong SH, Kam TI, Jung S, Jung YK. Overexpression of Atg5 in mice activates autophagy and extends lifespan. Nat Commun. 2013; 4:2300. https://doi.org/10.1038/ncomms3300 [PubMed]
- 6. Dibner C and Schibler U. Circadian timing of metabolism in animal models and humans. J Intern Med. 2015; 277:513–27. https://doi.org/10.1111/joim.12347 [PubMed]
- 7. Gaddameedhi S, Selby CP, Kaufmann WK, Smart RC, Sancar A. Control of skin cancer by the circadian rhythm. Proc Natl Acad Sci USA. 2011; 108:18790–95. https://doi.org/10.1073/pnas.1115249108 [PubMed]
- 8. Marteijn JA, Lans H, Vermeulen W, Hoeijmakers JH. Understanding nucleotide excision repair and its roles in cancer and ageing. Nat Rev Mol Cell Biol. 2014; 15:465–81. https://doi.org/10.1038/nrm3822 [PubMed]
- 9. Chang HC and Guarente L. SIRT1 mediates central circadian control in the SCN by a mechanism that decays with aging. Cell. 2013; 153:1448–60. https://doi.org/10.1016/j.cell.2013.05.027 [PubMed]
- 10. Kondratov RV and Antoch MP. The clock proteins, aging, and tumorigenesis. Cold Spring Harb Symp Quant Biol. 2007; 72:477–82. https://doi.org/10.1101/sqb.2007.72.050 [PubMed]
- 11. Yen WL and Klionsky DJ. How to live long and prosper: autophagy, mitochondria, and aging. Physiology (Bethesda). 2008; 23:248–62. https://doi.org/10.1152/physiol.00013.2008 [PubMed]
- 12. Kalfalah F, Seggewiß S, Walter R, Tigges J, Moreno-Villanueva M, Bürkle A, Ohse S, Busch H, Boerries M, Hildebrandt B, Royer-Pokora B, Boege F. Structural chromosome abnormalities, increased DNA strand breaks and DNA strand break repair deficiency in dermal fibroblasts from old female human donors. Aging (Albany NY). 2015; 7:110–22. https://doi.org/10.18632/aging.100723 [PubMed]
- 13. Kalfalah F, Sobek S, Bornholz B, Götz-Rösch C, Tigges J, Fritsche E, Krutmann J, Köhrer K, Deenen R, Ohse S, Boerries M, Busch H, Boege F. Inadequate mito-biogenesis in primary dermal fibroblasts from old humans is associated with impairment of PGC1A-independent stimulation. Exp Gerontol. 2014; 56:59–68. https://doi.org/10.1016/j.exger.2014.03.017 [PubMed]
- 14. Waldera Lupa DM, Kalfalah F, Safferling K, Boukamp P, Poschmann G, Volpi E, Götz-Rösch C, Bernerd F, Haag L, Huebenthal U, Fritsche E, Boege F, Grabe N, et al. Characterization of Skin Aging-Associated Secreted Proteins (SAASP) Produced by Dermal Fibroblasts Isolated from Intrinsically Aged Human Skin. J Invest Dermatol. 2015; 135:1954–68. https://doi.org/10.1038/jid.2015.120 [PubMed]
- 15. Klionsky DJ, Abdalla FC, Abeliovich H, Abraham RT, Acevedo-Arozena A, Adeli K, Agholme L, Agnello M, Agostinis P, Aguirre-Ghiso JA, Ahn HJ, Ait-Mohamed O, Ait-Si-Ali S, et al. Guidelines for the use and interpretation of assays for monitoring autophagy. Autophagy. 2012; 8:445–544. [PubMed]
- 16. Metz P, Chiramel A, Chatel-Chaix L, Alvisi G, Bankhead P, Mora-Rodriguez R, Long G, Hamacher-Brady A, Brady NR, Bartenschlager R. Dengue Virus Inhibition of Autophagic Flux and Dependency of Viral Replication on Proteasomal Degradation of the Autophagy Receptor p62. J Virol. 2015; 89:8026–41. https://doi.org/10.1128/JVI.00787-15 [PubMed]
- 17. Zhang C and Cuervo AM. Restoration of chaperone-mediated autophagy in aging liver improves cellular maintenance and hepatic function. Nat Med. 2008; 14:959–65. https://doi.org/10.1038/nm.1851 [PubMed]
- 18. Demirovic D, Nizard C, Rattan SI. Basal level of autophagy is increased in aging human skin fibroblasts in vitro, but not in old skin. PLoS One. 2015; 10:e0126546. https://doi.org/10.1371/journal.pone.0126546 [PubMed]
- 19. Liu AC, Tran HG, Zhang EE, Priest AA, Welsh DK, Kay SA. Redundant function of REV-ERBalpha and beta and non-essential role for Bmal1 cycling in transcriptional regulation of intracellular circadian rhythms. PLoS Genet. 2008; 4:e1000023. https://doi.org/10.1371/journal.pgen.1000023 [PubMed]
- 20. Pagani L, Schmitt K, Meier F, Izakovic J, Roemer K, Viola A, Cajochen C, Wirz-Justice A, Brown SA, Eckert A. Serum factors in older individuals change cellular clock properties. Proc Natl Acad Sci USA. 2011; 108:7218–23. https://doi.org/10.1073/pnas.1008882108 [PubMed]
- 21. Yagita K, Tamanini F, van Der Horst GT, Okamura H. Molecular mechanisms of the biological clock in cultured fibroblasts. Science. 2001; 292:278–81. https://doi.org/10.1126/science.1059542 [PubMed]
- 22. Balsalobre A, Marcacci L, Schibler U. Multiple signaling pathways elicit circadian gene expression in cultured Rat-1 fibroblasts. Curr Biol. 2000; 10:1291–94. https://doi.org/10.1016/S0960-9822(00)00758-2 [PubMed]
- 23. Nagoshi E, Saini C, Bauer C, Laroche T, Naef F, Schibler U. Circadian gene expression in individual fibroblasts: cell-autonomous and self-sustained oscillators pass time to daughter cells. Cell. 2004; 119:693–705. https://doi.org/10.1016/j.cell.2004.11.015 [PubMed]
- 24. Alers S, Löffler AS, Paasch F, Dieterle AM, Keppeler H, Lauber K, Campbell DG, Fehrenbacher B, Schaller M, Wesselborg S, Stork B. Atg13 and FIP200 act independently of Ulk1 and Ulk2 in autophagy induction. Autophagy. 2011; 7:1423–33. https://doi.org/10.4161/auto.7.12.18027 [PubMed]
- 25. Antoch MP, Toshkov I, Kuropatwinski KK, Jackson M. Deficiency in PER proteins has no effect on the rate of spontaneous and radiation-induced carcinogenesis. Cell Cycle. 2013; 12:3673–80. https://doi.org/10.4161/cc.26614 [PubMed]
- 26. Pilorz V and Steinlechner S. Low reproductive success in Per1 and Per2 mutant mouse females due to accelerated ageing? Reproduction. 2008; 135:559–68. https://doi.org/10.1530/REP-07-0434 [PubMed]
- 27. Krishnan N, Kretzschmar D, Rakshit K, Chow E, Giebultowicz JM. The circadian clock gene period extends healthspan in aging Drosophila melanogaster. Aging (Albany NY). 2009; 1:937–48. https://doi.org/10.18632/aging.100103 [PubMed]
- 28. Meléndez A, Tallóczy Z, Seaman M, Eskelinen EL, Hall DH, Levine B. Autophagy genes are essential for dauer development and life-span extension in C. elegans. Science. 2003; 301:1387–91. https://doi.org/10.1126/science.1087782 [PubMed]
- 29. Tóth ML, Sigmond T, Borsos E, Barna J, Erdélyi P, Takács-Vellai K, Orosz L, Kovács AL, Csikós G, Sass M, Vellai T. Longevity pathways converge on autophagy genes to regulate life span in Caenorhabditis elegans. Autophagy. 2008; 4:330–38. https://doi.org/10.4161/auto.5618 [PubMed]
- 30. Hansen M, Chandra A, Mitic LL, Onken B, Driscoll M, Kenyon C. A role for autophagy in the extension of lifespan by dietary restriction in C. elegans. PLoS Genet. 2008; 4:e24. https://doi.org/10.1371/journal.pgen.0040024 [PubMed]
- 31. Monsalve GC, Van Buskirk C, Frand AR. LIN-42/PERIOD controls cyclical and developmental progression of C. elegans molts. Curr Biol. 2011; 21:2033–45. https://doi.org/10.1016/j.cub.2011.10.054 [PubMed]
- 32. Jeon M, Gardner HF, Miller EA, Deshler J, Rougvie AE. Similarity of the C. elegans developmental timing protein LIN-42 to circadian rhythm proteins. Science. 1999; 286:1141–46. https://doi.org/10.1126/science.286.5442.1141 [PubMed]
- 33. Zhang H, Chang JT, Guo B, Hansen M, Jia K, Kovács AL, Kumsta C, Lapierre LR, Legouis R, Lin L, Lu Q, Meléndez A, O’Rourke EJ, et al. Guidelines for monitoring autophagy in Caenorhabditis elegans. Autophagy. 2015; 11:9–27. [PubMed]
- 34. Schiavi A, Maglioni S, Palikaras K, Shaik A, Strappazzon F, Brinkmann V, Torgovnick A, Castelein N, De Henau S, Braeckman BP, Cecconi F, Tavernarakis N, Ventura N. Iron-Starvation-Induced Mitophagy Mediates Lifespan Extension upon Mitochondrial Stress in C. elegans. Curr Biol. 2015; 25:1810–22. https://doi.org/10.1016/j.cub.2015.05.059 [PubMed]
- 35. Tian Y, Li Z, Hu W, Ren H, Tian E, Zhao Y, Lu Q, Huang X, Yang P, Li X, Wang X, Kovács AL, Yu L, Zhang H. C. elegans screen identifies autophagy genes specific to multicellular organisms. Cell. 2010; 141:1042–55. https://doi.org/10.1016/j.cell.2010.04.034 [PubMed]
- 36. Guo B, Huang X, Zhang P, Qi L, Liang Q, Zhang X, Huang J, Fang B, Hou W, Han J, Zhang H. Genome-wide screen identifies signaling pathways that regulate autophagy during Caenorhabditis elegans development. EMBO Rep. 2014; 15:705–13. [PubMed]
- 37. Oishi K, Koyanagi S, Ohkura N. Circadian mRNA expression of coagulation and fibrinolytic factors is organ-dependently disrupted in aged mice. Exp Gerontol. 2011; 46:994–99. https://doi.org/10.1016/j.exger.2011.09.003 [PubMed]
- 38. Bonaconsa M, Malpeli G, Montaruli A, Carandente F, Grassi-Zucconi G, Bentivoglio M. Differential modulation of clock gene expression in the suprachiasmatic nucleus, liver and heart of aged mice. Exp Gerontol. 2014; 55:70–79. https://doi.org/10.1016/j.exger.2014.03.011 [PubMed]
- 39. Ma D, Panda S, Lin JD. Temporal orchestration of circadian autophagy rhythm by C/EBPβ. EMBO J. 2011; 30:4642–51. https://doi.org/10.1038/emboj.2011.322 [PubMed]
- 40. Thiaville MM, Dudenhausen EE, Zhong C, Pan YX, Kilberg MS. Deprivation of protein or amino acid induces C/EBPbeta synthesis and binding to amino acid response elements, but its action is not an absolute requirement for enhanced transcription. Biochem J. 2008; 410:473–84. https://doi.org/10.1042/BJ20071252 [PubMed]
- 41. Storch KF, Lipan O, Leykin I, Viswanathan N, Davis FC, Wong WH, Weitz CJ. Extensive and divergent circadian gene expression in liver and heart. Nature. 2002; 417:78–83. https://doi.org/10.1038/nature744 [PubMed]
- 42. Woldt E, Sebti Y, Solt LA, Duhem C, Lancel S, Eeckhoute J, Hesselink MK, Paquet C, Delhaye S, Shin Y, Kamenecka TM, Schaart G, Lefebvre P, et al. Rev-erb-α modulates skeletal muscle oxidative capacity by regulating mitochondrial biogenesis and autophagy. Nat Med. 2013; 19:1039–46. https://doi.org/10.1038/nm.3213 [PubMed]
- 43. Nakahata Y, Kaluzova M, Grimaldi B, Sahar S, Hirayama J, Chen D, Guarente LP, Sassone-Corsi P. The NAD+-dependent deacetylase SIRT1 modulates CLOCK-mediated chromatin remodeling and circadian control. Cell. 2008; 134:329–40. https://doi.org/10.1016/j.cell.2008.07.002 [PubMed]
- 44. Asher G, Gatfield D, Stratmann M, Reinke H, Dibner C, Kreppel F, Mostoslavsky R, Alt FW, Schibler U. SIRT1 regulates circadian clock gene expression through PER2 deacetylation. Cell. 2008; 134:317–28. https://doi.org/10.1016/j.cell.2008.06.050 [PubMed]
- 45. Khapre RV, Kondratova AA, Patel S, Dubrovsky Y, Wrobel M, Antoch MP, Kondratov RV. BMAL1-dependent regulation of the mTOR signaling pathway delays aging. Aging (Albany NY). 2014; 6:48–57. https://doi.org/10.18632/aging.100633 [PubMed]
- 46. Khapre RV, Patel SA, Kondratova AA, Chaudhary A, Velingkaar N, Antoch MP, Kondratov RV. Metabolic clock generates nutrient anticipation rhythms in mTOR signaling. Aging (Albany NY). 2014; 6:675–89. https://doi.org/10.18632/aging.100686 [PubMed]
- 47. Koike N, Yoo SH, Huang HC, Kumar V, Lee C, Kim TK, Takahashi JS. Transcriptional architecture and chromatin landscape of the core circadian clock in mammals. Science. 2012; 338:349–54. https://doi.org/10.1126/science.1226339 [PubMed]
- 48. Wallach T and Kramer A. Chemical chronobiology: toward drugs manipulating time. FEBS Lett. 2015; 589:1530–38. https://doi.org/10.1016/j.febslet.2015.04.059 [PubMed]
- 49. Liu H, He Z, Simon HU. Targeting autophagy as a potential therapeutic approach for melanoma therapy. Semin Cancer Biol. 2013; 23:352–60. https://doi.org/10.1016/j.semcancer.2013.06.008 [PubMed]
- 50. Tsukamoto S, Hara T, Yamamoto A, Kito S, Minami N, Kubota T, Sato K, Kokubo T. Fluorescence-based visualization of autophagic activity predicts mouse embryo viability. Sci Rep. 2014; 4:4533. [PubMed]
- 51. Lee S, Donehower LA, Herron AJ, Moore DD, Fu L. Disrupting circadian homeostasis of sympathetic signaling promotes tumor development in mice. PLoS One. 2010; 5:e10995. https://doi.org/10.1371/journal.pone.0010995 [PubMed]
- 52. Yamazaki S, Numano R, Abe M, Hida A, Takahashi R, Ueda M, Block GD, Sakaki Y, Menaker M, Tei H. Resetting central and peripheral circadian oscillators in transgenic rats. Science. 2000; 288:682–85. https://doi.org/10.1126/science.288.5466.682 [PubMed]