


Introduction
The decline of the immune system named immunosenescence comprises a set of changes occurring to the innate and adaptive immune system that accompany human aging. These result in the increased susceptibility to infections, reduced effectiveness of vaccination and higher incidences of cancer, neurodegenerative disorders and metabolic imbalance in the elderly [1]. In order to meet the health related needs of the increasing elderly population, research on age-related immunosenescence needs to rapidly progress. Moreover, to develop appropriate preventative and therapeutic strategies, it is essential that we understand the underlying biological mechanisms that contribute to age-related pathogenesis. The aging process alters both the innate and the adaptive immune systems. Immunosenescence is characterized by a decrease in cell-mediated immune function as well as humoral immune responses. Age-dependent defects in T [2] and B cell [3] function coexist with age-related changes within the immune system. Two major features that lymphocytes acquire as they age are the loss of proliferative capacity [4] and the acquisition of typical markers of the NK cells [5]. In addition, a proportion of the elder population had a dramatic collapse in their B-cell repertoire diversity [6].
The immunophenotype alteration of lymphocytes subsets has been widely used in the evaluation of human immunodeficiency virus (HIV) infection [7], primary immunodeficiency [8], autoimmune diseases [9] and acute leukemia [10]. An examination of the phenotypic changes in circulating lymphocyte subsets is useful for monitoring the onset and progression of diseases and determining optimal treatment. Flow cytometric analysis is a convenient method for studying immune status and has been widely used for the clinical diagnosis and management of immune diseases associated with phenotypic and functional perturbations of lymphocyte subsets [11]. The studies on the immunophenotype of peripheral lymphocyte subsets in healthy people are limited. Infrequent sampling in healthy humans makes it difficult to capture an immune response in vivo. Some regional data of lymphocyte phenotypes show variations due to the influence of gender, age, ethnicity, and lifestyle differences [12]. These data indicate that different regional populations should have their own defined reference values for peripheral lymphocyte subsets. In order to better interpret the results of lymphocyte immuno-phenotyping in clinical practice, it is necessary to establish a reliable reference value of lymphocyte subsets in healthy people with different origins in various laboratory settings.
With the widely used flow cytometry, knowledge of dynamics of human lymphocyte subsets in peripheral blood during the long lifespan might provide an understanding of age-related immunosenescene. In this study, we aimed to display the age-related fluctuation of lymphocyte subsets in peripheral blood and partially explain the age-related lymphocyte senescence.
Results
Reference range and variation for lymphocyte subsets in a long life span
A total of 1068 healthy Chinese adults were recruited for assessment of human immune cell compartmentalization, including 731 males (68.45%) and 337 females (31.55%). Their mean age was 40.5, 781 (73.13%) were in the young adult group (19-44 years old, 564 males, 217 females, mean age 35.4 years), 246 (23.03%) belonged to middle-aged adults (45-64 years old, 134 males,112 females, mean age 50.9 years) and 41 (3.84%) belonged to the elderly (65-80 years old, 33males, 8 females, mean age 71.6 years). The Chi-square test demonstrated that the gender was unbalanced among the three cohorts (p<0.001). The mean and 95% confidential interval (CI) of lymphocytes counts and percentage for each group ware shown in Table 1. Most parameters varied in different age group except for CD19+ B cell counts (p=0.383), CD19+ B percentage (p=0.863) CD3+CD4+ T cell counts (p=0.565, and CD4+CD28+ T cell counts (p=0.816) (Table 1). The absolute number and percentage of total (CD3+), helper (CD3+ CD4+), (CD3+ CD4+), cytotoxic (CD3+CD8+) T cells and natural killer (CD16+CD56+) cells in peripheral blood were outlined in Table 1. The absolute number and percentage of activated T cells (CD28+, CD38+ and HLA-DR) were also listed in Table 1.
Table 1. Reference range of T lymphocyte subsets in different age groups
| parameters | All | Young | Middle-aged | Elder | p Value | |
|---|---|---|---|---|---|---|
| N=1068 | N=781 | N=246 | N=41 | |||
| Age (years) | Mean ±SD | 40.5±10.04 | 35.4±4.61 | 50.9±4.50 | 71.6±4.53 | - |
| Range | (19-80) | (19-44) | (45-64) | (65-80) | ||
| Sex | Male : Female | 731:337 | 564:217 | 134:112 | 33:8 | 0.000 |
| Lymphocyte counts | Mean ±SD | 2086 ±547 | 2106±535 | 2046±587 | 1946±505 | 0.042 |
| (cells/ul) | 95%CI | 2053-2119 | 2068-2143 | 1972-2119 | 2053-2119 | |
| CD19+ B counts | Mean ±SD | 216 ±99 | 218±97 | 213±106 | 198±112 | 0.383 |
| (cells/ul) | 95%CI | 210-222 | 211-225 | 200-226 | 163-233 | |
| CD19+ B percentage (%) | Mean ±SD | 10.40 ±3.73 | 10.38±3.56 | 10.49±4.02 | 10.17±5.00 | 0.863 |
| 95%CI | 10.18-10.63 | 10.14-10.64 | 9.9810.99 | 8.59-11.75 | ||
| CD16CD56+ NK counts | Mean ±SD | 403 ±220 | 407±215 | 376±214 | 477±305 | 0.012 |
| (cells/ul) | 95%CI | 389-416 | 392-422 | 349-403 | 381-574 | |
| CD16CD56+ NK percentage | Mean ±SD | 19.19 ±8.52 | 19.19±8.10 | 18.38±8.73 | 24.11±12.62 | 0.000 |
| (%) | 95%CI | 18.68-19.70 | 18.62-19.75 | 17.29-19.48 | 20.13-28.09 | |
| CD3+ T counts | Mean SD | 1387 ±414 | 1403±402 | 1368±449 | 1198±399 | 0.006 |
| (cells/ul) | 95%CI | 1362-1412 | 1375-1431 | 1312-1424 | 1071-1323 | |
| CD3+ T percentage | Mean ±SD | 66.44 ±8.58 | 66.62±8.17 | 66.67±8.96 | 61.73±12.12 | 0.002 |
| (%) | 95%CI | 65.93-66.96 | 66.05-67.19 | 65.55-67.80 | 57.91-65.56 | |
| CD3+CD4+T counts | Mean ±SD | 694 ±202 | 690±227 | 708±241 | 699±281 | 0.565 |
| (cells/ul) | 95%CI | 680-708 | 674-706 | 677-738 | 610-787 | |
| CD3+CD4+/CD3+ | Mean ±SD | 33.48 ±7.33 | 32.91±6.95 | 34.89±7.80 | 35.81±9.80 | 0.000 |
| (%) | 95%CI | 33.04-33.92 | 32.43-33.40 | 33.91-35.87 | 32.72-38.90 | |
| CD3+CD8+T counts | Mean ±SD | 589 ±244 | 605±234 | 561±269 | 448±235 | 0.000 |
| (cells/ul) | 95%CI | 574-604 | 589-621 | 528-595 | 374-522 | |
| CD3+CD8+/CD3+ | Mean ±SD | 27.96 ±7.67 | 28.52±7.27 | 26.97±8.12 | 23.09±9.91 | 0.000 |
| (%) | 95%CI | 27.50-28.42 | 28.01-29.03 | 25.96-27.99 | 19.96-26.21 | |
| CD4+CD45RA- | Mean ±SD | 430 ±156 | 419±147 | 459±168 | 472±212 | 0.000 |
| (cells/ul) | 95%CI | 421-440 | 408-429 | 438-480 | 406±539 | |
| CD4+CD45RA-/CD4+ | Mean ±SD | 62.81 ±11.94 | 61.52±11.17 | 65.282±12.72 | 69.28±15.77 | 0.000 |
| (%) | 95%CI | 62.09-63.52 | 60.73-62.30 | 64.23-67.42 | 64.30-7.25 | |
| CD4+CD45RA+ | Mean ±SD | 264 ±138 | 271±133 | 249±147 | 226±165 | 0.000 |
| (cells/ul) | 95%CI | 256-272 | 262-280 | 230-267 | 174-278 | |
| CD4+CD45RA+/CD4+ | Mean ±SD | 37.19 ±11.94 | 38.48±11.17 | 34.18±12.72 | 30.73±15.78 | 0.017 |
| (%) | 95%CI | 36.48-37.91 | 37.70-39.27 | 32.58-35.77 | 25.74-35.71 | |
| CD4+CD45RA+CD62L+ | Mean ±SD | 240 ±129 | 247±125 | 221±132 | 206±160 | 0.004 |
| (cells/ul) | 95%CI | 232-247 | 239-256 | 204-237 | 156-256 | |
| CD4+CD45RA+CD62L+/CD4+ | Mean ±SD | 33.87±11.80 | 35.24±11.16 | 30.55±12.16 | 27.82±15.41 | 0.000 |
| (%) | 95%CI | 33.17-34.58 | 34.45-36.02 | 29.03-32.08 | 22.95-32.68 | |
| CD4+CD28+ | Mean ±SD | 617 ±210 | 619±206 | 616±212 | 597±271 | 0.816 |
| (cells/ul) | 95%CI | 604-630 | 604-633 | 589-642 | 512-683 | |
| CD4+CD28+/CD4+ | Mean ±SD | 89.18 ±8.44 | 89.88±7.47 | 87.56±10.01 | 85.59±12.52 | 0.000 |
| (%) | 95%CI | 88.68-89.69 | 89.36-90.41 | 86.30-88.82 | 81.64-89.54 | |
| CD8+CD28+ | Mean ±SD | 329 ±132 | 348±129 | 290±121 | 191±115 | 0.000 |
| (cells/ul) | 95%CI | 321-337 | 339-357 | 274-305 | 155-228 | |
| CD8+CD28+/CD8+ | Mean ±SD | 57.71 ±14.17 | 59.41±13.38 | 54.76±14.86 | 43.16±13.50 | 0.000 |
| (%) | 95%CI | 56.86-58.56 | 58.47-60.35 | 52.89-56.62 | 38.90-47.42 | |
| CD8+HLA-DR+ | Mean ±SD | 135 ±98 | 130±97 | 148±102 | 145±92 | 0.038 |
| (cells/ul) | 95%CI | 129-141 | 124-137 | 135-161 | 116-174 | |
| CD8+HLA-DR+/CD8+ | Mean ±SD | 22.38 ±11.08 | 20.78±10.55 | 25.77±11.18 | 32.59±10.34 | 0.000 |
| (%) | 95%CI | 21.72-23.05 | 20.04-21.52 | 24.37-27.18 | 29.33-35.85 | |
| CD8+CD38+ | Mean ±SD | 184 ±111 | 202±112 | 149±92 | 57±49 | 0.000 |
| (cells/ul) | 95%CI | 178-191 | 194-210 | 138-161 | 42-73 | |
| CD8+CD38+/CD8+ | Mean ±SD | 31.91 ±14.49 | 34.05±13.53 | 28.25±15.35 | 13.02±6.75 | 0.000 |
| (%) | 95%CI | 31.04-32.78 | 33.10-35.00 | 26.32-30.18 | 10.89-15.15 | |
| CD4+/CD8+ | Mean ±SD | 1.32 ±0.59 | 1.25±0.48 | 1.45±0.69 | 1.91±1.19 | 0.000 |
| (%) | 95%CI | 1.29-1.36 | 1.22-1.29 | 1.37-1.54 | 1.54-2.29 | |
CD16+CD56+ NK cell and CD19+ B cell keep balance with older ages
NK cell counts in peripheral blood of the elderly seemed slightly higher than that of younger people in Table 1. However, further correlation analysis found that age did not influence NK cells (counts: r=0.041 p=0.18; per-centage=0.001 p=0.977) or B cells (counts: r=−0.041, p=0.181; percentage=−0.005 p=0.86) significantly in our study.
CD3+ T cell counts, CD3+CD8+ T cell counts, CD4+ CD45RA+ T cell counts, CD4+ CD45RA+CD45SRA+ CD62L+ T cell counts, CD4+CD28+ /CD4+ ratio and CD8+CD28+ /CD8+ ratio decrease with older ages
A trend of decrease in CD3+ T cell counts (r=−0.103, p=0.001, Figure 1A), CD3+CD8+ T cell counts (r=−0.154, p<0.001, Figure 1B), CD4+CD45RA+ T cell counts(r=−0.175, p<0.001, Figure 1C), CD4+ CD45RA+CD62L+ T cell counts(r=−0.182, p<0.001, Figure 1D), CD4+CD28+ /CD4+ ratio (r=−0.136, p<0.001, Figure 1E) and CD8+CD28+/CD8+ ratio (r=−0.197, p<0.001, Figure 1F) was observed with increased age. An increase trend with aging in CD4+/CD8+ ratio (r=0.160, p<0.001) was showed in our study.
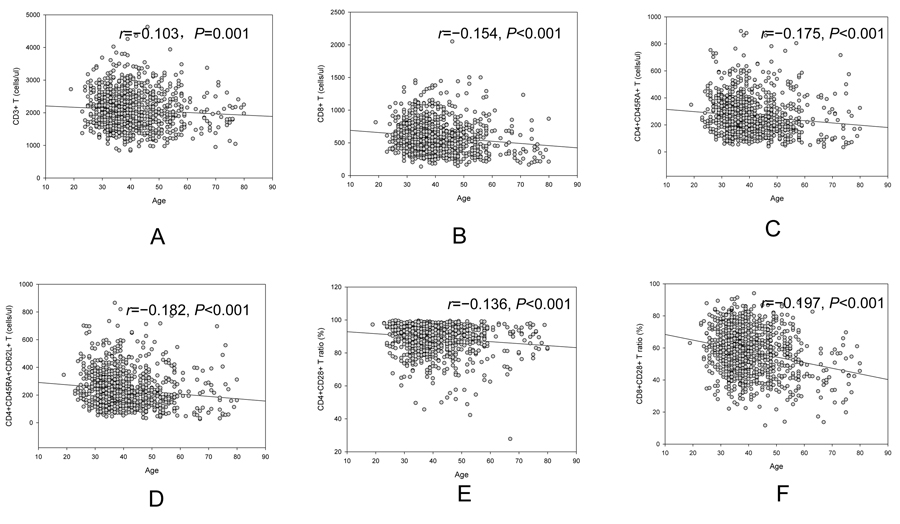
Figure 1. Age related change of CD3+ cell (A), CD3+CD8+ (B), CD4+CD45RA+ cell (C), CD4+CD45RA+CD62L+ cell (D), CD4+CD28+ /CD4+ (E) and CD8+CD28+/CD8+ (F).
A reverse age related trend in CD4+CD45RA+ T cell counts and CD4+CD45RA− T cell counts, CD8+HLA-DR/CD8+ ratio and CD8+CD38+/CD8+ ratio
Overall, there was a decrease age related trend of CD4+CD45RA+ T cell counts (r=−0.175, p<0.001, Figure 2A), but an increase age related trend of CD4+CD45RA− T cell counts (r=0.147, p<0.001, Figure 2B). Another reverse trend for CD8+HLA-DR/CD8+ ratio (r=0.288, p<0.001, Figure 2C) and CD8+CD38+/CD8+ ratio (r=−0.333, p<0.001, Figure 2D) was also showed in figure 2.
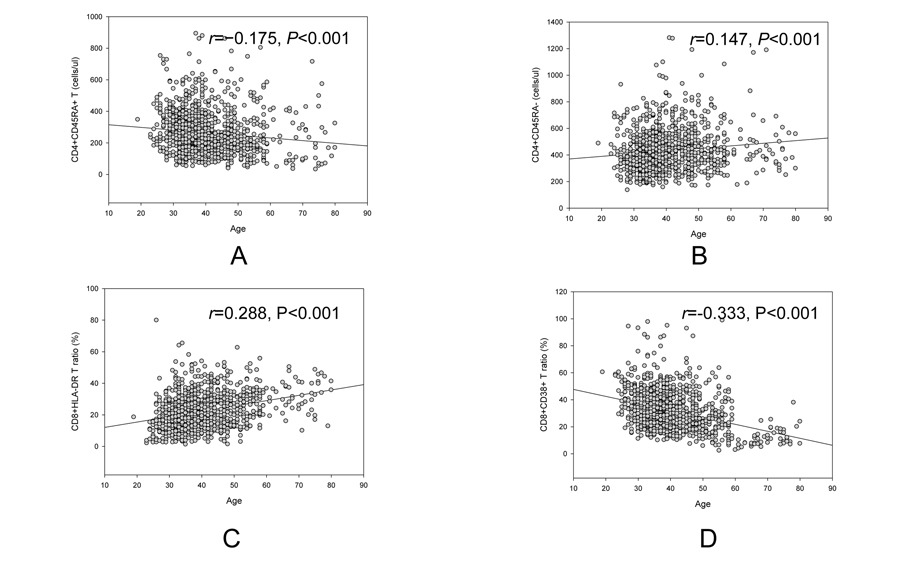
Figure 2. Reverse age related trend of naive CD4+ (A) and memory CD4+ (B), CD8+HLA-DR ratio (C) and CD8+CD38+ ratio (D).
Age related changes by every 10 years for lymphocyte subsets
For further comparisons, we divided the subjects by every 10 years, as shown in Table 2. We further observed the age-related changes by every 10 years for lymphocyte subsets (Figure 3). Although similar trends were obtained for all parameters, fluctuation could be observed in different parts of the curves.
Table 2. Age distribution by every decade
| Younger than 25 | 25—34 | 35—44 | 45—54 | 55—64 | 65—74 | 75 and above | |
|---|---|---|---|---|---|---|---|
| number | 7 | 312 | 462 | 186 | 60 | 28 | 13 |
| % in whole | 0.65 | 29.21 | 43.26 | 17.42 | 5.62 | 2.62 | 1.22 |
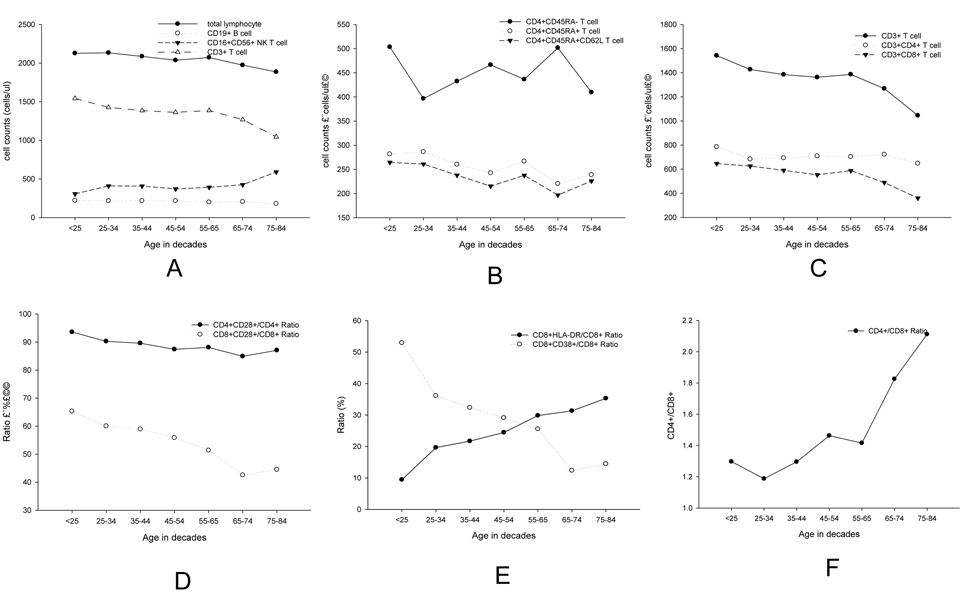
Figure 3. Linear diagrams showed age-related changes by decade for lymphocyte subsets of (A) total lymphocyte cells, CD19+ (B) cell, CD16CD56+ NK cell and CD3+ T cell B CD3+ T cell, CD4+ T cell and CD8+ T cell; (C) CD4+CD45RA−, CD4+CD45RA+ and D4+CD45RA+CD62L+ (D) CD4+CD28+, CD8+CD28+ (E) CD8+HLA.DR+/CD8+ and CD8+CD38+/CD8+ (F) CD4+/CD8+.
Gender influence on the fluctuation of lymphocyte subsets
As the gender was unbalanced among the three cohorts, we compared the counts and percentage of lymphocyte subsets. Most parameters were comparable between genders, except for the NK cells, B cells, CD3+T cells, CD3+CD8+ T cells, CD8+CD28+ T cells, CD8+HLA-DR and CD4+/CD8+ ratio (Table 3). The analysis showed that certain T cell subsets were affected by gender. Therefore, we use multivariate logistic regression to assess the age related variation for lympho-cytes subsets (Table 4). Age did not seem to influence CD4+ T cell counts, B cell counts and percentage, NK cell counts and percentage, and CD4+CD28+ T cell counts significantly in our study. However, for the majority of the parameters, such as CD4+/CD8+ ratio, the percentage of CD3+CD4+ T cells and CD4+CD28+ T cells, the absolute counts and percentage of CD3+T cells, CD3+CD8+ T cells, CD4+CD45RA+ T cells, CD45+CDRA− T cells, CD45+CD45RA+CD62L+ T cells, CD8+CD28+ T cells, CD8+HLA-DR and CD8+CD38+, significant relation with aging were observed in Table 4.
Table 3. Reference range of T lymphocyte subsets in different gender
| Male | Female | ||||
|---|---|---|---|---|---|
| Parameters | Mean ±SD | 95%CI | Mean ±SD | 95%CI | p value(M&F) |
| CD19+ B counts (cells/ul) | 223.5±105.40 | 129.95-315.75 | 215.7±98.45 | 121.31-276.50 | 0.001 |
| CD19+ B percentage (%) | 10.2±3.63 | 6.55-13.84 | 10.3±3.59 | 7.13-14.20 | 0.031 |
| CD16+CD56+ NK counts(cells/ul) | 448.0±223.25 | 244.49-650.87 | 407.5±216.91 | 160.72-470.68 | <0.001 |
| CD16+CD56+ NK percentage (%) | 20.4±8.33 | 12.20-28.81 | 19.3±8.21 | 9.62-23.73 | <0.001 |
| CD3+ T counts (cells/ul) | 1438.6±418.98 | 1031.80-1845.75 | 1394.0±417.15 | 916.46-1672.80 | <0.001 |
| CD3+ T percentage (%) | 65.4±8.57 | 56.55-74.40 | 66.4±8.39 | 60.62-76.35 | <0.001 |
| CD3+CD4+ counts (cells/ul) | 696.0±232.80 | 478.02-912.79 | 688.2±228.78 | 466.85-874.61 | 0.139 |
| CD3+CD4+/CD3+ (%) | 31.8±6.83 | 24.88-38.74 | 33.0±6.94 | 29.21-42.21 | <0.001 |
| CD3+CD8+ counts (cells/ul) | 631.1±254.60 | 389.50-873.19 | 597.5±246.38 | 328.11-716.92 | <0.001 |
| CD3+CD8+/CD3+ (%) | 28.5±7.92 | 20.64-36.40 | 28.2±7.60 | 20.70-34.31 | 0.125 |
| CD4+CD45RA− (cells/ul) | 429.0±156.34 | 286.61-570.10 | 424.6±150.57 | 289.36-541.15 | 0.347 |
| CD4+CD45RA−/CD4+ (%) | 62.3±11.53 | 50.07-74.79 | 62.5±11.50 | 51.16-74.96 | 0.390 |
| CD4+CD45RA+ (cells/ul) | 267.0±133.68 | 142.48-391.46 | 263.6±134.54 | 133.24-377.01 | 0.143 |
| CD4+CD45RA+/CD4+ (%) | 37.7±11.53 | 25.61-49.91 | 37.5±11.50 | 25.04-49.13 | 0.413 |
| CD4+CD45RA+CD62L+ (cells/ul) | 242.8±124.86 | 126.60-359.19 | 240.0±126.47 | 117.93-347.58 | 0.160 |
| CD4+CD45RA+CD62L+/CD4+ (%) | 34.4±11.48 | 22.26-46.82 | 34.2±11.45 | 21.95-45.72 | 0.470 |
| CD4+CD28+ (cells/ul) | 616.5±204.90 | 423.33-808.88 | 611.5±205.14 | 410.02-790.52 | 0.228 |
| CD4+CD28+/CD4+ (%) | 89.1±8.38 | 79.76-98.40 | 89.2±8.16 | 80.89-98.14 | 0.425 |
| CD8+CD28+ (cells/ul) | 349.9±132.85 | 221.31-479.19 | 336.0±130.06 | 189.24-422.56 | <0.001 |
| CD8+CD28+/CD8+ (%) | 57.7±14.01 | 43.00-72.51 | 58.4±13.80 | 45.18-75.25 | 0.017 |
| CD8+HLA-DR (cells/ul) | 147.3±102.74 | 58.20-236.70 | 138.0±99.20 | 47.78-184.00 | <0.001 |
| CD8+HLA-DR/CD8+ (%) | 22.7±10.74 | 11.94-33.92 | 22.4±10.72 | 11.65-32.10 | 0.267 |
| CD8+CD38+ (cells/ul) | 191.6±111.9 | 99.28-280.28 | 190.0±108.43 | 95.84-277.46 | 0.535 |
| CD8+CD38+/CD8+ (%) | 31.2±13.16 | 18.91-43.27 | 32.7±13.74 | 22.61-50.00 | 0.552 |
| CD4+/CD8+ ratio (%) | 1.2±0.54 | 0.75-1.71 | 1.3±0.54 | 0.93-1.87 | <0.001 |
Table 4. Relationship between age and T lymphocyte subsets in regression analysis
| Age & T lymphocyte subsets | Unstandardized coefficient | Standard Error | p value |
|---|---|---|---|
| CD19+ B counts | −6.129 | 5.667 | 0.280 |
| CD19+ B percentage | −0.409 | 0.212 | 0.818 |
| CD16CD56+ NK counts | 8.708 | 12.083 | 0.471 |
| CD16CD56+ NK percentage | 0.987 | 0.474 | 0.057 |
| CD3+ T counts | −56.889 | 23.432 | 0.015 |
| CD3+ T percentage | −1.329 | 0.482 | 0.006 |
| CD3+CD4+T counts | 12.45 | 13.28 | 0.349 |
| CD3+CD4+T percentage | 1.427 | 0.402 | 0.000 |
| CD3+CD8+T counts | −52.044 | 13.611 | 0.000 |
| CD3+CD8+T percentage | −2.010 | 0.433 | 0.000 |
| CD4+CD45RA- | 34.761 | 8.856 | 0.000 |
| CD4+CD45RA− percentage | 4.12 | 0.67 | 0.000 |
| CD4+CD45RA+ | −22.304 | 7.841 | 0.005 |
| CD4+CD45RA+ percentage | −4.119 | 0.670 | 0.000 |
| CD4+CD45RA+CD62L+ | −23.870 | 7.391 | 0.001 |
| CD4+CD45RA+CD62L+ percentage | −4.239 | 0.662 | 0.000 |
| CD4+CD28+ | −6.776 | 12.015 | 0.573 |
| CD4+CD28+/CD4+ | −2.333 | 0.476 | 0.000 |
| CD8+CD28+ | −65.54 | 7.214 | 0.000 |
| CD8+CD28+/CD8+ | −6.501 | 0.781 | 0.000 |
| CD8+HLA-DR+ | 15.939 | 5.522 | 0.004 |
| CD8+HLA-DR+/CD8+ | 5.625 | 0.606 | 0.000 |
| CD8+CD38+ | −62.639 | 6.036 | 0.000 |
| CD8+CD38+/CD8+ | −8.518 | 0.765 | 0.000 |
| CD4+/CD8+ | 0.248 | 0.033 | 0.000 |
Discussion
The aging process seems to alter both branches of the immune system, the innate and the adaptive, in different ways. While the adaptive immune response undergoes profound age-dependent modifications [3], innate immunity has been considered to be better preserved globally [5]. In this study, we showed series of changes in lymphocyte subsets that accompany human aging.
CD3+ T lymphocytes decrease with aging
Age-related decrease occurred in CD3+ T cell and CD3+CD8+ T cell count, but not in CD3+CD4+ T cell count in our study. Although the CD3+CD4+ T cell count had maintained balance in different age subgroup, but age-related reverse trends of naïve CD4+ T and memory CD4+ T lymphocyte were also clearly displayed. In our analysis, CD4+CD45RA+ CD62L+ T cell, a naïve CD4+ T cell subset, showed age-related decrease. The thymus is a primary lymphoid organ that plays a crucial role in the development of T lymphocytes by providing a suitable microenvironment where these cells can proliferate, rearranging the T cell receptor (TCR) and maturate to mount an adequate immune response against foreign pathogens and tumor cells. Throughout the lifetime it provides a continuous supply of naive T cells, though shortly after the start of youth, a reduction in the overall thymic size and a replacement of the functional tissue by fat begin to take place, resulting in increasingly fewer naive T cells exit to the periphery [13].
Thymic involution may represent a mechanism of maintaining a sufficiently diverse repertoire to combat a variety of potential pathogens and avoid autoimmune reactions. The possible reasons of thymus involution may be the blocking of TCR gene rearrangement, self-peptide MHC decreased molecules [14], and loss of T cell progenitors [15]. The dynamic processes of repeated interaction with cognate antigens lead to multiple division cycles involving a high degree of cell differentiation, senescence, restriction of the TCR repertoire, and cell cycle arrest [16]. This cell cycle arrest is associated with the loss of telomere sequences from the ends of chromosomes. Telomere length is reduced at each cell cycle, and critically short telomeres recruit components of the DNA repair machinery and trigger replicative senescence or apoptosis [17]. Stimulated T cells become refractory to telomerase induction, suffer from telomere erosion and enter into replicative senescence [18]. As a consequence, the number of CD3+ T cells, especially naive T cells, exiting the thymus is dramatically decreased with aging.
Both naïve CD4+ and CD8+ T lymphocytes arise from the thymus, but the behavior of naive T cells is different in CD4+ and CD8+ compartments, where naive CD4+ T cells modestly decline with age, while naive CD8+ T cells plummet at the earlier stage of life[19]. This indicated that in the absence of significant thymic influx, the rolling over of naive CD4+ T cells is sufficiently sustained for another two to three decades by homeostatic proliferation. The mechanism of this rapid decline in naïve CD8+ T lymphocytes remains unknown. Several studies have proposed that different growth factors and cytokines may be involved in regulating the two distinct populations of lymphocytes [20]. Senescence of the naïve CD8+ subpopulation take place even earlier in life, which may explain the fact that age-related decrease of CD3+CD8+ T cells occurs earlier than that of CD3+CD4+ T cells.
Variable CD8+ T cell activation markers accompanied with aging
A significant increase of CD8+HLA-DR/CD8+ and a decrease trend of CD8+ CD38+ /CD8+ with aging were noted in our analysis, in accordance with previous report [26]. CD38 was identified in the late 1970s, and involved in antigen recognition. CD38 was initially found on thymocytes and T lymphocytes, later the molecule was found throughout the immune system, although its expression levels vary. Because of this, CD38 was considered an ‘activation marker’ a term still popular in routine flow cytometry. CD38 plays dual roles as receptors and ectoenzymes, endowed with complex activities related to signaling and cell homeostasis. An initial function attributed to CD38 was the regulation of activation and proliferation of human T lymphocytes. Otherwise, CD38 is a multifunctional enzyme that catalyzes the synthesis of cyclic ADP ribose (cADPR) which is involved in regulation of cytoplasmic Ca2+ influxes, activating signaling pathways critical for several biological processes [27]. High ratios of CD38+/CD8+T lymphocytes predict disease progression and strong immunosuppressive status in HIV-infected adults [28]. Immune senescence in HIV infection patients is clinically characterized by increased expression of CD38, apparently not directly caused by the infection [29]. CD38 expression has been also matter of technological debate, in terms of monoclonal antibody used in HIV patients. CD38 is also reported as target of autoantibodies in diabetes mellitus [30] and SLE.
The knowledge of CD8+CD38+ or CD8+HLA-DR role is still very poor in the aging process and most studies were conducted in HIV infected individuals. High proportions of CD38+CD8+ T cells were considered as a marker of poor response to therapy and prognosis in AIDS [31]. As a marker of T cell activation, CD38+ expression on T cells could predict acute graft versus host disease [32]. However, the mechanism of age related changes of T activation marker, CD38 or HLA-DR, still remains unclear.
NK cells and B cells
The age-related increase of NK cells is well documented and the detailed cytofluorimetric analysis allowed us to demonstrate an age-related increase of cells with high NK activity [33]. However, we did not observe such the above mentioned phenomenon or any relationship between age and NK cells or B cells.
Age has been reported to be associated with changes in the numbers, phenotype and function of NK cells. In healthy elderly individuals, the age-associated increasing of NK cell counts and remodeling of NK cell subsets has been described characterized by a decreased percentage of the more immature CD56bright NK cells and an increase of CD56− NK cells[34]. B cell is always considered as antibody producers, but they are also highly effective as antigen presenting cells, and essential for the development of memory T-cell. Although B cell counts were not significantly changed during long lifetime, the collapse in B cell diversity had been found easily [35]. Some very old individuals show a dramatic reduction in B cell diversity which is linked to frailty. The collapse of diversity is a strongly predictor of poor health status in elderly people [36].
The variation of lymphocyte subsets counts in different area
The reference values of the main circulating lymphocyte subsets have been established by many studies throughout the world, and have shown some variability according to specific locations (Table 5). The data of lymphocyte subsets in Chinese adults are different from those of people in other areas of the world, probably due to difference in races, antigen exposure and living environments. We closely apply flow cytometry analysis techniques to describe lymphocyte repertoires in a group (>1000 persons) of Chinese adults with wide age range. The valid comparison of lymphocyte subsets analysis, using the same flow cytometry methods, should be made between our data and other countries' data in the population with similar age reference range and sex ratio (Table 5). It seems that the genetic, nutrition and environmental variations between populations in different area might be possible causes of the differences in lymphocyte subsets. Our results suggested that region reference ranges for lymphocyte subsets were necessary.
Table 5. comparison lymphocyte subsets of present study with other studies
| Area | country | Year | Num | Age range | Male: Female | CD3+ CD4+ | CD3+ CD8+ | CD4+/CD8+ ratio | CD16+CD56+ | CD19+ |
|---|---|---|---|---|---|---|---|---|---|---|
| (years) | (cells/ul) | (cells/ul) | (cells /ul) | (cells /ul) | ||||||
| Asia | China | Present | 1068 | 19-80 | 731:337 | 694 | 589 | 1.32 | 403 | 216 |
| motherland | study | |||||||||
| Singapore | 2004 | 232 | 10-69 | 104:128 | 838 | 642 | 1.43 | 419 | 353 | |
| Iran | 2011 | 233 | 20-45 | 150:83 | 827 | 522 | 1.61 | 248 | 332 | |
| HongKong | 2013 | 273 | 17-59 | 150:123 | 760 | 515 | 1.59 | 229 | 298 | |
| Korea | 2014 | 294 | 33-61 | 139:155 | 787 | 479 | 1.81 | 300 | 203 | |
| Africa | Ethiopia | 1999 | 485 | 15-45 | 280:205 | 775 | 747 | 1.2 | 250 | 191 |
| Nigeria | 2009 | 2570 | 18-80 | 1363:1207 | 847 | 435 | 2.3 | - | - | |
| Morocoan | 2012 | 242 | 19-49 | 220:22 | 871 | 637 | 1.37 | 211 | 59 | |
| Kenyan | 2013 | 315 | 16-60 | 222:85 | 920 | 646 | 1.57 | - | - | |
| America | Mexico | 2013 | 400 | 20-40 | 200:200 | 818 | 528 | 1.5 | - | - |
| Florida | 2014 | 50 | 31-67 | 25:25 | 1003 | 590 | 1.8 | 214 | 256 | |
| Brazil | 2015 | 238 | 16-56 | 134:104 | 844 | 555 | 1.52 | 234 | 252 | |
| Europe | Italy | 1999 | 968 | 18-70 | 532:436 | 940 | 551 | 1.71 | 278 | 230 |
| Switzerland | 2004 | 70 | 24-70 | 44:26 | 691 | 343 | 2.1 | 184 | 170 | |
| German | 2005 | 100 | 19-85 | 50:50 | 870 | 460 | 1.9 | 280 | 220 |
Materials and Methods
Subjects
All the subjects were healthy volunteers recruited between February 2007 and July 2011, with ages from 18 to 80 years old. The recruitment was strictly conducted according to the defined criteria from the SENIEUR protocol guideline [39, 40]. Subjects testing positive to HIV, systemic infection, connective tissue disease, abnormal tumor marker or cancer were excluded. Informed consent was obtained from all subjects, and the Ethical Committee of Peking Union Medical College Hospital approved this study. According to the definition by the National Health and Family Planning Commission of the People's Republic of China, the subjects were classified as elderly (≥65), middle-aged (45-64), and young (18-44) adults.
Lymphocyte immunophenotyping
Immunophenotyping of peripherial blood lymphocytes was analyzed by three-color flow cytometry (Epics XL flow cytometry; Bechman Coulter, USA) as previously described [41-42]. Freshly collected EDTA-anticoagulated whole blood was incubated and tested with a panel of monoclonal antibodies directed against fluorescein isothiocyanate/phycoerythrin/peridinin chlorophyll protein combinations of CD3/CD8/CD4, CD3/CD16CD56/CD19, HLA-DR/CD38/CD8, CD28/CD8/CD4, CD62L/CD45RA/CD4 and isotype controls (Immunotech, France). Cell counts of lymphocyte subsets were calculated using a dual-platform method with the white blood cell counts and lymphocyte differentials obtained from blood routine tests of the same specimen.
Statistical analysis
Statistical analysis was performed using SPSS software (SPSS® for Windows™ version 13.0, SPSS Inc., Chicago, IL, USA). Kolmogorov-Smirnov was used for the distribution test. Reference ranges were calculated using mean ± 2 standard deviation for parametric data and 2.5% and 97.5% percentiles for non-parametric data. Comparisons among three variables were performed using one-way analysis of variance. Genders were compared using t-test for parametric data and Mann–Whitney test for non-parametric data. As gender was a significant determinant of fluctuation of T lymphocyte subset, multiple linear logistic regression was used for analyzing the relation between aging and T lymphocyte subsets. Association between variables and age was tested using a non-parametric Spearman's rank correlation test. Probability value was obtained from 2-sided tests and P<0.05 was considered statistically significant.
Conclusion
Immunosenescence comprises a set of changes occurring to the peripheral T lymphocyte subsets. In this study, we used flow cytometric immuno-phenotyping to evaluate the counts and percentage of circulating lymphocyte subsets in health young and older adults. Several fluctuations of T lymphocyte subsets accompanied with aging, including decreased naïve CD4+ or CD8+ T cells, increased memory CD4+ or CD8+ T cells, loss CD28 expression on T cell and reverse change trend of CD38+ and HLA-DR, might show clues for immunosenescence of immune system in the further study. Besides that, the establishment of reference ranges for peripheral blood lympho-cyte subsets in healthy adults of different age group might be used to guide clinical evaluation.
Limitation
Firstly, our data had only enrolled lymphocyte subsets of peripheral blood, which contained less than 3% of the total T cells in the body, without analysis that of tissue, such as spleen, lymph node or interstitial muco-sa. Secondly, the percentage of healthy older people enrolled in this study is limit. However, the reliable mapping of human T cells in different decades was reliable in our cohort and the trend of a set of T cell changes accompanied with aging was primarily displayed.
Author Contributions
Conceived and designed the experiments: Taisheng Li. Performed the experiments: Xie Jing and Zhifeng Qiu. Collected and Analyzed the clinical data: Ling Qin, Xie Jing and Yang Jiao. Wrote the paper: Ling Qin. Rigorous review the manuscript: Wei Cao, Taisheng Li and Jean-Pierre Routy.
Acknowledgments
We acknowledge the service received from the Special Care Unit of Peking Union Medical College Hospital in the database building of the healthy population cohort. We are grateful to all the healthy volunteers participating in this study at Peking Union Medical College Hospital.
Funding
This study was supported by grants from the National Major Science and Technology Pillar Program (2014BAI07B06).
Conflicts of Interest
The authors confirm that this article content has no conflicts of interest.
References
- 1. McElhaney JE and Effros RB. Immunosenescence: what does it mean to health outcomes in older adults? Curr Opin Immunol. 2009; 4: 418 -424. [PubMed] .
- 2. Frasca D and Blomberg BB. Effects of aging on B cell function. Curr Opin Immunol. 2009; 4: 425 -430. [PubMed] .
- 3. Haynes L and Maue AC. Effects of aging on T cell function. Curr Opin Immunol. 2009; 4: 414 -417. [PubMed] .
- 4. Weiskopf D, Weinberger B, Grubeck-Loebenstein B. The aging of the immune system. Transpl Int. 2009; 11: 1041 -1050. [PubMed] .
- 5. Le Garff-Tavernier M, Beziat V, Decocq J, Siguret V, Gandjbakhch F, Pautas E, Debre P, Merle-Beral H, Vieillard V. Human NK cells display major phenotypic and functional changes over the life span. Aging Cell. 2010; 4: 527 -535. [PubMed] .
- 6. Gibson KL, Wu YC, Barnett Y, Duggan O, Vaughan R, Kondeatis E, Nilsson BO, Wikby A, Kipling D, Dunn-Walters DK. B-cell diversity decreases in old age and is correlated with poor health status. Aging Cell. 2009; 1: 18 -25. [PubMed] .
- 7. Barnett D, Walker B, Landay A, Denny TN. CD4 immunophenotyping in HIV infection. Nat Rev Microbiol. 2008; 11: Suppl S7 -S15. [PubMed] .
- 8. Nicholson JK. Use of flow cytometry in the evaluation and diagnosis of primary and secondary immunodeficiency diseases. Arch Pathol Lab Med. 1989; 6: 598 -605. [PubMed] .
- 9. Bleesing JJ, Brown MR, Straus SE, Dale JK, Siegel RM, Johnson M, Lenardo MJ, Puck JM, Fleisher TA. Immunophenotypic profiles in families with autoimmune lymphoproliferative syndrome. Blood. 2001; 8: 2466 -2473. [PubMed] .
- 10. Lacombe F, Durrieu F, Briais A, Dumain P, Belloc F, Bascans E, Reiffers J, Boisseau MR, Bernard P. Flow cytometry CD45 gating for immunophenotyping of acute myeloid leukemia. Leukemia. 1997; 11: 1878 -1886. [PubMed] .
- 11. Jalla S, Sazawal S, Deb S, Black RE, Das SN, Sarkar A, Bhan MK. Enumeration of lymphocyte subsets using flow cytometry: Effect of storage before and after staining in a developing country setting. Indian J Clin Biochem. 2004; 2: 95 -99. [PubMed] .
- 12. Chng WJ, Tan GB, Kuperan P. Establishment of adult peripheral blood lymphocyte subset reference range for an Asian population by single-platform flow cytometry: influence of age, sex, and race and comparison with other published studies. Clin Diagn Lab Immunol. 2004; 1: 168 -173. [PubMed] .
- 13. Starr TK, Jameson SC, Hogquist KA. Positive and negative selection of T cells. Annu Rev Immunol. 2003; 139 -176. [PubMed] .
- 14. Lacorazza HD, Guevara PJ, Weksler ME, Radu D, Nikolic-Zugic J. Failure of rearranged TCR transgenes to prevent age-associated thymic involution. J Immunol. 1999; 8: 4262 -4268. [PubMed] .
- 15. Zoller AL, Schnell FJ, Kersh GJ. Murine pregnancy leads to reduced proliferation of maternal thymocytes and decreased thymic emigration. Immunology. 2007; 2: 207 -215. [PubMed] .
- 16. Moro-Garcia MA, Alonso-Arias R, Lopez-Larrea C. Molecular mechanisms involved in the aging of the T-cell immune response. Curr Genomics. 2012; 8: 589 -602. [PubMed] .
- 17. Hodes RJ, Hathcock KS, Weng NP. Telomeres in T and B cells. Nat Rev Immunol. 2002; 9: 699 -706. [PubMed] .
- 18. Blackburn EH. Telomeres and telomerase: their mechanisms of action and the effects of altering their functions. FEBS Lett. 2005; 4: 859 -862. [PubMed] .
- 19. Gupta S, Bi R, Su K, Yel L, Chiplunkar S, Gollapudi S. Characterization of naive, memory and effector CD8+ T cells: effect of age. Exp Gerontol. 2004; 4: 545 -550. [PubMed] .
- 20. Boyman O, Purton JF, Surh CD, Sprent J. Cytokines and T-cell homeostasis. Curr Opin Immunol. 2007; 3: 320 -326. [PubMed] .
- 21. Vallejo AN. CD28 extinction in human T cells: altered functions and the program of T-cell senescence. Immunol Rev. 2005; 158 -169. [PubMed] .
- 22. Fagnoni FF, Vescovini R, Mazzola M, Bologna G, Nigro E, Lavagetto G, Franceschi C, Passeri M, Sansoni P. Expansion of cytotoxic CD8+ CD28- T cells in healthy ageing people, including centenarians. Immunology. 1996; 4: 501 -507. [PubMed] .
- 23. Strioga M, Pasukoniene V, Characiejus D. CD8+ CD28- and CD8+ CD57+ T cells and their role in health and disease. Immunology. 2011; 1: 17 -32. [PubMed] .
- 24. Wikby A, Ferguson F, Forsey R, Thompson J, Strindhall J, Lofgren S, Nilsson BO, Ernerudh J, Pawelec G, Johansson B. An immune risk phenotype, cognitive impairment, and survival in very late life: impact of allostatic load in Swedish octogenarian and nonagenarian humans. J Gerontol A Biol Sci Med Sci. 2005; 5: 556 -565. [PubMed] .
- 25. Weinberger B, Welzl K, Herndler-Brandstetter D, Parson W, Grubeck-Loebenstein B. CD28(−)CD8(+) T cells do not contain unique clonotypes and are therefore dispensable. Immunol Lett. 2009; 1: 27 -32. [PubMed] .
- 26. Jiao Y, Qiu Z, Xie J, Li D, Li T. Reference ranges and age-related changes of peripheral blood lymphocyte subsets in Chinese healthy adults. Sci China C Life Sci. 2009; 7: 643 -650. [PubMed] .
- 27. Quarona V, Zaccarello G, Chillemi A, Brunetti E, Singh VK, Ferrero E, Funaro A, Horenstein AL, Malavasi F. CD38 and CD157: a long journey from activation markers to multifunctional molecules. Cytometry B Clin Cytom. 2013; 4: 207 -217. [PubMed] .
- 28. Giorgi JV, Ho HN, Hirji K, Chou CC, Hultin LE, O'Rourke S, Park L, Margolick JB, Ferbas J, Phair JP. CD8+ lymphocyte activation at human immunodeficiency virus type 1 seroconversion: development of HLA-DR+ CD38- CD8+ cells is associated with subsequent stable CD4+ cell levels. The Multicenter AIDS Cohort Study Group. J Infect Dis. 1994; 4: 775 -781. [PubMed] .
- 29. Dock JN and Effros RB. Role of CD8 T Cell Replicative Senescence in Human Aging and in HIV-mediated Immunosenescence. Aging Dis. 2011; 5: 382 -397. [PubMed] .
- 30. Mallone R, Ortolan E, Baj G, Funaro A, Giunti S, Lillaz E, Saccucci F, Cassader M, Cavallo-Perin P, Malavasi F. Autoantibody response to CD38 in Caucasian patients with type 1 and type 2 diabetes: immunological and genetic characterization. Diabetes. 2001; 4: 752 -762. [PubMed] .
- 31. Vigano A, Saresella M, Villa ML, Ferrante P, Clerici M. CD38+CD8+ T cells as a marker of poor response to therapy in HIV-infected individuals. Chem Immunol. 2000; 207 -217. [PubMed] .
- 32. Khandelwal P, Lane A, Chaturvedi V, Owsley E, Davies S, Marmer D, Filipovich AH, Jordan MB, Marsh RA. Peripheral Blood CD38 Bright CD8 Effector Memory T Cells Predicts Acute Graft-versus-Host Disease. Biol Blood Marrow Transplant. 2015; .
- 33. Facchini A, Mariani E, Mariani AR, Papa S, Vitale M, Manzoli FA. Increased number of circulating Leu 11+ (CD 16) large granular lymphocytes and decreased NK activity during human ageing. Clin Exp Immunol. 1987; 2: 340 -347. [PubMed] .
- 34. Solana R, Campos C, Pera A, Tarazona R. Shaping of NK cell subsets by aging. Curr Opin Immunol. 2014; 56 -61. [PubMed] .
- 35. Gibson KL, Wu YC, Barnett Y, Duggan O, Vaughan R, Kondeatis E, Nilsson BO, Wikby A, Kipling D, Dunn-Walters DK. B-cell diversity decreases in old age and is correlated with poor health status. Aging Cell. 2009; 1: 18 -25. [PubMed] .
- 36. Ligthart GJ, Radl J, Corberand JX, Van Nieuwkoop JA, Van Staalduinen GJ, Van Helmond DJ, Hijmans W. Monoclonal gammopathies in human aging: increased occurrence with age and correlation with health status. Mech Ageing Dev. 1990; 2-3: 235 -243. [PubMed] .
- 37. Jentsch-Ullrich K, Koenigsmann M, Mohren M, Franke A. Lymphocyte subsets' reference ranges in an age- and gender-balanced population of 100 healthy adults--a monocentric German study. Clin Immunol. 2005; 2: 192 -197. [PubMed] .
- 38. Olsen NJ, Viselli SM, Fan J, Kovacs WJ. Androgens accelerate thymocyte apoptosis. Endocrinology. 1998; 2: 748 -752. [PubMed] .
- 39. Ligthart GJ, Corberand JX, Fournier C, Galanaud P, Hijmans W, Kennes B, Muller-Hermelink HK, Steinmann GG. Admission criteria for immunogerontological studies in man: the SENIEUR protocol. Mech Ageing Dev. 1984; 1: 47 -55. [PubMed] .
- 40. Vithayasai V, Sirisanthana T, Sakonwasun C, Suvanpiyasiri C. Flow cytometric analysis of T-lymphocytes subsets in adult Thais. Asian Pac J Allergy Immunol. 1997; 3: 141 -146. [PubMed] .
- 41. Cooper MA, Fehniger TA, Turner SC, Chen KS, Ghaheri BA, Ghayur T, Carson WE, Caligiuri MA. Human natural killer cells: a unique innate immunoregulatory role for the CD56(bright) subset. Blood. 2001; 10: 3146 -3151. [PubMed] .
- 42. Effros RB, Cai Z, Linton PJ. CD8 T cells and aging. Crit Rev Immunol. 2003; 1-2: 45 -64. [PubMed] .