


Introduction
Aging and longevity are intimately associated with functional activity and overall nervous system status. The nervous system has long been suggested as a key tissue that defines lifespan. The influence of the nervous system on lifespan was initially indicated by an observation that increased expression of some genes exclusively in the nervous tissue of transgenic animals resulted in increased lifespan [1, 2]. Later, this finding was supported by the discovery of multiple molecular mechanisms for the impact of the nervous system on lifespan [for review, see 3, 4]. Despite this progress, little is known about how genes that control development and consequently structural properties of the nervous system affect normal lifespan.
The nervous system is important for processing complex information from internal and external sources, which strongly affects aging and longevity of animals. Accordingly, the functionality of the nervous system is crucial for survival. Structural and functional fitness of the nervous system is largely determined by the allelic composition of genes. Earlier, we demonstrated that several genes that encode RNA polymerase II transcription factors and are involved in development of the nervous system affect lifespan variation in Drosophila melanogaster [5-7]. This article presents the results of further study of one of these genes, shuttle craft (stc).
stc encodes an RNA polymerase II transcription factor homologous to human transcription factor NF-X1 [8]. STC protein contains seven copies of a cysteine-rich motif that determines binding specificity to conserved X-box sequence that is present in a variety of eukaryotic genes. In Drosophila, stc is expressed throughout all developmental stages and in adults. In embryos, stc is expressed in the central nervous system, where it is required to maintain the proper morphology of motoneuronal axon nerve routes [8]. stc mutations are lethal at the end of embryogenesis because of an inability of mutants to coordinate the peristaltic muscular contractions required for hatching. In adults, stc expression is highest in ovaries and provides essential maternal contributions to early development: embryos deprived of a maternal source of STC show abnormal development of the ventral nerve cord and misguided migration of motoneuronal axons [9].
In this paper, we demonstrate that a viable stc mutation caused by inserting of a vector construct into the untranslated region of the gene affected lifespan of flies in a sex-specific manner. Four independent reversions of this mutation were accompanied by reversions in lifespan phenotype. In mutant virgin females, both survival curves and age-dependent changes in locomotion indicated that mutation increased lifespan and slowed aging. In mutant mated females, lifespan and reproduction were decreased compared to controls, indicating a lack of tradeoff between these traits. The amount of stc transcript appeared to be substantially increased in mutant embryos but not in larvae and adult females of any age, whether virgin or mated. This result led us to hypothesize that lifespan might depend on gene function during early development.
Results
Reversions
A control line (control) with the genotype w1118 and a line with the stc mutation, w1118; P{SUPor-P}stcKG01230 (stcP, Figure 1A) were used in this study. Four lines with reversions of the w+ marker phenotype (rev1, rev3, rev4, rev5) were obtained from stcP using standard substitution crosses with balancer chromosomes and the delta 2-3 source of P element transposase [10]. For each line, PCR with primers surrounding the site of the initial P{SUPor-P} insertion were used to assess the nature of reversions. PCR fragment sizes were identical in the control line and in all lines with reversions (Figure 1B), indicating precise excisions of the P{SUPor-P} construct. This was further confirmed by sequencing PCR fragments: all sequences were identical to the standard gene sequence (http://flybase.org). To confirm that excisions did not cause regional aberrations, two additional PCR reactions with primers that amplified approximately 2.5 kb on both sides of the insertion site were made for each line; no deviations from the control line were observed in any line (Figures 1C, D). Thus, in all four lines, the vector construct was precisely excised from the insertion site and complete restoration of the original gene structure was achieved. Negative results were obtained for all six lines (control, stcP, rev1, rev3, rev4, rev5) in a test for the presence of Wolbachia, a Drosophila symbiont known to affect life history traits [11].
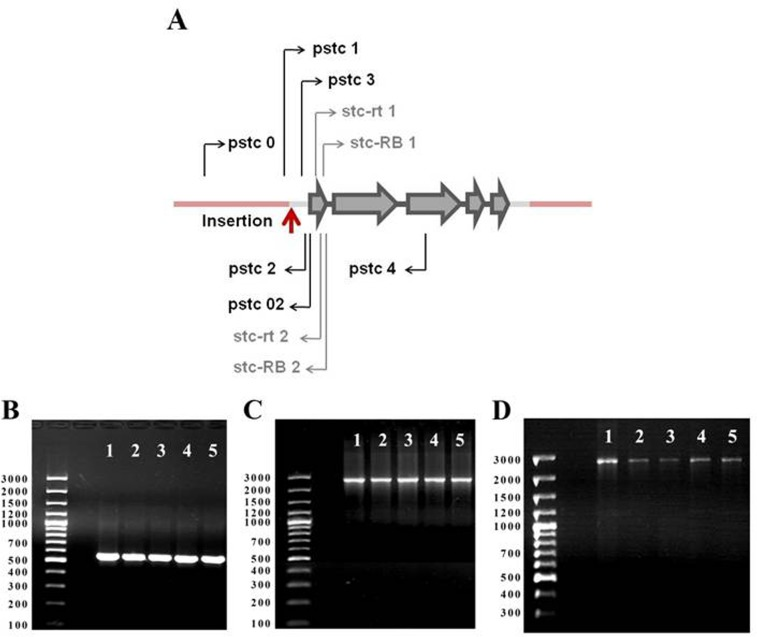
Figure 1. stc gene map and PCR analysis of stc structure in revertant lines. (A) stc gene map. Gray arrows: exons; black sections:introns; gray sections: untranslataed regions; pink sections: background sequences; red arrow: P{SUPor-P}stcKG01230 insertion site; black arrows: primers used for PCR; gray arrows: primers used for Real Time RT-qPCR. (B) PCR with primers pstc1 and pstc2 (expected product size 555 bp); (C) PCR with primers pstc0 and pstc02 (expected product size 2508 bp); (D) PCR with primers pstc3 and pstc4 (expected product size 2562 bp). 1: control line; 2: rev1, 3: rev3, 4: rev4; 5: rev5.
Lifespan
We assessed the effect of the stcKG01230 mutation on lifespan relative to control and reversion lines in unmated and mated females and males. For each experiment, we calculated the following parameters: mean lifespan, median lifespan, minimum and maximum lifespan, lifespan lower and upper quartiles, lifespan of the 10th and 90th percentiles; variance, standard deviation, and standard error for the mean lifespan (Table 1). Figures 2, 3 show survival curves.
Table 1. Distributive statistics of the lifespan
| Exp. No | Line | N | Mean | Median | Minimum | Maximum | Lower Quartile | Upper Quartile | Percentile 10 | Percentile 90 | Variance | Standard Deviation | Standard Error | P values for comparisons with stcP line | |||||||||||||||||||||||||||||||||||||||||||||||||||||||||||||||||||||||||||||||||||||
|---|---|---|---|---|---|---|---|---|---|---|---|---|---|---|---|---|---|---|---|---|---|---|---|---|---|---|---|---|---|---|---|---|---|---|---|---|---|---|---|---|---|---|---|---|---|---|---|---|---|---|---|---|---|---|---|---|---|---|---|---|---|---|---|---|---|---|---|---|---|---|---|---|---|---|---|---|---|---|---|---|---|---|---|---|---|---|---|---|---|---|---|---|---|---|---|---|---|---|---|
| t-test | Kruskal-Wallis test | Kolmogor ov-Smimov test | |||||||||||||||||||||||||||||||||||||||||||||||||||||||||||||||||||||||||||||||||||||||||||||||||
| Unmated females | |||||||||||||||||||||||||||||||||||||||||||||||||||||||||||||||||||||||||||||||||||||||||||||||||||
| 1 | Control | 100 | 56 | 56 | 18 | 82 | 46 | 70 | 30 | 77 | 276.48 | 16.63 | 1.66 | 0.0488 | 0.0224 | 0.0366 | |||||||||||||||||||||||||||||||||||||||||||||||||||||||||||||||||||||||||||||||||||
| stcP | 100 | 61 | 64 | 11 | 90 | 46 | 78 | 35 | 81 | 346.83 | 18.62 | 1.86 | |||||||||||||||||||||||||||||||||||||||||||||||||||||||||||||||||||||||||||||||||||||||
| rev1 | 100 | 54 | 58 | 19 | 87 | 39 | 68 | 28 | 75 | 320.1 | 17.89 | 1.79 | 0.018 | 0.0143 | 0.0158 | ||||||||||||||||||||||||||||||||||||||||||||||||||||||||||||||||||||||||||||||||||||
| rev3 | 100 | 57 | 59 | 10 | 85 | 41 | 70 | 32 | 77 | 298.8 | 17.29 | 1.73 | 0.1126 | 0.0533 | 0.0243 | ||||||||||||||||||||||||||||||||||||||||||||||||||||||||||||||||||||||||||||||||||||
| rev4 | 100 | 52 | 52 | 24 | 72 | 46 | 60 | 38 | 66 | 105.89 | 10.29 | 1.03 | 0.0001 | 0.0001 | 0.0001 | ||||||||||||||||||||||||||||||||||||||||||||||||||||||||||||||||||||||||||||||||||||
| rev5 | 100 | 55 | 58 | 18 | 74 | 50 | 63 | 40 | 68 | 124.33 | 11.15 | 1.12 | 0.0191 | 0.0042 | 0.0001 | ||||||||||||||||||||||||||||||||||||||||||||||||||||||||||||||||||||||||||||||||||||
| 2 | Control | 100 | 56 | 58 | 4 | 83 | 53 | 68 | 31 | 71 | 265.65 | 16.3 | 1.63 | 0.0001 | 0.0001 | 0.0001 | |||||||||||||||||||||||||||||||||||||||||||||||||||||||||||||||||||||||||||||||||||
| stcP | 100 | 66 | 74 | 14 | 87 | 58 | 77 | 44 | 81 | 277.02 | 16.64 | 1.66 | |||||||||||||||||||||||||||||||||||||||||||||||||||||||||||||||||||||||||||||||||||||||
| rev1 | 100 | 57 | 58 | 10 | 79 | 48 | 68 | 40 | 75 | 202.44 | 14.23 | 1.42 | 0.0001 | 0.0001 | 0.0001 | ||||||||||||||||||||||||||||||||||||||||||||||||||||||||||||||||||||||||||||||||||||
| rev3 | 100 | 55 | 59 | 17 | 75 | 46 | 64 | 38 | 70 | 161.35 | 12.7 | 1.27 | 0.0001 | 0.0001 | 0.0001 | ||||||||||||||||||||||||||||||||||||||||||||||||||||||||||||||||||||||||||||||||||||
| rev4 | 100 | 55 | 56 | 27 | 76 | 50 | 61 | 46 | 66 | 73.04 | 8.55 | 0.85 | 0.0001 | 0.0001 | 0.0001 | ||||||||||||||||||||||||||||||||||||||||||||||||||||||||||||||||||||||||||||||||||||
| rev5 | 100 | 51 | 51 | 20 | 78 | 42 | 58 | 38 | 64 | 113.75 | 10.67 | 1.07 | 0.0001 | 0.0001 | 0.0001 | ||||||||||||||||||||||||||||||||||||||||||||||||||||||||||||||||||||||||||||||||||||
| 3 | Control | 100 | 56 | 60 | 14 | 85 | 50 | 66 | 39 | 72 | 220.4 | 14.85 | 1.48 | 0.2564 | 0.0324 | 0.0063 | |||||||||||||||||||||||||||||||||||||||||||||||||||||||||||||||||||||||||||||||||||
| stcP | 100 | 59 | 65 | 7 | 80 | 55 | 68 | 34 | 72 | 239.16 | 15.46 | 1.55 | |||||||||||||||||||||||||||||||||||||||||||||||||||||||||||||||||||||||||||||||||||||||
| rev1 | 100 | 52 | 54 | 13 | 71 | 45 | 63 | 38 | 65 | 146.23 | 12.09 | 1.21 | 0.0006 | 0.0001 | 0.0001 | ||||||||||||||||||||||||||||||||||||||||||||||||||||||||||||||||||||||||||||||||||||
| rev3 | 100 | 48 | 47 | 15 | 76 | 39 | 59 | 34 | 66 | 179.72 | 13.41 | 1.34 | 0.0001 | 0.0001 | 0.0001 | ||||||||||||||||||||||||||||||||||||||||||||||||||||||||||||||||||||||||||||||||||||
| rev4 | 100 | 53 | 54 | 27 | 74 | 49 | 57 | 42 | 61 | 67.15 | 8.19 | 0.82 | 0.0005 | 0.0001 | 0.0001 | ||||||||||||||||||||||||||||||||||||||||||||||||||||||||||||||||||||||||||||||||||||
| rev5 | 100 | 54 | 54 | 26 | 70 | 50 | 59 | 46 | 64 | 63.71 | 7.98 | 0.8 | 0.0045 | 0.0001 | 0.0001 | ||||||||||||||||||||||||||||||||||||||||||||||||||||||||||||||||||||||||||||||||||||
| 1+2+3 | Control | 300 | 56 | 58 | 4 | 85 | 49 | 68 | 31 | 73 | 252.76 | 15.9 | 0.92 | 0.0001 | 0.0001 | 0.0001 | |||||||||||||||||||||||||||||||||||||||||||||||||||||||||||||||||||||||||||||||||||
| stcP | 300 | 62 | 65 | 7 | 90 | 55 | 75 | 37 | 80 | 295.6 | 17.19 | 0.99 | |||||||||||||||||||||||||||||||||||||||||||||||||||||||||||||||||||||||||||||||||||||||
| rev1 | 300 | 55 | 55 | 10 | 87 | 45 | 66 | 33 | 72 | 225.26 | 15.01 | 0.87 | 0.0001 | 0.0001 | 0.0001 | ||||||||||||||||||||||||||||||||||||||||||||||||||||||||||||||||||||||||||||||||||||
| rev3 | 300 | 53 | 54 | 10 | 85 | 41 | 66 | 34 | 72 | 226.96 | 15.07 | 0.87 | 0.0001 | 0.0001 | 0.0001 | ||||||||||||||||||||||||||||||||||||||||||||||||||||||||||||||||||||||||||||||||||||
| rev4 | 300 | 53 | 54 | 24 | 76 | 47 | 59 | 41 | 64 | 83.17 | 9.12 | 0.53 | 0.0001 | 0.0001 | 0.0001 | ||||||||||||||||||||||||||||||||||||||||||||||||||||||||||||||||||||||||||||||||||||
| rev5 | 300 | 53 | 55 | 18 | 78 | 47 | 60 | 40 | 65 | 104.27 | 10.21 | 0.59 | 0.0001 | 0.0001 | 0.0001 | ||||||||||||||||||||||||||||||||||||||||||||||||||||||||||||||||||||||||||||||||||||
| Unmated males | |||||||||||||||||||||||||||||||||||||||||||||||||||||||||||||||||||||||||||||||||||||||||||||||||||
| 1 | Control | 100 | 67 | 68 | 10 | 95 | 60 | 81 | 48 | 86 | 296.4 | 17.2 | 1.7 | 0.0565 | 0.0507 | 0.0541 | |||||||||||||||||||||||||||||||||||||||||||||||||||||||||||||||||||||||||||||||||||
| stcP | 100 | 62 | 65 | 10 | 84 | 54 | 74 | 46 | 78 | 206.2 | 14.4 | 1.4 | |||||||||||||||||||||||||||||||||||||||||||||||||||||||||||||||||||||||||||||||||||||||
| rev1 | 100 | 66 | 72 | 15 | 89 | 52 | 78 | 30 | 81 | 373.1 | 19.3 | 1.9 | 0.1369 | 0.0018 | 0.0001 | ||||||||||||||||||||||||||||||||||||||||||||||||||||||||||||||||||||||||||||||||||||
| rev3 | 100 | 68 | 73 | 11 | 93 | 58 | 81 | 39 | 85 | 340.6 | 18.5 | 1.8 | 0.0197 | 0.0004 | 0.0001 | ||||||||||||||||||||||||||||||||||||||||||||||||||||||||||||||||||||||||||||||||||||
| rev4 | 100 | 65 | 66 | 34 | 88 | 58 | 72 | 46 | 79 | 164.2 | 12.8 | 1.3 | 0.2479 | 0.3956 | 0.281 | ||||||||||||||||||||||||||||||||||||||||||||||||||||||||||||||||||||||||||||||||||||
| rev5 | 100 | 62 | 66 | 15 | 85 | 55 | 72 | 47 | 73 | 135.9 | 11.7 | 1.2 | 0.9097 | 0.4274 | 0.0063 | ||||||||||||||||||||||||||||||||||||||||||||||||||||||||||||||||||||||||||||||||||||
| 2 | Control | 100 | 51 | 57 | 4 | 89 | 40 | 65 | 22 | 76 | 402.5 | 20.1 | 2 | 0.2194 | 0.3035 | 0.5806 | |||||||||||||||||||||||||||||||||||||||||||||||||||||||||||||||||||||||||||||||||||
| stcP | 100 | 48 | 52 | 5 | 77 | 33 | 64 | 16 | 70 | 377.2 | 19.4 | 1.9 | |||||||||||||||||||||||||||||||||||||||||||||||||||||||||||||||||||||||||||||||||||||||
| 3 | Control | 100 | 48 | 53 | 7 | 84 | 33 | 65 | 14 | 72 | 471.9 | 21.7 | 2.2 | 0.854 | 0.741 | 0.2243 | |||||||||||||||||||||||||||||||||||||||||||||||||||||||||||||||||||||||||||||||||||
| stcP | 100 | 49 | 53 | 6 | 71 | 40 | 65 | 17 | 65 | 324.3 | 18 | 1.8 | |||||||||||||||||||||||||||||||||||||||||||||||||||||||||||||||||||||||||||||||||||||||
| Mated females | |||||||||||||||||||||||||||||||||||||||||||||||||||||||||||||||||||||||||||||||||||||||||||||||||||
| 1 | Control | 60 | 56 | 59 | 29 | 84 | 44 | 67 | 35 | 76 | 221.3 | 14.9 | 1.9 | 0.0004 | 0.0009 | 0.0003 | |||||||||||||||||||||||||||||||||||||||||||||||||||||||||||||||||||||||||||||||||||
| stcP | 60 | 48 | 48 | 15 | 71 | 41 | 55 | 32 | 61 | 121.7 | 11 | 1.4 | |||||||||||||||||||||||||||||||||||||||||||||||||||||||||||||||||||||||||||||||||||||||
| rev1 | 60 | 54 | 57 | 19 | 76 | 43 | 67 | 29 | 71 | 241.1 | 15.5 | 2 | 0.0134 | 0.0037 | 0.0013 | ||||||||||||||||||||||||||||||||||||||||||||||||||||||||||||||||||||||||||||||||||||
| rev3 | 60 | 58 | 61 | 23 | 86 | 49 | 71 | 37 | 78 | 241.6 | 15.5 | 2 | 0.0001 | 0.0001 | 0.0001 | ||||||||||||||||||||||||||||||||||||||||||||||||||||||||||||||||||||||||||||||||||||
| rev4 | 60 | 59 | 61 | 32 | 73 | 54 | 66 | 47 | 68 | 82 | 9.1 | 1.2 | 0.0001 | 0.0001 | 0.0001 | ||||||||||||||||||||||||||||||||||||||||||||||||||||||||||||||||||||||||||||||||||||
| rev5 | 60 | 58 | 62 | 18 | 75 | 51 | 68 | 42 | 72 | 162.7 | 12.8 | 1.6 | 0.0001 | 0.0001 | 0.0001 | ||||||||||||||||||||||||||||||||||||||||||||||||||||||||||||||||||||||||||||||||||||
| 2 | Control | 60 | 55 | 57 | 10 | 83 | 45 | 67 | 36 | 74 | 257.4 | 16 | 2.1 | 0.0017 | 0.0011 | 0.0013 | |||||||||||||||||||||||||||||||||||||||||||||||||||||||||||||||||||||||||||||||||||
| stcP | 60 | 47 | 49 | 9 | 75 | 41 | 55 | 34 | 58 | 132.8 | 11.5 | 1.5 | |||||||||||||||||||||||||||||||||||||||||||||||||||||||||||||||||||||||||||||||||||||||
| rev1 | 60 | 52 | 53 | 11 | 77 | 42 | 68 | 25 | 71 | 298.6 | 17.3 | 2.2 | 0.0848 | 0.0435 | 0.009 | ||||||||||||||||||||||||||||||||||||||||||||||||||||||||||||||||||||||||||||||||||||
| rev3 | 60 | 57 | 57 | 28 | 82 | 45 | 67 | 36 | 74 | 194.2 | 13.9 | 1.8 | 0.0001 | 0.0002 | 0.0001 | ||||||||||||||||||||||||||||||||||||||||||||||||||||||||||||||||||||||||||||||||||||
| rev4 | 60 | 55 | 56 | 28 | 68 | 52 | 59 | 45 | 65 | 68.1 | 8.3 | 1.1 | 0.0001 | 0.0001 | 0.0001 | ||||||||||||||||||||||||||||||||||||||||||||||||||||||||||||||||||||||||||||||||||||
| rev5 | 60 | 56 | 58 | 10 | 70 | 54 | 60 | 47 | 66 | 86.2 | 9.3 | 1.2 | 0.0001 | 0.0001 | 0.0001 | ||||||||||||||||||||||||||||||||||||||||||||||||||||||||||||||||||||||||||||||||||||
| 1+2 | Control | 120 | 56 | 58 | 10 | 84 | 44 | 67 | 35 | 76 | 237.6 | 15.4 | 1.4 | 0.0001 | 0.0001 | 0.0001 | |||||||||||||||||||||||||||||||||||||||||||||||||||||||||||||||||||||||||||||||||||
| stcP | 120 | 47 | 48 | 9 | 75 | 41 | 55 | 33 | 60 | 126.3 | 11.2 | 1 | |||||||||||||||||||||||||||||||||||||||||||||||||||||||||||||||||||||||||||||||||||||||
| rev1 | 120 | 52 | 55 | 11 | 77 | 42 | 67 | 28 | 71 | 268.6 | 16.4 | 1.5 | 0.0031 | 0.0004 | 0.0001 | ||||||||||||||||||||||||||||||||||||||||||||||||||||||||||||||||||||||||||||||||||||
| rev3 | 120 | 58 | 60 | 23 | 86 | 47 | 67 | 36 | 77 | 216.6 | 14.7 | 1.3 | 0.0001 | 0.0001 | 0.0001 | ||||||||||||||||||||||||||||||||||||||||||||||||||||||||||||||||||||||||||||||||||||
| rev4 | 120 | 57 | 58 | 28 | 73 | 54 | 63 | 46 | 68 | 79.1 | 8.9 | 0.8 | 0.0001 | 0.0001 | 0.0001 | ||||||||||||||||||||||||||||||||||||||||||||||||||||||||||||||||||||||||||||||||||||
| rev5 | 120 | 57 | 58 | 10 | 75 | 53 | 65 | 44 | 69 | 124 | 11.1 | 1 | 0.0001 | 0.0001 | 0.0001 | ||||||||||||||||||||||||||||||||||||||||||||||||||||||||||||||||||||||||||||||||||||
| 3 | Control | 60 | 59 | 62 | 24 | 85 | 51 | 69 | 36 | 79 | 245.6 | 15.7 | 2 | 0.0029 | 0.0041 | 0.0162 | |||||||||||||||||||||||||||||||||||||||||||||||||||||||||||||||||||||||||||||||||||
| stcP | 60 | 50 | 53 | 10 | 71 | 42 | 61 | 27 | 65 | 211.6 | 14.5 | 1.9 | |||||||||||||||||||||||||||||||||||||||||||||||||||||||||||||||||||||||||||||||||||||||
| 4 | Control | 60 | 60 | 68 | 13 | 85 | 50 | 72 | 35 | 77 | 295.1 | 17.2 | 2.2 | 0.2006 | 0.0275 | 0.0025 | |||||||||||||||||||||||||||||||||||||||||||||||||||||||||||||||||||||||||||||||||||
| stcP | 60 | 56 | 61 | 7 | 78 | 50 | 66 | 35 | 72 | 205.1 | 14.3 | 1.8 | |||||||||||||||||||||||||||||||||||||||||||||||||||||||||||||||||||||||||||||||||||||||
| 5 | Control | 60 | 61 | 66 | 18 | 82 | 52 | 72 | 36 | 78 | 256.8 | 16 | 2.1 | 0.0295 | 0.0226 | 0.047 | |||||||||||||||||||||||||||||||||||||||||||||||||||||||||||||||||||||||||||||||||||
| stcP | 60 | 54 | 62 | 7 | 79 | 44 | 67 | 25 | 71 | 314.4 | 17.7 | 2.3 | |||||||||||||||||||||||||||||||||||||||||||||||||||||||||||||||||||||||||||||||||||||||
| 6 | Control | 100 | 63 | 66 | 17 | 80 | 52 | 73 | 47 | 78 | 13.5 | 21.4 | 1.3 | 0.0001; 0.0001 | 0.0001; 0.0001 | 0.0001; 0.0001 | |||||||||||||||||||||||||||||||||||||||||||||||||||||||||||||||||||||||||||||||||||
| stcP | 100 | 46 | 45 | 11 | 73 | 39 | 52 | 33 | 57 | 10.3 | 22.4 | 1 | |||||||||||||||||||||||||||||||||||||||||||||||||||||||||||||||||||||||||||||||||||||||
| 47 | 49 | 5 | 69 | 38 | 54 | 30 | 61 | 12.2 | 26.2 | 1.2 | |||||||||||||||||||||||||||||||||||||||||||||||||||||||||||||||||||||||||||||||||||||||||
| Mated males | |||||||||||||||||||||||||||||||||||||||||||||||||||||||||||||||||||||||||||||||||||||||||||||||||||
| 1 | Control | 60 | 65 | 67 | 10 | 83 | 59 | 75 | 50 | 76 | 171.9 | 13.1 | 1.7 | 0.0183 | 0.0406 | 0.0763 | |||||||||||||||||||||||||||||||||||||||||||||||||||||||||||||||||||||||||||||||||||
| stcP | 60 | 60 | 63 | 18 | 79 | 51 | 70 | 43 | 75 | 162.1 | 12.7 | 1.6 | |||||||||||||||||||||||||||||||||||||||||||||||||||||||||||||||||||||||||||||||||||||||
| rev1 | 60 | 62 | 69 | 11 | 84 | 61 | 73 | 32 | 76 | 288 | 17 | 2.2 | 0.3861 | 0.0375 | 0.0162 | ||||||||||||||||||||||||||||||||||||||||||||||||||||||||||||||||||||||||||||||||||||
| rev3 | 60 | 63 | 67 | 17 | 79 | 60 | 72 | 42 | 75 | 164.7 | 12.8 | 1.7 | 0.1327 | 0.0644 | 0.0763 | ||||||||||||||||||||||||||||||||||||||||||||||||||||||||||||||||||||||||||||||||||||
| rev4 | 57 | 65 | 65 | 45 | 80 | 61 | 69 | 57 | 72 | 44.4 | 6.7 | 0.9 | 0.0121 | 0.1018 | 0.02 | ||||||||||||||||||||||||||||||||||||||||||||||||||||||||||||||||||||||||||||||||||||
| rev5 | 60 | 63 | 66 | 16 | 80 | 58 | 70 | 49 | 73 | 129 | 11.4 | 1.5 | 0.1957 | 0.1855 | 0.1813 | ||||||||||||||||||||||||||||||||||||||||||||||||||||||||||||||||||||||||||||||||||||
| 2 | Control | 60 | 60 | 67 | 11 | 87 | 58 | 73 | 20 | 77 | 429.3 | 20.7 | 2.7 | 0.734 | 0.0563 | 0.0225 | |||||||||||||||||||||||||||||||||||||||||||||||||||||||||||||||||||||||||||||||||||
| stcP | 60 | 59 | 59 | 13 | 83 | 53 | 69 | 44 | 75 | 164.9 | 12.8 | 1.7 | |||||||||||||||||||||||||||||||||||||||||||||||||||||||||||||||||||||||||||||||||||||||
| rev1 | 60 | 58 | 62 | 11 | 84 | 48 | 71 | 31 | 77 | 326.7 | 18.1 | 2.3 | 0.6382 | 0.9497 | 0.3752 | ||||||||||||||||||||||||||||||||||||||||||||||||||||||||||||||||||||||||||||||||||||
| rev3 | 60 | 58 | 58 | 31 | 85 | 50 | 64 | 42 | 74 | 141.2 | 11.9 | 1.5 | 0.5317 | 0.3689 | 0.6604 | ||||||||||||||||||||||||||||||||||||||||||||||||||||||||||||||||||||||||||||||||||||
| rev4 | 60 | 61 | 63 | 28 | 77 | 57 | 65 | 53 | 69 | 73.2 | 8.6 | 1.1 | 0.3098 | 0.2619 | 0.047 | ||||||||||||||||||||||||||||||||||||||||||||||||||||||||||||||||||||||||||||||||||||
| rev5 | 60 | 58 | 62 | 16 | 76 | 56 | 63 | 43 | 69 | 144.9 | 12 | 1.6 | 0.6501 | 0.9225 | 0.2656 | ||||||||||||||||||||||||||||||||||||||||||||||||||||||||||||||||||||||||||||||||||||
| 3 | Control | 60 | 55 | 58 | 6 | 83 | 52 | 66 | 33 | 70 | 263.9 | 16.2 | 2.1 | 0.8682 | 0.885 | 0.5095 | |||||||||||||||||||||||||||||||||||||||||||||||||||||||||||||||||||||||||||||||||||
| stcP | 60 | 55 | 56 | 10 | 73 | 53 | 65 | 23 | 70 | 242.8 | 15.6 | 2 | |||||||||||||||||||||||||||||||||||||||||||||||||||||||||||||||||||||||||||||||||||||||
| 4 | Control | 60 | 52 | 55 | 7 | 68 | 47 | 58 | 44 | 61 | 115.9 | 10.8 | 1.4 | 0.5321 | 0.8561 | 0.3752 | |||||||||||||||||||||||||||||||||||||||||||||||||||||||||||||||||||||||||||||||||||
| stcP | 60 | 50 | 56 | 15 | 67 | 41 | 61 | 29 | 64 | 183.5 | 13.5 | 1.7 | |||||||||||||||||||||||||||||||||||||||||||||||||||||||||||||||||||||||||||||||||||||||
| 5 | Control | 60 | 48 | 51 | 10 | 69 | 43 | 57 | 28 | 62 | 181.7 | 13.5 | 1.7 | 0.2596 | 0.6532 | 0.1196 | |||||||||||||||||||||||||||||||||||||||||||||||||||||||||||||||||||||||||||||||||||
| stcP | 60 | 49 | 55 | 7 | 76 | 38 | 61 | 23 | 67 | 263.5 | 16.2 | 2.1 | |||||||||||||||||||||||||||||||||||||||||||||||||||||||||||||||||||||||||||||||||||||||
| Standard errors were calculated from the variance among vials. | |||||||||||||||||||||||||||||||||||||||||||||||||||||||||||||||||||||||||||||||||||||||||||||||||||
| Significant P-values are in bold case. When multiple lines were compared (P values in italics), two underscored lines indicate P values that survived False Discovery Rate correction and a single bold underscore indicates P values that survived Bonferroni correction. | |||||||||||||||||||||||||||||||||||||||||||||||||||||||||||||||||||||||||||||||||||||||||||||||||||
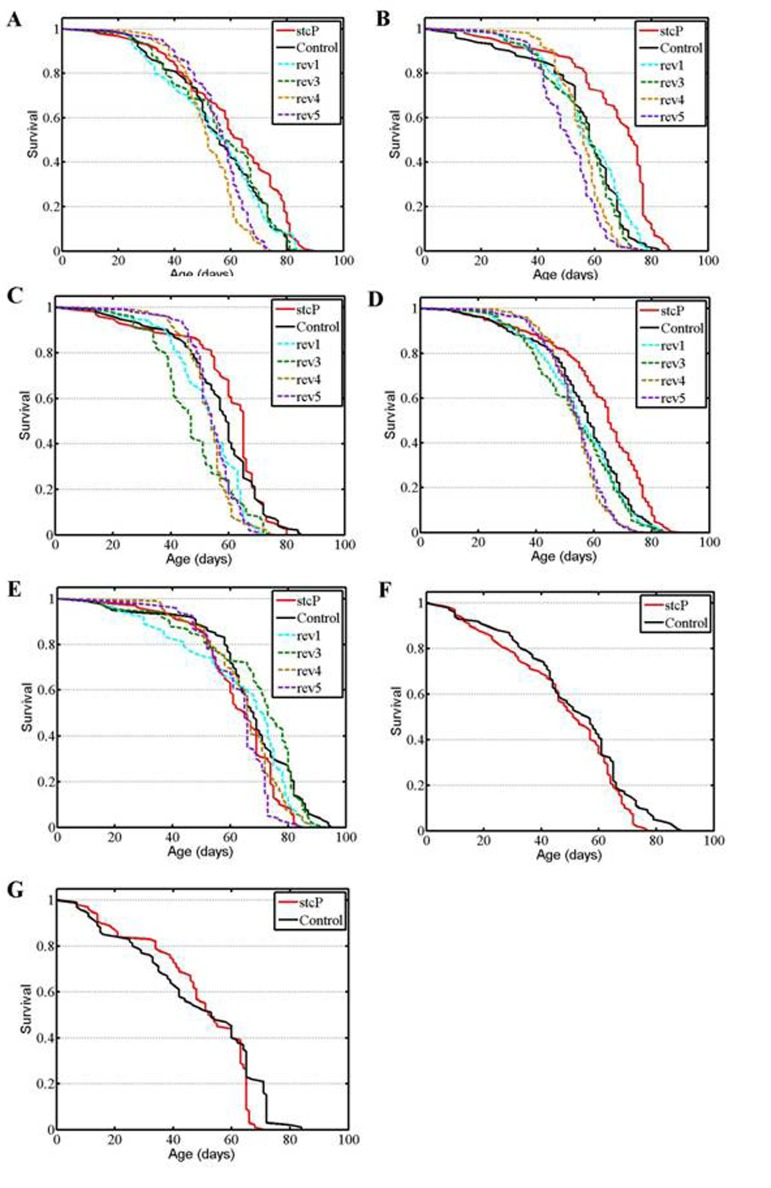
Figure 2. Survival of unmated females and males. (A, B, C) experiments #1, #2, #3 with females. (D) combined data for the three experiments. (E, F, G) experiments #1, #2, #3 with males.
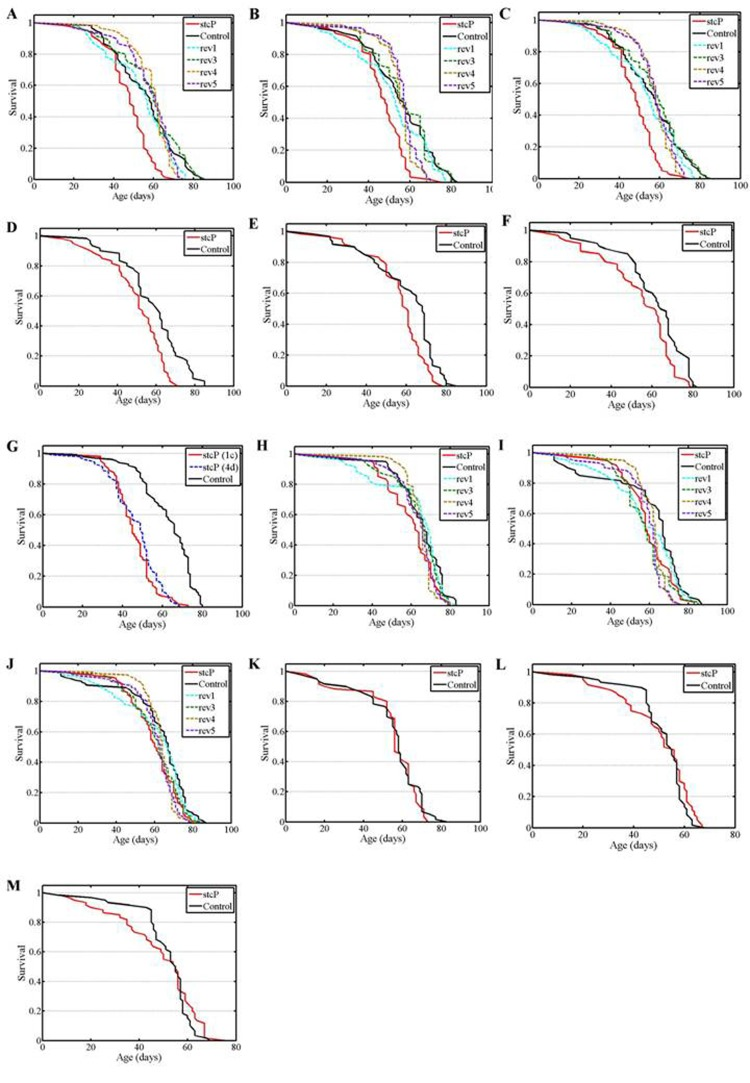
Figure 3. Survival of mated females and males. (A, B) experiments #1, #2 with females. (C) combined data for experiments #1, #2 with females. (D, E, F, G) experiments #3, #4, #5, #6 with females. H, I: experiments #1, #2 with males. J: combined data for experiments #1, #2 with males. (K, L, M) experiments #3, #4, #5 with males.
A significantly increased lifespan was detected in unmated mutant females compared to control females and to females of reversion lines rev1, rev4 and rev5 (Table 1, Figure 2A). To verify these results, the experiment was repeated twice over two years. In the second and third experiments, the lifespan of mutant females was significantly higher than the lifespan of control females and females of all four reversion lines (Table 1, Figures 2B, 2C). The combined results of the three experiments (Table 1, Figure 2D) clearly demonstrated a difference in lifespan between control and mutant unmated females and between mutant and reversion unmated females. Additional log rank tests confirmed this conclusion (P=0.000001 for each comparison). Survivorships of the four reversion lines were homogenous (P=0.1962, Kruskal-Wallis test). After adjusting for multiple testing, survivorships of rev1 and rev3 lines were not different from survivorship of the control line, whereas survivorships of rev4 and rev5 lines were (P=0.1123, P=0.0491, P=0.0001, P=0.0001, respectively, Kruskal-Wallis test). Consequently, survival curves were not homogenous among control females and females of all reversion lines (P=0.0003, Kruskal-Wallis test), though mean and median lifespans of control females and females of all reversion lines were almost identical and varied between 53 and 55 days (Table 1). The average positive effect of mutation was approximately 10% of the control lifespan. Comparison of survival curves indicated that the mutation slowed aging slightly.
No difference was found between the lifespans of mutant and control males (Table 1, Figure 2E). The lifespan of males in two of four reversion lines, rev1 and rev3, was significantly different from the lifespan of mutant males (Table 1, Figure 2E) and control males according to the Kolmogorov-Smirnov test (P = 0.0063 for rev1; P = 0.0243 for rev3). These differences did not reflect an increase or a decrease in lifespan but fluctuations in the shape of survival curves (Figure 2E). Over the next two years, two other experiments confirmed the lack of difference in lifespan between mutant and control unmated males (Table 1, Figures 2F, 2G).
A significantly decreased lifespan was detected in mated mutant females compared to control females and females of the four reversion lines (Table 1, Figure 3A). To verify these results, the experiment was repeated and the lifespan of mutant females was again shown to be significantly lower than the lifespan of control females and females of all four reversion lines (Table 1, Figures 3B, 3C). Additional log rank tests for the combined results of the two experiments confirmed this conclusion (P=0.000001 for each comparison). Survivorships were homogenous among the four reversion lines (P=0.1198, Kruskal-Wallis test). Survivorships of all reversion lines were not different from survivorship of the control line (P=0.2542, P=0.3366, P=0.6245, P=0.4784, respectively, Kruskal-Wallis test), consequently, survivorships were homogenous among all five lines (P=0.2110, Kruskal-Wallis test). Experiments with mutant and control mated females were repeated four more times over three years. The last experiment was made simultaneously with reproduction assays. In all cases, the lifespan of mutant females was significantly lower than the lifespan of control females (Table 1, Figures 3D-G). In the last experiment, the difference between the lifespan of mutant and control females was greater than in the earlier experiments. Our results demonstrated a difference in lifespan between control and mutant mated females and between mutant and reversion unmated females. The average negative effect of mutation was approximately 15% of the control lifespan. Comparison of survival curves indicated that the mutation slightly accelerated aging.
After adjusting for multiple testing, the lifespan of mutant mated males was not different from the lifespan of control males and males with all four reversions (Table 1, Figure 3H). To verify these results, the experiment was repeated and identical results were obtained (Table 1, Figures 3I, 3J). Three other experiments confirmed the lack of difference between the lifespan of mutant and control mated males (Table 1, Figures 3K, 3L, 3M).
Locomotion
In both mutant and control unmated females, locomotor activity reached a maximum at 20 days of age and then decreased (Figure 4A). No difference in locomotion was detected in 1 day old or 20 day old unmated females, whereas locomotion of 40 day old and 60 day old mutant females was significantly higher than locomotion of 40 day old and 60 day old control females (Table 2, Figure 4A). Locomotion was also measured in 40-day-old unmated females from the rev3 line. No difference was detected compared to controls (Table 2).
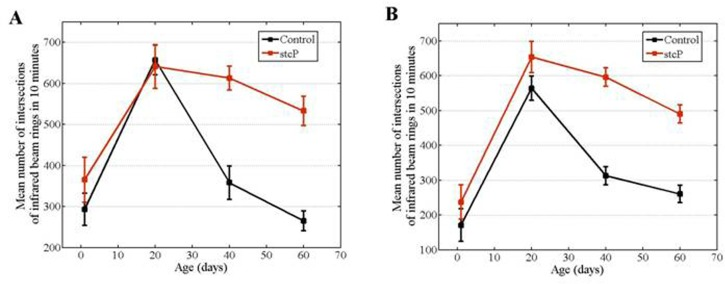
Figure 4. Age-dependent locomotion of mutant and control females. (A) Locomotion of unmated females in vials fixed in horizontal position. (B) Locomotion of unmated females in vials fixed in vertical position.
Table 2. Parameters of female locomotion in the control, stcP, and rev3 lines
| Direction of motion | Age of females, days | Line | No of vials 1 | Mean No of intersections 2 (s. e.) | Median No of intersections | P values for comparisons with stcP line | |||||||||||||||||||||||||||||||||||||||||||||||||||||||||||||||||||||||||||||||||||||||||||||
|---|---|---|---|---|---|---|---|---|---|---|---|---|---|---|---|---|---|---|---|---|---|---|---|---|---|---|---|---|---|---|---|---|---|---|---|---|---|---|---|---|---|---|---|---|---|---|---|---|---|---|---|---|---|---|---|---|---|---|---|---|---|---|---|---|---|---|---|---|---|---|---|---|---|---|---|---|---|---|---|---|---|---|---|---|---|---|---|---|---|---|---|---|---|---|---|---|---|---|---|
| t test | Kruskal-Wallis test | ||||||||||||||||||||||||||||||||||||||||||||||||||||||||||||||||||||||||||||||||||||||||||||||||||
| Horizontal | 1 | Control | 16 | 171 (47) | 116.5 | 0.3320 | 0.2662 | ||||||||||||||||||||||||||||||||||||||||||||||||||||||||||||||||||||||||||||||||||||||||||||
| stcP | 16 | 237 (49) | 163.5 | ||||||||||||||||||||||||||||||||||||||||||||||||||||||||||||||||||||||||||||||||||||||||||||||||
| 20 | Control | 20 | 564 (35) | 536 | 0.1259 | 0.0909 | |||||||||||||||||||||||||||||||||||||||||||||||||||||||||||||||||||||||||||||||||||||||||||||
| stcP | 20 | 653 (45) | 688.5 | ||||||||||||||||||||||||||||||||||||||||||||||||||||||||||||||||||||||||||||||||||||||||||||||||
| 40 | Control | 17 | 313 (26) | 315 | 0.0001 | 0.0001 | |||||||||||||||||||||||||||||||||||||||||||||||||||||||||||||||||||||||||||||||||||||||||||||
| stcP | 17 | 596 (27) | 624 | ||||||||||||||||||||||||||||||||||||||||||||||||||||||||||||||||||||||||||||||||||||||||||||||||
| rev 3 | 14 | 366 (13) | 355 | 0.0024 | 0.0009 | ||||||||||||||||||||||||||||||||||||||||||||||||||||||||||||||||||||||||||||||||||||||||||||||
| 60 | Control | 14 | 260 (25) | 240 | 0.0001 | 0.0001 | |||||||||||||||||||||||||||||||||||||||||||||||||||||||||||||||||||||||||||||||||||||||||||||
| stcP | 14 | 490 (26) | 522 | ||||||||||||||||||||||||||||||||||||||||||||||||||||||||||||||||||||||||||||||||||||||||||||||||
| Vertical | 1 | Control | 16 | 293 (39) | 313 | 0.2916 | 0.2912 | ||||||||||||||||||||||||||||||||||||||||||||||||||||||||||||||||||||||||||||||||||||||||||||
| stcP | 16 | 365 (55) | 336 | ||||||||||||||||||||||||||||||||||||||||||||||||||||||||||||||||||||||||||||||||||||||||||||||||
| 20 | Control | 20 | 657 (36) | 664 | 0.8062 | 0.8181 | |||||||||||||||||||||||||||||||||||||||||||||||||||||||||||||||||||||||||||||||||||||||||||||
| stcP | 20 | 641 (53) | 702 | ||||||||||||||||||||||||||||||||||||||||||||||||||||||||||||||||||||||||||||||||||||||||||||||||
| 40 | Control | 17 | 358 (41) | 330 | 0.0001 | 0.0001 | |||||||||||||||||||||||||||||||||||||||||||||||||||||||||||||||||||||||||||||||||||||||||||||
| stcP | 17 | 613 (29) | 632 | ||||||||||||||||||||||||||||||||||||||||||||||||||||||||||||||||||||||||||||||||||||||||||||||||
| 60 | Control | 14 | 265 (24) | 254.5 | 0.0001 | 0.0001 | |||||||||||||||||||||||||||||||||||||||||||||||||||||||||||||||||||||||||||||||||||||||||||||
| stcP | 14 | 533 (36) | 575.5 | ||||||||||||||||||||||||||||||||||||||||||||||||||||||||||||||||||||||||||||||||||||||||||||||||
| Each vial contained 10 females. | |||||||||||||||||||||||||||||||||||||||||||||||||||||||||||||||||||||||||||||||||||||||||||||||||||
| Number of intersections of three infrared beam rings during 10 minutes. | |||||||||||||||||||||||||||||||||||||||||||||||||||||||||||||||||||||||||||||||||||||||||||||||||||
| Standard errors were calculated from variance among vials. | |||||||||||||||||||||||||||||||||||||||||||||||||||||||||||||||||||||||||||||||||||||||||||||||||||
| Significant P-values are in bold. | |||||||||||||||||||||||||||||||||||||||||||||||||||||||||||||||||||||||||||||||||||||||||||||||||||
Flies naturally tend to move against gravity. We investigated if the stc mutation altered fly geotaxis independently of locomotion per se. Results were similar regardless of whether vials were fixed in horizontal and vertical positions, i.e. horizontal or vertical motion was primarily measured (Figures 4A, 4B). We did not use mechanical stimuli to induce movements, which might explain the lack of difference between the results. Thus, we considered the two variations of the experiment as replicates.
Reproduction
The number of eggs laid by mutant females was significantly lower compared to controls at 3 and 40 days of age. The visual difference in the number of eggs laid by 20 day old females was substantial but not significant. The number of adult progeny was significantly lower from mutant females at 20 and 40 days of age compared to controls (Table 3, Figure 5). Almost no progeny were obtained from any 60 day old females, and the difference between mutant and control females was not detectable. Egg-to-adult viability of progeny from mutant females at 3, 40 and 60 days of age was also lower than controls (Table 3, Figure 5). Overall, reproductive ability appeared to be reduced in mutant females compared to controls.
Table 3. Parameters of female reproduction and viability of offspring in the control and stcP lines
| Age of females, days | Line | No of vials | Mean (s. e.) | Median | P values for comparisons with stcP line | ||||||||||||||||||||||||||||||||||||||||||||||||||||||||||||||||||||||||||||||||||||||||||||||
|---|---|---|---|---|---|---|---|---|---|---|---|---|---|---|---|---|---|---|---|---|---|---|---|---|---|---|---|---|---|---|---|---|---|---|---|---|---|---|---|---|---|---|---|---|---|---|---|---|---|---|---|---|---|---|---|---|---|---|---|---|---|---|---|---|---|---|---|---|---|---|---|---|---|---|---|---|---|---|---|---|---|---|---|---|---|---|---|---|---|---|---|---|---|---|---|---|---|---|---|
| t test | Kruskal-Wallis test | ||||||||||||||||||||||||||||||||||||||||||||||||||||||||||||||||||||||||||||||||||||||||||||||||||
| No of eggs per female | |||||||||||||||||||||||||||||||||||||||||||||||||||||||||||||||||||||||||||||||||||||||||||||||||||
| 3 | Control | 20 | 3.67 (0.44) | 3.20 | 0.0122 | 0.0049 | |||||||||||||||||||||||||||||||||||||||||||||||||||||||||||||||||||||||||||||||||||||||||||||
| stcP | 20 | 2.04 (0.43) | 1.25 | ||||||||||||||||||||||||||||||||||||||||||||||||||||||||||||||||||||||||||||||||||||||||||||||||
| 20 | Control | 20 | 4.25 (0.91) | 2.65 | 0.4711 | 0.7762 | |||||||||||||||||||||||||||||||||||||||||||||||||||||||||||||||||||||||||||||||||||||||||||||
| stcP | 20 | 3.54 (0.77) | 2.85 | ||||||||||||||||||||||||||||||||||||||||||||||||||||||||||||||||||||||||||||||||||||||||||||||||
| 40 | Control | 20 | 4.41 (0.97) | 3.70 | 0.0069 | 0.0077 | |||||||||||||||||||||||||||||||||||||||||||||||||||||||||||||||||||||||||||||||||||||||||||||
| stcP | 20 | 2.28 (0.46) | 1.60 | ||||||||||||||||||||||||||||||||||||||||||||||||||||||||||||||||||||||||||||||||||||||||||||||||
| 60 | Control | 20 | 3.51 (0.74) | 3.20 | 0.0004 | 0.0001 | |||||||||||||||||||||||||||||||||||||||||||||||||||||||||||||||||||||||||||||||||||||||||||||
| stcP | 20 | 0.36 (0.12) | 0.11 | ||||||||||||||||||||||||||||||||||||||||||||||||||||||||||||||||||||||||||||||||||||||||||||||||
| No of imago offspring per female | |||||||||||||||||||||||||||||||||||||||||||||||||||||||||||||||||||||||||||||||||||||||||||||||||||
| 3 | Control | 20 | 2.34 (0.28) | 2.20 | 0.0188 | 0.0097 | |||||||||||||||||||||||||||||||||||||||||||||||||||||||||||||||||||||||||||||||||||||||||||||
| stcP | 20 | 1.34 (0.29) | 0.75 | ||||||||||||||||||||||||||||||||||||||||||||||||||||||||||||||||||||||||||||||||||||||||||||||||
| 20 | Control | 20 | 3.07 (0.69) | 1.8 | 0.0190 | 0.1711 | |||||||||||||||||||||||||||||||||||||||||||||||||||||||||||||||||||||||||||||||||||||||||||||
| stcP | 20 | 1.71 (0.39) | 1 | ||||||||||||||||||||||||||||||||||||||||||||||||||||||||||||||||||||||||||||||||||||||||||||||||
| 40 | Control | 20 | 1.21 (0.27) | 1 | 0.0007 | 0.0001 | |||||||||||||||||||||||||||||||||||||||||||||||||||||||||||||||||||||||||||||||||||||||||||||
| stcP | 20 | 0.42 (0.05) | 0 | ||||||||||||||||||||||||||||||||||||||||||||||||||||||||||||||||||||||||||||||||||||||||||||||||
| 60 | Control | 20 | 0.02 (0.02) | 0 | NA | NA | |||||||||||||||||||||||||||||||||||||||||||||||||||||||||||||||||||||||||||||||||||||||||||||
| stcP | 20 | 0 | 0 | ||||||||||||||||||||||||||||||||||||||||||||||||||||||||||||||||||||||||||||||||||||||||||||||||
| Egg to pupa viability | |||||||||||||||||||||||||||||||||||||||||||||||||||||||||||||||||||||||||||||||||||||||||||||||||||
| 3 | Control | 20 | 0.674 (0.035) | 0.688 | 0.6229 | 0.7571 | |||||||||||||||||||||||||||||||||||||||||||||||||||||||||||||||||||||||||||||||||||||||||||||
| stcP | 20 | 0.705 (0.051) | 0.686 | ||||||||||||||||||||||||||||||||||||||||||||||||||||||||||||||||||||||||||||||||||||||||||||||||
| 20 | Control | 20 | 0.714 (0.037) | 0.760 | 0.0012 | 0.0015 | |||||||||||||||||||||||||||||||||||||||||||||||||||||||||||||||||||||||||||||||||||||||||||||
| stcP | 20 | 0.485 (0.054) | 0.516 | ||||||||||||||||||||||||||||||||||||||||||||||||||||||||||||||||||||||||||||||||||||||||||||||||
| 40 | Control | 20 | 0.276 (0.042) | 0.250 | 0.0001 | 0.0001 | |||||||||||||||||||||||||||||||||||||||||||||||||||||||||||||||||||||||||||||||||||||||||||||
| stcP | 20 | 0.030 (0.014) | 0 | ||||||||||||||||||||||||||||||||||||||||||||||||||||||||||||||||||||||||||||||||||||||||||||||||
| 60 | Control | 20 | 0 | 0 | NA | NA | |||||||||||||||||||||||||||||||||||||||||||||||||||||||||||||||||||||||||||||||||||||||||||||
| stcP | 20 | 0 | 0 | ||||||||||||||||||||||||||||||||||||||||||||||||||||||||||||||||||||||||||||||||||||||||||||||||
| Egg to imago viability | |||||||||||||||||||||||||||||||||||||||||||||||||||||||||||||||||||||||||||||||||||||||||||||||||||
| 3 | Control | 20 | 0.655 (0.067) | 0.685 | 0.9655 | 0.8286 | |||||||||||||||||||||||||||||||||||||||||||||||||||||||||||||||||||||||||||||||||||||||||||||
| stcP | 20 | 0.658 (0.047) | 0.631 | ||||||||||||||||||||||||||||||||||||||||||||||||||||||||||||||||||||||||||||||||||||||||||||||||
| 20 | Control | 20 | 0.696 (0.036) | 0.688 | 0.0005 | 0.0005 | |||||||||||||||||||||||||||||||||||||||||||||||||||||||||||||||||||||||||||||||||||||||||||||
| stcP | 20 | 0.460 (0.050) | 0.523 | ||||||||||||||||||||||||||||||||||||||||||||||||||||||||||||||||||||||||||||||||||||||||||||||||
| 40 | Control | 20 | 0.267 (0.041) | 0.250 | 0.0001 | 0.0001 | |||||||||||||||||||||||||||||||||||||||||||||||||||||||||||||||||||||||||||||||||||||||||||||
| stcP | 20 | 0.029 (0.014) | 0 | ||||||||||||||||||||||||||||||||||||||||||||||||||||||||||||||||||||||||||||||||||||||||||||||||
| 60 | Control | 20 | 0 | 0 | NA | NA | |||||||||||||||||||||||||||||||||||||||||||||||||||||||||||||||||||||||||||||||||||||||||||||
| stcP | 20 | 0 | 0 | ||||||||||||||||||||||||||||||||||||||||||||||||||||||||||||||||||||||||||||||||||||||||||||||||
| Standard errors were calculated from variance among vials. | |||||||||||||||||||||||||||||||||||||||||||||||||||||||||||||||||||||||||||||||||||||||||||||||||||
| Significant P-values are in bold. | |||||||||||||||||||||||||||||||||||||||||||||||||||||||||||||||||||||||||||||||||||||||||||||||||||
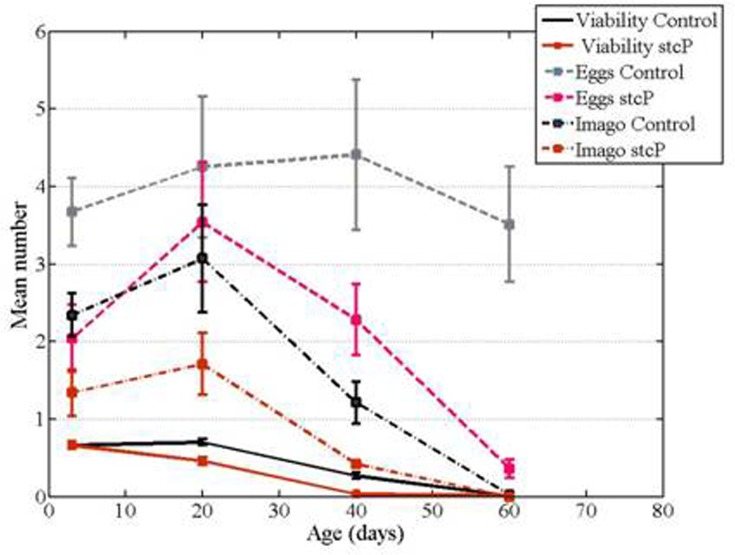
Figure 5. Age-dependent fecundity of mutant and control females and viability of their progeny. Eggs: the mean number of eggs per female. Imagoes: the mean number of imago offspring per female. Viability: egg to imago viability, the number of imago offspring related to the number of eggs laid.
stc transcript amounts
To understand the molecular basis of differences in lifespan, locomotion and reproduction caused by mutation, we assessed the effect of stcKG01230 on stc transcript amounts (Table 4). Four annotated and two experimentally confirmed stc transcripts (RA and RB) that differ by 21 nucleotides due to alternative splicing are reported (http://flybase.org). We estimated total stc transcript amounts in 20 day old and 60 day old unmated females and males. No difference was found between control and mutant females (Table 4, Figure 6A) or control and mutant males (Table 4). The same results were obtained when comparing amounts of the sole RB transcript in 20 day old flies (Table 4, Figure 6A). Based on these results and the technical impossibility of measuring the sole RA transcript amount, we measured total stc transcript amounts in all further experiments, which were primarily restricted to females since stcKG01230 did not affect male lifespan.
Table 4. stc transcript amounts in control, mutant and revertant lines
| Source of RNA | Line | No of experiments | Mean (s. e.), arbitrary units | P values for comparisons with stcP line | |||||||||||||||||||||||||||||||||||||||||||||||||||||||||||||||||||||||||||||||||||||||||||||||
|---|---|---|---|---|---|---|---|---|---|---|---|---|---|---|---|---|---|---|---|---|---|---|---|---|---|---|---|---|---|---|---|---|---|---|---|---|---|---|---|---|---|---|---|---|---|---|---|---|---|---|---|---|---|---|---|---|---|---|---|---|---|---|---|---|---|---|---|---|---|---|---|---|---|---|---|---|---|---|---|---|---|---|---|---|---|---|---|---|---|---|---|---|---|---|---|---|---|---|---|
| t test | Kruskal-Wallis test | ||||||||||||||||||||||||||||||||||||||||||||||||||||||||||||||||||||||||||||||||||||||||||||||||||
| Embryos, 0-12 hours | Control | 1 | 0.320 (0.02)* | ||||||||||||||||||||||||||||||||||||||||||||||||||||||||||||||||||||||||||||||||||||||||||||||||
| stcP | 1 | 0.224 (0.01)* | |||||||||||||||||||||||||||||||||||||||||||||||||||||||||||||||||||||||||||||||||||||||||||||||||
| Embryos, 12-18 hours | Control | 1 | 0.333 (0.02)* | ||||||||||||||||||||||||||||||||||||||||||||||||||||||||||||||||||||||||||||||||||||||||||||||||
| stcP | 1 | 0.133 (0.03)* | |||||||||||||||||||||||||||||||||||||||||||||||||||||||||||||||||||||||||||||||||||||||||||||||||
| Embryos, 0-18 hours | Control | 4 | 0.294 (0.003) | 0.0033 | 0.0209 | ||||||||||||||||||||||||||||||||||||||||||||||||||||||||||||||||||||||||||||||||||||||||||||||
| stcP | 4 | 0.140 (0.001) | |||||||||||||||||||||||||||||||||||||||||||||||||||||||||||||||||||||||||||||||||||||||||||||||||
| rev3 | 4 | 0.444 (0.100) | 0.0273 | 0.0833 | |||||||||||||||||||||||||||||||||||||||||||||||||||||||||||||||||||||||||||||||||||||||||||||||
| Embryos, 0-18 hours | Control | 4 | 0.894 (0.138) | 0.0073 | 0.0209 | ||||||||||||||||||||||||||||||||||||||||||||||||||||||||||||||||||||||||||||||||||||||||||||||
| stcP | 4 | 0.286 (0,066) | |||||||||||||||||||||||||||||||||||||||||||||||||||||||||||||||||||||||||||||||||||||||||||||||||
| rev3 | 4 | 0.869 (0.097) | 0.0025 | 0.0209 | |||||||||||||||||||||||||||||||||||||||||||||||||||||||||||||||||||||||||||||||||||||||||||||||
| Female larvae, III stage | Control | 5 | 0.459 (0.040) | 0.5493 | 0.6242 | ||||||||||||||||||||||||||||||||||||||||||||||||||||||||||||||||||||||||||||||||||||||||||||||
| stcP | 4 | 0.407 (0.077) | |||||||||||||||||||||||||||||||||||||||||||||||||||||||||||||||||||||||||||||||||||||||||||||||||
| Female larvae, III stage | Control | 5 | 0.238 (0.029) | 0.3305 | 0.2207 | ||||||||||||||||||||||||||||||||||||||||||||||||||||||||||||||||||||||||||||||||||||||||||||||
| stcP | 4 | 0.191 (0.035) | |||||||||||||||||||||||||||||||||||||||||||||||||||||||||||||||||||||||||||||||||||||||||||||||||
| Females, 5-6 hours | Control | 5 | 0.318 (0.021) | 0.7415 | 0.8065 | ||||||||||||||||||||||||||||||||||||||||||||||||||||||||||||||||||||||||||||||||||||||||||||||
| stcP | 5 | 0.300 (0.045) | |||||||||||||||||||||||||||||||||||||||||||||||||||||||||||||||||||||||||||||||||||||||||||||||||
| Unmated females, 20 days | Control | 4 | 0.565 (0.110) | 0.3977 | 0.5637 | ||||||||||||||||||||||||||||||||||||||||||||||||||||||||||||||||||||||||||||||||||||||||||||||
| stcP | 4 | 0.449 (0.063) | |||||||||||||||||||||||||||||||||||||||||||||||||||||||||||||||||||||||||||||||||||||||||||||||||
| Unmated females, 20 days, RB | Control | 2 | 0.401 (0.083) | 0.8511 | 1 | ||||||||||||||||||||||||||||||||||||||||||||||||||||||||||||||||||||||||||||||||||||||||||||||
| stcP | 2 | 0.433 (0.123) | |||||||||||||||||||||||||||||||||||||||||||||||||||||||||||||||||||||||||||||||||||||||||||||||||
| Unmated females, 60 days | Control | 5 | 0.286 (0.064) | 0.4960 | 0.6015 | ||||||||||||||||||||||||||||||||||||||||||||||||||||||||||||||||||||||||||||||||||||||||||||||
| stcP | 5 | 0.376 (0.110) | |||||||||||||||||||||||||||||||||||||||||||||||||||||||||||||||||||||||||||||||||||||||||||||||||
| Mated females, 20 days | Control | 4 | 0.658 (0.017) | 0.5074 | 0.4624 | ||||||||||||||||||||||||||||||||||||||||||||||||||||||||||||||||||||||||||||||||||||||||||||||
| stcP | 5 | 0.630 (0.034) | |||||||||||||||||||||||||||||||||||||||||||||||||||||||||||||||||||||||||||||||||||||||||||||||||
| Mated females, 60 days | Control | 5 | 0.834 (0.126) | 0.4645 | 0.6242 | ||||||||||||||||||||||||||||||||||||||||||||||||||||||||||||||||||||||||||||||||||||||||||||||
| stcP | 4 | 1.048 (0.268) | |||||||||||||||||||||||||||||||||||||||||||||||||||||||||||||||||||||||||||||||||||||||||||||||||
| Ovaries, unmated females, 20 days | Control | 2 | 0.757 (0.197) | 0.9851 | 1 | ||||||||||||||||||||||||||||||||||||||||||||||||||||||||||||||||||||||||||||||||||||||||||||||
| stcP | 2 | 0.747 (0.054) | |||||||||||||||||||||||||||||||||||||||||||||||||||||||||||||||||||||||||||||||||||||||||||||||||
| Ovaries, unmated females, 50 days | Control | 2 | 0.782 (0.292) | 0.9232 | 0.4386 | ||||||||||||||||||||||||||||||||||||||||||||||||||||||||||||||||||||||||||||||||||||||||||||||
| stcP | 2 | 0.707 (0.275) | |||||||||||||||||||||||||||||||||||||||||||||||||||||||||||||||||||||||||||||||||||||||||||||||||
| Ovaries, mated females, 20 days | Control | 2 | 1.019 (0.329) | 0.8572 | 0.4386 | ||||||||||||||||||||||||||||||||||||||||||||||||||||||||||||||||||||||||||||||||||||||||||||||
| stcP | 2 | 1.242 (0.284) | |||||||||||||||||||||||||||||||||||||||||||||||||||||||||||||||||||||||||||||||||||||||||||||||||
| Ovaries, mated females, 50 days | Control | 2 | 0.749 (0.202) | 0.9879 | 0.4386 | ||||||||||||||||||||||||||||||||||||||||||||||||||||||||||||||||||||||||||||||||||||||||||||||
| stcP | 2 | 0.738 (0.194) | |||||||||||||||||||||||||||||||||||||||||||||||||||||||||||||||||||||||||||||||||||||||||||||||||
| Brain, female larvae, III stage | Control | 5 | 0.251 (0.090) | 0.7809 | 0.7540 | ||||||||||||||||||||||||||||||||||||||||||||||||||||||||||||||||||||||||||||||||||||||||||||||
| stcP | 5 | 0.221 (0.069) | |||||||||||||||||||||||||||||||||||||||||||||||||||||||||||||||||||||||||||||||||||||||||||||||||
| Heads, females, 5-6 hours | Control | 4 | 2.867 (0.420) | 0.8848 | 0.3272 | ||||||||||||||||||||||||||||||||||||||||||||||||||||||||||||||||||||||||||||||||||||||||||||||
| stcP | 5 | 3.074 (0.515) | |||||||||||||||||||||||||||||||||||||||||||||||||||||||||||||||||||||||||||||||||||||||||||||||||
| Unmated males, 20 days | Control | 4 | 0.211 (0.036) | 0.3113 | 0.2482 | ||||||||||||||||||||||||||||||||||||||||||||||||||||||||||||||||||||||||||||||||||||||||||||||
| stcP | 4 | 0.162 (0.026) | |||||||||||||||||||||||||||||||||||||||||||||||||||||||||||||||||||||||||||||||||||||||||||||||||
| Unmated males, 20 days, RB | Control | 2 | 0.207 (0.010) | 0.1618 | 0.1213 | ||||||||||||||||||||||||||||||||||||||||||||||||||||||||||||||||||||||||||||||||||||||||||||||
| stcP | 2 | 0.154 (0.019) | |||||||||||||||||||||||||||||||||||||||||||||||||||||||||||||||||||||||||||||||||||||||||||||||||
| Unmated males, 60 days | Control | 2 | 0.513 (0.165) | 0.7832 | 0.4386 | ||||||||||||||||||||||||||||||||||||||||||||||||||||||||||||||||||||||||||||||||||||||||||||||
| stcP | 2 | 0.441 (0.162) | |||||||||||||||||||||||||||||||||||||||||||||||||||||||||||||||||||||||||||||||||||||||||||||||||
| Standard errors were calculated from the variance among biological replicates. | |||||||||||||||||||||||||||||||||||||||||||||||||||||||||||||||||||||||||||||||||||||||||||||||||||
| Standard errors were calculated from the variance among technical replicates. | |||||||||||||||||||||||||||||||||||||||||||||||||||||||||||||||||||||||||||||||||||||||||||||||||||
| Significant P-values are in bold case. | |||||||||||||||||||||||||||||||||||||||||||||||||||||||||||||||||||||||||||||||||||||||||||||||||||
| The amount of RA and RB stc transcripts was measured in all cases except when sole RB transcript is specially indicated | |||||||||||||||||||||||||||||||||||||||||||||||||||||||||||||||||||||||||||||||||||||||||||||||||||
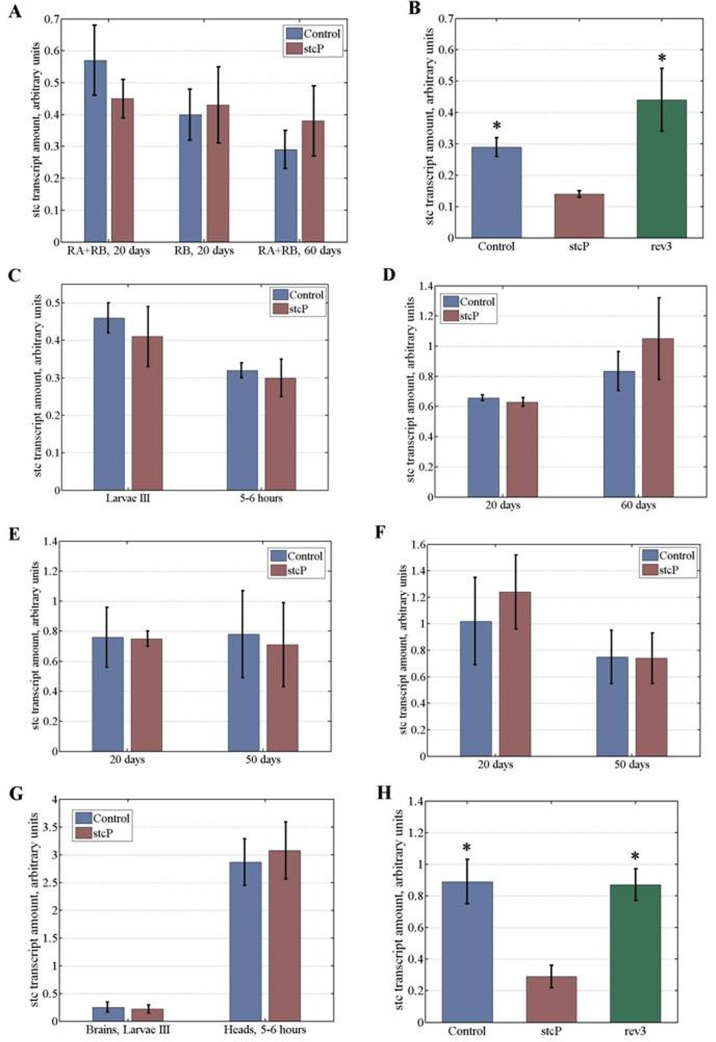
Figure 6. Stc transcript amounts at different stages of development and in flies of different age. Transcript amounts in (A) young and old unmated females. (B) embryos, experiment #1. (C) wandering stage III female larvae and 5 to 6 hour old virgin females. (D) young and old mated females. (E) ovaries of young and old unmated females. (F) ovaries of young and old mated females. (G) brains of wandering stage III female larvae and heads of 5 to 6 hour old virgin females. (H) embryos, experiment #2. Asterisks denote significant differences (P<0.05).
stc is predominantly expressed in embryos. According to modENCODE Temporal Expression Data (http://flybase.org), the level of stc mRNA is rather steady throughout embryogenesis, with very high amounts observed at early stages, and high amounts observed up to 18 hours of development. Higher amounts of stc mRNA in early embryos may be explained by the presence of maternally derived transcripts [9]. In preliminary experiments, we evaluated stc transcript amounts in mutant and control 0 to 12 hour and 12 to 18 hour embryos. In both cases, amounts of stc transcripts appeared to be lower in stcP embryos, with the effect being less pronounced at early stages (Table 4). To confirm the difference between the lines, we measured stc transcript amounts in mutant and control 0 to 18 hour embryos. This large interval allowed us to obtain the overall characteristics of control and mutant embryos and to offset the possible uneven contribution of eggs of different stages. Amounts of stc transcripts were significantly lower in mutant embryos compared to controls (Table 4, Figure 6B).
We then measured stc transcript amounts in mutant and control wandering stage III female larvae, 5 to 6 hour old females, 20 day old and 60 day old unmated and mated females, ovaries of 20 day old and 50 to 60 day old unmated and mated females, brain of stage III female larvae, and heads of 5 to 6 hour old females. No differences were observed between control and mutant lines in larvae, 5 to 6 hour old virgin females, and in young or old adult females, both unmated and mated (Figures 6C, 6A, 6D). stc transcripts are abundant in ovaries, presumably because of high demand in embryos [9]. However, no differences were seen in stc transcript amounts between the ovaries of mutant and control females, regardless of age and mating status (6E, 6F). The presence of equal amounts of maternally derived transcripts in control and mutant embryos may mask a difference in embryonic transcription, which explains why stc transcript amounts are less different between control and mutant embryos at early embryonic stages. Considering that stc is required for development of the nervous system, we measured stc transcript amounts in brains of stage III larvae and heads of mutant and control females. No differences were found (Table 4, Figure 6G).
Differences in amounts of stc transcripts were found only in embryos and these differences disappeared as early as in female larvae. We repeated experiments with embryos and larvae and confirmed this result (Table 4, Figure 6H). Finally, we measured stc transcript amounts in embryos of a reversion line rev3and found they were significantly higher than in mutant embryos and did not differ from stc transcript amounts in control embryos (Table 4, Figures 6B, 6H).
Synaptic activity
We investigated whether stcKG01230 affected neuronal functions after the embryonic stage. No differences were observed in the number of synaptic active zones between female larvae that were mutants (124 ± 8) or controls (142 ± 12) (P = 0.2069 for Kruskal-Wallis test; Figure 7). Substantial differences in synaptic structure were also not detected.
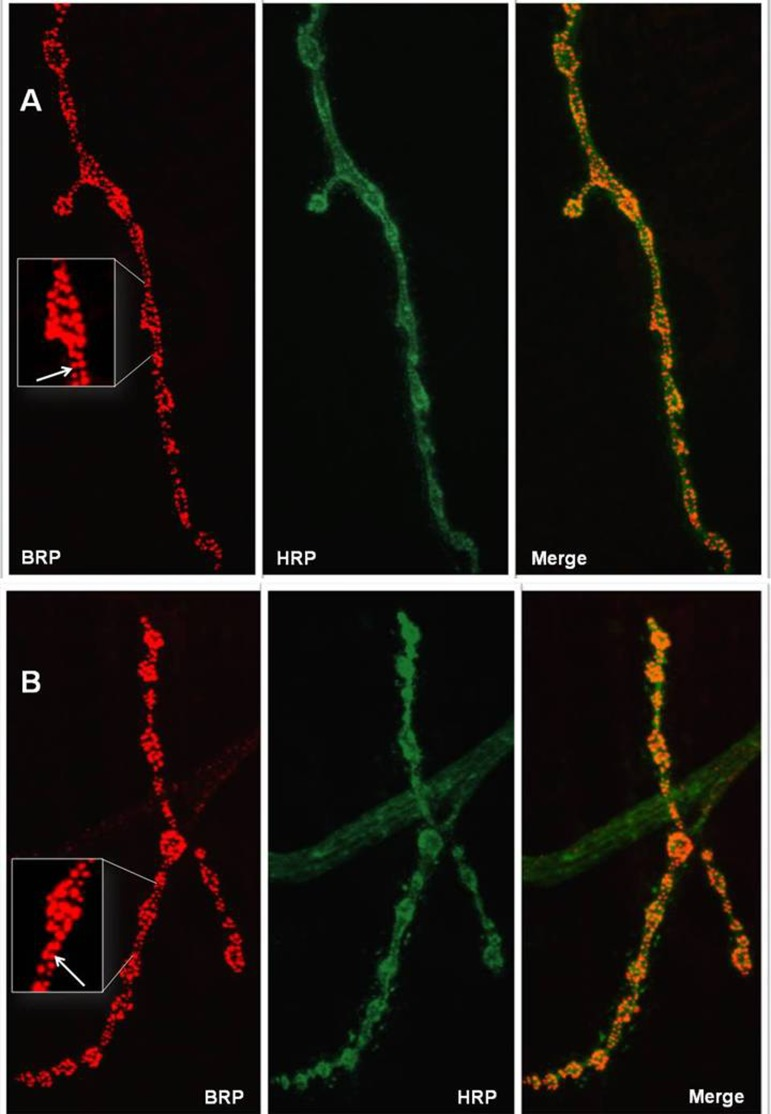
Figure 7. Active zones at representative neuromuscular junctions of wandering stage III female larvae. (A) control line. (B) stcP line. Left panels: NMJs are probed with anti-BRP (Bruchpilot), red color. Middle panels: NMJs are probed with anti-HRP (HorseRedish Peroxidase), green color. Right panels: merge. Enlarged parts of NMJs are shown in white frames. White arrows indicate red grains corresponding to active zones that were counted to characterize synaptic activity.
Discussion
In this paper, we assessed the role of the neuronal gene stc in lifespan control using a control fruit fly line, a line with an insertional stcKG01230 mutation, and four lines with precise reversions of this mutation, rev1, rev3, rev4, and rev5. Of note, precise reversions of mutations caused by insertions of P-element based vectors are uncommon [6]; we were fortunate to obtain four reversions, allowing us to make independent evaluations of their phenotypic effects. Lines rev3 and rev4 were obtained from different males that had delta 2-3 source of P element transposase in the genome; thus, they have resulted from two independent excisions of the P{SUPor-P} element. As expected, lifespans of lines rev1 and rev3 were statistically undistinguishable from lifespan of the control line. Minor differences could be explained by random uncontrolled fluctuations. Lines rev3 and rev4 were obtained from the same male that had delta 2-3 source of P element transposase in the genome; thus, they might have resulted from either two independent excisions of the P{SUPor-P} element or one premeiotic excision of P{SUPor-P}. Our results indicated that, most likely, premeiotic excision was the reversion mechanism. Indeed, survival curves for both unmated and mated rev4 and rev5 females were very similar and slightly but distinctly different from the survival curves of the control, rev1, and rev3 females (Figure 2D, 3C). Differences were specific and could not be explained by random uncontrolled fluctuations. In all lines with reversions, the normal stc gene structure was restored. In situ hybridization of a biotin labeled fragment of the P-element based vector comprising P-element inverted repeat and white sequences with salivary gland polythene chromosomes confirmed that in all reversion lines, no additional large insertions that could potentially affect lifespan appeared in the euchromatic part of the genome. We are not able to exclude a possibility that small fragments of the initial vector were inserted into new locations, though these events don't seen probable. It is virtually impossible to find these small insertions both by in situ hybridization with polythene chromosomes and by Southern blot analysis because a proper probe can't be selected. Overall, the nature of the differences among the reversion lines remains obscure. To add to the complexity, temporal fluctuations in lifespan of particular lines were observed. Changes in the mean lifespan of flies during long-term observations are not unusual and have been previously reported [12-14]. Hypothetically, they could be explained by some uncontrolled changes in the environment (magnetic field, sun activity, atmospheric pressure, etc). However, on the whole, in all lines with reversions, lifespan of the control line was also restored. This result confirmed the causal association between changes in lifespan and stcKG01230 mutation.
It would be valuable to determine if other stc mutations have similar effects on fly longevity. However, only two insertion mutations affecting stc are publically available: stcKG01230 used in this study and stc05441 lethal mutation described in [8] and used in our previous work [5]. Even though the lethal phenotype of stc05441 is typical for classic stc mutations, the insertion is actually located within an adjacent gene, CG15269. Besides, only heterozygotes can be used in lifespan assays. Finally, there is no proper control line for comparisons. Considering this, we decided that the study of this mutation will hardly add to our understanding of stc effects on longevity. The absence of proper control lines applies to all classic mutations as well. We are not aware of stc mutations available in private collections and do not expect that there are some, given that recently, there were no publications directly relating to stc. Lines for stc-specific RNAi knockdown are available, which can provide a decrease in stc transcript amounts similar to the effects observed in this study. However, none of the GAL4 driver lines available in stock collections governs expression only in embryos. Nevertheless, in future studies, we propose analyzing stc-specific RNAi knockdowns with several GAL4 drivers governing expression predominantly at the embryonic stage.
Only mutant females showed significant changes in lifespan compared to controls, with opposite effect seen in unmated and mated females. Sex specificity of the effect on lifespan confirmed our previous results [5], although in our earlier study, we used lines y1 w67c3; P{SUPor-P}stcKG01230; ry and y1 w67c23; ry initially obtained from the Bloomington Stock Center. In the initial genetic background, stcKG01230 reduced lifespan both in unmated and mated females compared to controls. w1118 has little or no effect on lifespan, whereas the y1 w67c23 background appears to be long lived [15]. The difference in the lifespan effects of the stcKG01230 mutation in unmated females compared to controls can be explained by differences in genetic background: in a long-lived background, the stc mutation decreased lifespan but had the opposite effect in a normal lifespan background. In mated females, the effect of the stc mutation on lifespan was similar. Overall, our results indicated unknown epistatic interactions. This conclusion agreed with our earlier data showing that the stc mutations had different effects on lifespan in different genetic backgrounds [5]. The genetic basis of these epistatic interactions remains to be elucidated, but our results support that stc interacts with other chromosomally unlinked genes that modify its effect on lifespan. Independent direct experiments indicate that naturally segregating genes interact epistatically with the “aging gene” Sod to modify its ability to extend longevity [16]. stc is expected to interact with other genes because it encodes a transcription factor and transcriptional cascades are recognized as a key regulatory mechanism [17]. Transcription factors such as FOXO, HSF-1, HIF-1 and others are crucial for the regulation of longevity and aging [for review, see 4].
Epistatic interactions might also be at least partially responsible for the sex-specific effects of stc on lifespan. Several groups of genes were identified that are regulated in a sex-biased manner under stress conditions. These range from expected differences in genes involved in reproductive physiology to those involved in amino acid utilization, sensory perception, immune response, and growth control. [18]. Given that many genes are involved in both longevity and stress resistance control, their sex-biased expression might account for the observed sex-specific patterns of longevity. In Drosophila, sex-specificity of lifespan control was reported earlier [19, 20], and was associated with insulin [21-23] and steroid signaling [24] and changes in protein homeostasis [25]. This sex-specificity may be based on the fundamental evolutionarily conserved systemic regulation of aging by the reproductive system [26].
In the experiments presented in this paper, unmated stcKG01230 females lived longer than mated stcKG01230 females (62±1 vs 50±2 days, averaged over all experiments). Reproduction is believed to shorten lifespan, and tradeoffs between lifespan and reproduction are widespread; however, increased lifespan and decreased reproduction can be uncoupled under certain conditions [for review, see 27]. Alteration of stc structure and function decreased both lifespan and fecundity of mated females, suggesting a direct correlation between survival and reproduction. stcKG01230 flies had decreased viability compared to controls. This result suggested that the mutation was slightly deleterious overall even though it prolonged the lifespan of unmated females in certain backgrounds. It was shown that the female survival cost of mating is not associated with elevated feeding observed in females following mating [28]. Of all the traits, frequency of mating was significantly associated with the extent of the female survival cost of mating [28]. It remains to be assessed experimentally whether mating frequency is affected by stcKG01230. Another possibility is that stcKG01230 effect on reproduction and survival is more specific and based on interactions with the metabolism of sex peptides. These male seminal fluid proteins can profoundly change female gene expression and physiology, egg production and frequency of mating [29]. Ii is also well known that mating increases the risk of infection. Turandot M, a member of a family of immune and stress response genes, provides survival benefits to females following sexually transmitted infections [30] and is another candidate for yet unknown interactions with stc.
Mutations in stc affect locomotion [31]. Our results confirmed this finding and showed a causal relationship between structural changes in stc and changes in locomotion. Locomotion was used as a marker of aging. General locomotor activity decreases with normal aging in animals and is often considered as a marker of aging [for review, see 32]. We assessed the effect of stcKG01230 on locomotor activity in unmated females to determine if the mutation affects the rate of aging. A decline in locomotion was observed in both unmated mutant and unmated control females, however, a continued higher level of mobility in older mutant flies indicated slowed aging.. This confirmed our hypothesis that stcKG01230 would slow aging in unmated females, based on initial comparison of survival curves.
The P{SUPor-P}stcKG01230 construct was inserted into the untranslated region of stc and did not affect STC protein(s) (Figure 1A). However, this large insertion could affect transcription level and the molecular basis of stcKG01230 effects on lifespan might have been associated with impaired gene expression. We hypothesized that age-dependent differences in the amount of stc transcripts would be observed between mutant and control female imagoes. However, we did not observe these hypothesized differences. Differences in particular organ(s) might have been masked when whole fly bodies were analyzed. stc expression is observed throughout developmental stages and in many organs, however, high stc transcription is limited to embryos and ovaries in females (http://flybase.org). We analyzed the amount of stc transcripts in ovaries of unmated and mated females of different ages and saw no differences between mutant and control flies. stc is involved in embryonic development of the nervous system [8] and is presumably necessary for its function later in life. However, no differences in stc transcript amounts were detected in the brain of mutant and control females. Also, according to our preliminary investigations, synaptic activity and structure were not changed in stcKG01230 female larvae compared to controls. In future studies, we propose more deeply exploring the functional role of stc in the nervous system of larvae and imagoes.
P{SUPor-P}stcKG01230 is a large insertion that might affect functions of genes located near stc. CG15269, a gene with unknown biological function, is located 388 bp upstream of the 5′ end of stc. P{PZ}stc05441 insertion into CG15269 was described in[8] as a stc mutation with typical phenotype. The nature of this phenomenon remains unknown and could be a subject of future studies that could also address the question whether the P{SUPor-P}stcKG01230 insertion affects CG15269 function. Several non-protein coding genes with unknown functions are located 1714 bp downstream of stc and further. At the moment, there is no data allowing imagine how the P{SUPor-P}stcKG01230 insertion might affect their function. No other genes are found in the vicinity of stc, the nearest neighbors being vasa and vasa intronic gene located 39097 bp upstream of stc and CG4168 located 43813 bp downstream of stc. Although we can't fully exclude remote effects of P{SUPor-P}stcKG01230, they don't seem probable.
We found that the stcKG01230 mutation changed stc transcription only in embryos. This significant result was confirmed in two experiments, conducted over approximately 2 years. We were unable to separate female and male embryos to attribute our results to a particular gender. Our results in female larvae suggested that transcription might be still slightly lower in mutants (Figure 6C), whereas results in old females suggested that transcription might be slightly higher in mutants (Figures 6A, 6D). Although these differences were not significant, in the future we might study this question by increasing the resolution of our methods, to find causal association between age-dependent stc expression and lifespan. It is tempting, however, to suggest that lifespan might depend on gene function during early development. Accumulating data suggest that several key lifespan regulators such as mitochondrial electron transport chain enzymes, microRNAs, and the transcription factors HSF-1 and FOXO affect lifespan predominantly during early larval development and early adulthood [for review, see 4]. We hypothesize that the long-term, carry-over effects of the stc mutation might be epigenetically inherited in cell lineages. Alternatively, the STC transcription factor might participate in transcriptional cascades that predetermine structural and therefore functional properties of the adult nervous system. If embryonic transcription of stc and lifespan are causally associated, the exact mechanisms of this carry-over effect remains to be elucidated.
Materials and Methods
Drosophila lines and crosses
The y1 w67c23; P{SUPor-P}stcKG01230; ry mutant line and the y1 w67c23; ry control line were from the Bloomington Stock Center and used in our previous work [5]. Standard substitution crosses with balancers and delta 2-3 source of P element transposase [10] were used to obtain lines with reversions of the stcKG01230 mutation. Four lines with reversions of the marker w+ phenotype were obtained from three males with the active transposase. In crosses, chromosomes 2 from control and mutant lines and chromosomes 2 with reversions were substituted into the X and chromosome 3 genetic background of w1118 line to reduce the number of unnecessary mutations. In all experiments, flies were kept at 25°C on a standard medium of semolina, sugar, raisins, yeast and agar with nipagin, propionic acid and streptomycin.
PCR and sequencing
DNA was extracted from 20 flies of each genotype using a standard phenol-chloroform method [33]. DNA was used in PCR reactions with primers pstc1 5′-GAACCGTTGCAGTACATTTAAC-3′ and pstc2 5′-GGAACAATCTCGAACTGCCC-3′ (expected product size 555 bp, Fig. 1A, B); pstc0 5′-CTAATTGGAAGGCGGAGCTC-3′ and pstc02 5′-CATTGAGAGTCCGGTGCTGT-3′ (2508 bp, Fig. 1A, C); pstc3 5′-ACACGTGTCTGGAGCTTTTCC-3′ and pstc4 5′-TCCGCTCTGTTACATAGCTGC-3′ (2562 bp, Fig. 1A, D). PCR products were sequenced with Big Dye Terminator V. 3.1. Kit (Applied Biosystems), according to the manufacturer's protocol on a ABI PRIZM 310 Genetic Analyser (Applied Biosystems). Six additional primers for sequencing were: 5′-TCCAACCAGACTGTCAAGTCAAATTAC-3′, 5′-TTCAATTAGCATGATCCAAGG-3′, 5′-AGACGTTGCTCTCGATCAGC-3′, 5′-AGACCACTCCCCGAAAACTG-3′, 5′-ATGTCAGCCCCTGTATGTGC-3′, 5′-AGAATCCAATCAGAGTGCGTC-3′.
Tests for Wolbachia
Wolbachia was detected via real time quantitative PCR with primers to 16S rRNA gene, 5′-CATACCTATTCGAAGGGATAG-3′ and 5′-AGCTTCGAGTGAAACCAATTC-3′ [34].
Lifespan assays
To assess the longevity of unmated flies, five virgin flies of the same genotype and sex, all collected on the same day from cultures with moderate density, were placed in replicate vials. To assess the longevity of mated flies, three virgin males and three virgin females of the same genotype were placed together in replicate vials. Flies were transferred to vials with fresh food containing approximately 5 mL of standard medium without live yeast on the surface weekly (virgin flies) or two times a week (mated flies). Dead flies were recorded daily. Experiments comparing fly lifespans were conducted simultaneously. Sample sizes were 60 to 100 flies/sex/genotype. All experiments were repeated three to six times. Lifespan was estimated for each fly as number of days alive from day of eclosion to day of death. Mean and median lifespan and survival curves were primarily used to characterize lifespan.
Locomotion assays
Flies were collected and maintained as for lifespan assays but without recording deaths. Locomotion was measured in unmated females at age 1, 20, 40 or 60 days at the same time each day. Experiments comparing locomotion were conducted simultaneously. Sample sizes were 30 to 100 flies/genotype/age. One day before measurements, five flies of the same age and genotype were placed in replicate vials. To measure locomotor activity, vials were placed in a Drosophila Population Monitor (TriKinetics), either horizontally or vertically. Fly movement along the walls or in the middle of the vial interrupts infrared beam rings along the length of the vial. Beam interruptions are detected and counted electronically and totals were reported every five minutes to a host computer. Two measurements for five minutes were made for each vial. Locomotion was characterized as mean and median number of beam interruptions per vial.
Fecundity and viability assays
Females aged 3, 20, 40 or 60 days were used. Sample sizes were 79 to 200 females/genotype/age. Fertilized females were placed in replicate vials, allowed to lay eggs for 12 hours and removed. Eggs were counted and transferred to fresh vials for development. Pupa and adult flies were counted in each replicate vial. Mean and median number of eggs and imagos per female were used to characterize fecundity. Mean and median egg-to-pupa and egg-to-imago viability per vial were used to characterize progeny viability.
Larva dissection, immunostaining and microscopy
Third-stage larvae were dissected in phosphate buffered saline (PBS) and fixed in 4% formaldehyde at room temperature for 20 minutes. Preparations were incubated overnight at 4°C with primary antibodies NC82 (DSHB, USA) against Bruchpilot (BRP), a protein specific to active synaptic zones, and then incubated with secondary antibodies labeled by indocarbocyanine (Jackson Immunoresearch, USA) and with anti-HRP (HorseRadish Peroxidase) antibodies with fluorophore Alexa 647 (Jackson Immunoresearch, USA) at room temperature for two hours; placed in a medium for immunofluorescence VectaShield (Vector Labs, USA). Neuromuscular junctions were analyzed using the fourth muscle of the third and fourth abdominal segments of larvae using a confocal laser scanning microscope (LSM 510, Zeiss, Germany) at 63x magnification, 633 and 543 nm wavelength, and confocal slice thickness fixed at 1 micron. ImageJ and LSM Image Browser (Zeiss, Germany) were used to determine the number of synaptic active zones. Sample sizes were 13 to 15 larvae/genotype. Mean number of synaptic active zones was used to characterize synapse activity.
Real-time RT-qPCR
Total RNA for real-time reverse transcription quantitative PCR (RT-qPCR) was extracted from 50 embryos aged 0–18 hours, from 20 female stage III female larvae, from 20 whole bodies of 5 to 6 hour old females, from 20 whole bodies of 20 day old and 60 day old virgin males and virgin and mated females, and from 50 pairs of ovaries of 20 day old and 50 day-old virgin and mated females, from 50 brains of stage III female larvae, from 30 heads of 5 to 6 hour old females using TRIzol reagent (Invitrogen) and DNase I Kit (TURBO DNA-free, Ambion) according to the manufacturers' instructions. Two to ten independent extractions/sex/mating status/genotype/age/tissue were made.
First-strand cDNA was synthesized using SuperScript II Reverse Transcriptase (Invitrogen) with oligo(dT) primers according to the manufacturer's instructions. Amounts of cDNA were determined by RT-qPCR using SYBR Green I/Rox in Chromo4 Real-Time PCR Detector (Bio-Rad).
Gdh and Adh housekeeping genes, characterized by relatively low expression comparable to stc expression were used as reference genes to normalize for differences in total cDNA between samples. Forward and reverse primer sequences were stcRA+RB: stc-rt1 5′-AACAGGCACAGCAACAACAA-3′ and stc-rt 2 5′-CCAGGGAGAAGTTAGTGTAGC-3′ (Figure 1A); stcRB: stc-RB1 5′-GGAGCCTTTGGACTGAACCC-3′ and stc-RB2 5′-ATTCGGAGATTGATGACTCAC-3′ (Figure 1A); Gdh: Gdh1 5′-TATGCCACCGAGCACCAGATTCC-3′ and Gdh2 5′-GGATGCCCTTCACCTTCTGCTTCTT-3′; Adh: Adhd3: 5′-CGGCATCTAAGAAGTGATACTCCCAAAA-3′ and Adhr3: 5′-TGAGTGTGCATCGAATCAGCCTTATT-3′.
MJ Opticon Monitor Analysis Software V. 3.1. 32 (Bio-Rad laboratories Inc., 2004-2005) was used to evaluate C(t) value. Intra-run calibrations were used for each panel of experiments, given the fact that the experiments were conducted for several years and two Bio-Rad PCR Detectors were used. Relative stc mRNA amount was considered as a measure of stc transcription level.
Statistical analyses
To compare control, mutant and revertant lines, the Student's t-test was used for initial analysis of lifespan, locomotion, fecundity, viability, and transcript amount. Nonparametric, distribution-free Kruskal-Wallis test and Kolmogorov-Smirnov tests were used for further comparisons of all traits in lines of different genotypes. Bonferroni and false discovery rate [35] corrections for multiple analyses were used when appropriate.
Acknowledgments
This work was supported by Russian Foundation for Basic Research grant 12-04-01182-a to Elena G. Pasyukova. Stocks obtained from the Bloomington Drosophila Stock Center (NIH P40OD018537) were used in this study.
Conflicts of Interest
The authors declare the absence of any conflict of interests.
References
- 1. Parkes TL, Hilliker AJ, Phillips JP. Motorneurons, reactive oxygen, and life span in Drosophila. Neurobiol. Aging. 1999; 20: 531 -535. [PubMed] .
- 2. Boulianne GL. Neuronal regulation of lifespan: clues from flies and worms. Mech. Ageing Dev. 2001; 122: 883 -894. [PubMed] .
- 3. Broughton S and Partridge L. Insulin/IGF-like signalling, the central nervous system and aging. Biochem. J. 2009; 418: 1 -12. [PubMed] .
- 4. Alcedo J, Flatt T, Pasyukova EG. Neuronal inputs and outputs of aging and longevity. Front. Genet. 2013; 4: 71 [PubMed] .
- 5. Pasyukova EG, Roshina NV, Mackay TFC. Shuttle craft: a candidate quantitative trait gene for Drosophila lifespan. Aging Cell. 2004; 3: 297 -307. [PubMed] .
- 6. Magwire MM, Yamamoto A, Carbone MA, Roshina NV, Symonenko AV, Pasyukova EG, Morozova TV, Mackay TFC. Quantitative and molecular genetic analyses of mutations increasing Drosophila life span. PLoS Genet. 2010; 6: e1001037 [PubMed] .
- 7. Rybina OY and Pasyukova EG. A naturally occurring polymorphism at Drosophila melanogaster Lim3 locus, a homolog of human LHX3/4, affects Lim3 transcription and fly lifespan. PLoS ONE. 2010; 5: e12621 [PubMed] .
- 8. Stroumbakis ND, Li Z, Tolias PP. A homolog of human transcription factor NF-X1 encoded by the Drosophila shuttle craft gene is required in the embryonic central nervous system. Mol. Cell. Biol. 1996; 16: 192 -201. [PubMed] .
- 9. Tolias PP and Stroumbakis ND. The Drosophila zygotic lethal gene shuttle craft is required maternally for proper embryonic development. Dev. Genes. Evol.. 1998; 208: 274 -282. [PubMed] .
- 10. Robertson HM, Preston CR, Phillis RW, Johnson-Schlitz DM, Benz WK, Engels WR. A stable genomic source of P element transposase in Drosophila melanogaster. Genetics. 1988; 118: 461 -470. [PubMed] .
- 11. McGraw EA and O'Neill SL. Wolbachia pipientis: intracellular infection and pathogenesis in Drosophila. Curr. Opin. Microbiol. 2004; 7: 67 -70. [PubMed] .
- 12. Lints FA, Lints CV, Bullens P, Bourgois M, Delince J. Unexplained variations in life span of the Oregon-R strain of Drosophila melanogaster over a four-year period. Exp. Geront. 1989; 24: 265 -271. .
- 13. Izmailov DM and Obukhova LK. Analysis of the life span distribution mode in 128 successive generations of D. melanogaster. Adv. Gerontol. 2004; 15: 30 -35. [PubMed] .
- 14. Krementsova AV, Roshina NV, Tsybul'ko EA, Rybina OY, Symonenko AV, Pasyukova EG. Reproducible effects of the mitochondria-targeted plastoquinone derivative SkQ1 on Drosophila melanogaster lifespan under different experimental scenarios. Biogerontology. 2012; 13: 595 -607. [PubMed] .
- 15. Mockett RJ, Cockrell JC, Puri S, Nguyen M, Nisa M. Long-lived genotypes for studies of life extension in Drosophila melanogaster. Mech. Ageing Dev. 2012; 133: 359 -367. [PubMed] .
- 16. Spencer CC, Howell CE, Wright AR, Promislow DE. Testing an ‘aging gene’ in long-lived drosophila strains: increased longevity depends on sex and genetic background. Aging Cell. 2003; 2: 123 -130. [PubMed] .
- 17. Skeath JB and Thor S. Genetic control of Drosophila nerve cord development. Curr. Opin. Neurobiol. 2003; 13: 8 -15. [PubMed] .
- 18. Bauer M, Katzenberger JD, Hamm AC, Bonaus M, Zinke I, Jaekel J, Pankratz MJ. Purine and folate metabolism as a potential target of sex-specific nutrient allocation in Drosophila and its implication for lifespan-reproduction tradeoff. Physiol. Genomics. 2006; 25: 393 -404. [PubMed] .
- 19. Nuzhdin SV, Pasyukova EG, Dilda CL, Zeng ZB, Mackay TF. Sex-specific quantitative trait loci affecting longevity in Drosophila melanogaster. Proc. Natl. Acad. Sci. U S A. 1997; 94: 9734 -9739. [PubMed] .
- 20. Magwire MM, Yamamoto A, Carbone MA, Roshina NV, Symonenko AV, Pasyukova EG, Morozova TV, Mackay TFC. Quantitative and molecular genetic analyses of mutations increasing Drosophila life span. PLoS Genet. 2010; 6: e1001037 [PubMed] .
- 21. Clancy DJ, Gems D, Harshman LG, Oldham S, Stocker H, Hafen E, Leevers SJ, Partridge L. Extension of life-span by loss of CHICO, a Drosophila insulin receptor substrate protein. Science. 2001; 292: 104 -106. [PubMed] .
- 22. Tatar M, Kopelman A, Epstein D, Tu MP, Yin CM, Garofalo RS. A mutant Drosophila insulin receptor homolog that extends life-span and impairs neuroendocrine function. Science. 2001; 292: 107 -110. [PubMed] .
- 23. Schriner SE, Kuramada S, Lopez TE, Truong S, Pham A, Jafari M. Extension of Drosophila lifespan by cinnamon through a sex-specific dependence on the insulin receptor substrate chico. Exp. Gerontol. 2014; 60: 220 -230. [PubMed] .
- 24. Tricoire H, Battisti V, Trannoy S, Lasbleiz C, Pret AM, Monnier V. The steroid hormone receptor EcR finely modulates Drosophila lifespan during adulthood in a sex-specific manner. Mech. Ageing Dev. 2009; 130: 547 -552. [PubMed] .
- 25. Ruiz M, Sanchez D, Canal I, Acebes A, Ganfornina MD. Sex-dependent modulation of longevity by two Drosophila homologues of human Apolipoprotein, D, GLaz and NLaz. Exp. Gerontol. 2011; 46: 579 -89. [PubMed] .
- 26. Flatt T, Min KJ, D'Alterio C, Villa-Cuesta E, Cumbers J, Lehmann R, Jones DL, Tatar M. Drosophila germ-line modulation of insulin signaling and lifespan. Proc. Natl. Acad. Sci. U S A. 2008; 105: 6368 -6373. [PubMed] .
- 27. Flatt T. Survival costs of reproduction in Drosophila. Exp. Gerontol. 2011; 46: 369 -375. [PubMed] .
- 28. Barnes AI, Wigby S, Boone JM, Partridge L, Chapman T. Feeding, fecundity and lifespan in female Drosophila melanogaster. Proc. Roy. Soc. B. 2008; 275: 1675 -1683. .
- 29. Wolfner MF. Tokens of love: functions and regulation of Drosophila male accessory gland products. Insect. Biochem. Mol. Biol. 1997; 27: 179 -192. [PubMed] .
- 30. Zhong W1, McClure CD, Evans CR, Mlynski DT, Immonen E, Ritchie MG, Priest NK. Immune anticipation of mating in Drosophila: Turandot M promotes immunity against sexually transmitted fungal infections. Proc. Bio. Sci. 2013; 280: 2013 -2018. .
- 31. Jordan KW, Morgan TJ, Mackay TF. Quantitative trait loci for locomotor behavior in Drosophila melanogaster. Genetics. 2006; 174: 271 -284. [PubMed] .
- 32. Ridgel AL and Ritzmann RE. Insights into age-related locomotor declines from studies of insects Ageing Res. Rev. 2005; 4: 23 -39. .
- 33. Sambrook J, Maniatis T, Fritsch EF. Molecular cloning: a laboratory manual. Cold Spring Harbor, N.Y Cold Spring Harbor Laboratory 1989; .
- 34. Werren JH and Windsor DM. Wolbachia infection frequencies in insects: evidence of a global equilibrium? Proc. Biol. Sci. 2000; 267: 1277 -1285. [PubMed] .
- 35. Benjamini Y and Hochberg Y. Controlling the false discovery rate: a practical and powerful approach to multiple testing. J.R. Statist. Soc. B. 1995; 57: 289 -300. .