


Introduction
Human longevity is characterized at middle age by lower prevalence of myocardial infarction, hypertension and type 2 diabetes [1]. Also, middle aged offspring of long-lived families exhibit lower plasma levels of glucose and higher insulin sensitivity. This is in concordance with the findings from animal studies which revealed that the insulin/IGF1 signal transduction pathway is involved in lifespan (reviewed in [2]). In humans, using a candidate driven approach, we and others have shown that genetic variation in this pathway affects human longevity [3, 4].
Type 2 diabetes (T2D) is characterized by an increased insulin resistance. In humans, insulin resistance as well as the prevalence of T2D increases with age. Long-lived subjects, such as centenarians and nonagenarian siblings, as well as their offspring, were found to exhibit a remarkably decreased prevalence of type 2 diabetes. Recently, offspring of longlived siblings were also found to have better glucose tolerance and higher insulin sensitivity as determined by homeostatic model assessment [5]. Since increased insulin sensitivity is associated with longevity, genetic determinants of T2D may be of interest for studies on longevity. In the last years, genome wide association (GWA) studies have identified several polymorphisms that associate with increased risk of T2D [6-9]. Replication studies [10-12] have shown the clinical relevance of a number of the identified loci.
To investigate whether the better glucose tolerance phenotype in the offspring of long-lived individuals is due to lack of genetic variants associated with type 2 diabetes, we analyzed 15 well established type 2 diabetes variants in the Leiden Longevity Study [13] for their association with familial longevity. The objective of the present study was to investigate whether a lower burden of common genetic variants that have been associated with increased T2D in GWA studies can account for the beneficial glucose tolerance associated with familial longevity.
Table 1.
Information of the fifteen selected SNPs associated with type 2 diabetes in Genome Wide Association studies
| SNP | Gene/locus | Location | Risk allele | References | |||||||||||||||||||||||||||||||||||||||||||||||||||||||||||||||||||||||||||||||||||||||||||||||
| Rs10497721 | TMEFF2 | 2q32.3 | A/C | [21] | |||||||||||||||||||||||||||||||||||||||||||||||||||||||||||||||||||||||||||||||||||||||||||||||
| Rs1801282 | PPARG | 3p25 | C/G | [21], [22] | |||||||||||||||||||||||||||||||||||||||||||||||||||||||||||||||||||||||||||||||||||||||||||||||
| Rs4402960 | IGF2BP2 | 3q27.2 | T/G | [22], [23] | |||||||||||||||||||||||||||||||||||||||||||||||||||||||||||||||||||||||||||||||||||||||||||||||
| Rs10010131 | WFS1 | 4q16 | G/A | [24], [23] | |||||||||||||||||||||||||||||||||||||||||||||||||||||||||||||||||||||||||||||||||||||||||||||||
| Rs7754840 | CDKAL1 | 6p22.3 | C/G | [23], [12] | |||||||||||||||||||||||||||||||||||||||||||||||||||||||||||||||||||||||||||||||||||||||||||||||
| Rs13266634 | SLC30A8 | 8q24.11 | C/T | [23], [10] | |||||||||||||||||||||||||||||||||||||||||||||||||||||||||||||||||||||||||||||||||||||||||||||||
| Rs564398 | CDKN2A/2B | 9q21 | T/C | [25], [12] | |||||||||||||||||||||||||||||||||||||||||||||||||||||||||||||||||||||||||||||||||||||||||||||||
| Rs10811661 | CDKN2A/2B | 9q21 | T/C | [10], [22] | |||||||||||||||||||||||||||||||||||||||||||||||||||||||||||||||||||||||||||||||||||||||||||||||
| Rs1111875 | HHEX | 10q23 | C/T | [26], [23] | |||||||||||||||||||||||||||||||||||||||||||||||||||||||||||||||||||||||||||||||||||||||||||||||
| Rs7903146 | TCF7L2 | 10q25.2 | T/C | [27], [10] | |||||||||||||||||||||||||||||||||||||||||||||||||||||||||||||||||||||||||||||||||||||||||||||||
| Rs5219 | KCNJ11 | 11p15.1 | T/C | [28], [29] | |||||||||||||||||||||||||||||||||||||||||||||||||||||||||||||||||||||||||||||||||||||||||||||||
| Rs1495377 | TSPAN8 | 12q21.1 | T2D | [9] | |||||||||||||||||||||||||||||||||||||||||||||||||||||||||||||||||||||||||||||||||||||||||||||||
| Rs8050136 | FTO | 16q12.2 | A/C | [23], [30] | |||||||||||||||||||||||||||||||||||||||||||||||||||||||||||||||||||||||||||||||||||||||||||||||
| rs4430796 | HNF1B | 17q12 | A/G | [31], [32] | |||||||||||||||||||||||||||||||||||||||||||||||||||||||||||||||||||||||||||||||||||||||||||||||
| rs757210 | HNF1B | 17q12 | T/C | [31] | |||||||||||||||||||||||||||||||||||||||||||||||||||||||||||||||||||||||||||||||||||||||||||||||
| Abbreviations: TMEFF2, transmembrane protein with EGF-like and 2 follistatin like domains 2; PPARG, peroxisome proliferator activated receptor γ; IGFBP2, IGF binding protein 2; WFS1, Wolfram Syndrome 1; CDKAL1, CDK5 reg. sub. Ass. protein 1; SLC30A8, solute carries family 30; CDKN2A/2B, cyclin-dependent kinase inhibitor 2A/2B; HHEX, Hematopoietically expressed Homeobox; TCF7L2, transcription factor 7 like 2; KCNJ11, Potassium channel inwardly rectifying submfamily J member 11; TSPAN8, tatraspanin8; FTO, fat mass and obesity associated; HNF1B, HNF1 homeobox B | |||||||||||||||||||||||||||||||||||||||||||||||||||||||||||||||||||||||||||||||||||||||||||||||||||
Results
Baseline characteristics
The total study population consisted of 2415 participants (1671 offspring; 744 controls). Baseline characteristics are shown in Table 2. The group of offspring was slightly older compared to their partners. The two groups were comparable with respect to measures of height, weight and body mass index, both crude and after adjustment for age and sex. Offspring from nonagenarian siblings had a lower prevalence of diabetes mellitus and hypertension as well as a slightly lower prevalence of myocardial infarction. In accordance with the lower prevalence of diabetes, offspring had lower glucose levels (P<0.001) and lower levels of insulin (P=0.006). After exclusion of all participants with diabetes, the association remained significant for glucose (P=0.001), but became non-significant for insulin (P=0.209).
Table 2.
Baseline characteristics of the study groups from the Leiden Longevity Study
| Offspring (n = 1671) | Controls (n = 744) | P-Value | |
| Demographics | |||
| Age in years, mean (SD) | 59.4 (6.5) | 58.7 (7.5) | 0.032 |
| Females, number (%) | 900 (54%) | 429 (58%) | 0.083 |
| Antropometrics | |||
| Height (cm), mean (95% CI) | 172.9 (172.5–173.2) | 172.9 (172.3–173.4) | 0.951 |
| Weight (kg), mean (95% CI) | 76.1 (75.4–76.8) | 76.8 (75.8–77.8) | 0.279 |
| Body mass index (kg/m2), mean (95% CI) | 25.4 (25.2–25.6) | 25.6 (25.3–25.9) | 0.268 |
| Disease prevalence | |||
| Diabetes Mellitus, number (%) | 60 (4%) | 47 (7%) | 0.003 |
| Hypertension, number (%) | 319 (23%) | 179 (28%) | 0.003 |
| Myocardial infarction, number (%) | 33 (2%) | 25 (4%) | 0.040 |
| Stroke, number (%) | 46 (3%) | 18 (3%) | 0.602 |
| Glucose metabolism | |||
| Glucose (mmol/L), mean (95% CI) | 5.75 (5.70–5.81) | 6.01 (5.92–6.09) | <0.001 |
| Insulin (mU/L), geometric mean (95% CI) | 16.1 (15.5–16.8) | 18.0 (16.9–19.1) | 0.006 |
Association of T2D risk alleles with diabetes and glucose levels
We observed an increasing prevalence of diabetes mellitus with an increasing number of T2D risk alleles (P = 0.011, Table 3). We also tested the association between numbers of risk alleles and serum parameters of glucose metabolism in the total group. With increasing numbers of risk alleles, we found an increase in glucose (P= 0.016) but not insulin (P=0.450). We found that the number of risk alleles was not associated with body mass index (BMI), and repeating the analyses with adjustment for BMI did not materially change the results (data not shown). After exclusion of participants with DM, statistical significance was lost for the association of number of alleles with levels of glucose (P = 0.089). In the oral glucose tolerance test increasing number of alleles associated with increasing area under the curve for glucose (P = 0.018).
Allele frequencies in partners and offspring
Next we tested the hypothesis that differences in allele frequencies of these SNPs could explain the observed difference in prevalence of DM and differences in glucose and insulin levels between offspring and controls (Table 4). For none of the SNPs, the allele frequency was significantly different between offspring from familial nonagenarians compared to their partners. Likewise, no differences were found in the mean number of T2D risk alleles between the groups of offspring and controls (14.5 vs. 14.5 respectively, P=0.977).
Interaction
To assess whether the offspring of nonagenarian sibling pairs were more protected against the influences of the risk alleles than the controls, we compared the increase in glucose dependent on the number of risk alleles in the offspring and controls. When analyzing offspring and controls separately, levels of glucose increased with an increasing number of number of risk alleles in offspring (P=0.016) and also in controls, albeit not significantly (P= 0.369). The increase in the control group did not reach statistical significance, possibly because of the smaller size of the group. The increase in glucose levels dependent on number of type 2 diabetes risk alleles was not different between offspring and partners (P for interaction = 0.538). A similar finding was found for the area under the curve in the oral glucose tolerance test (Figure 1). In both offspring and controls a similar trend was seen, albeit not statistically significant (P = 0.093 and P = 0.159 respectively) due to small samples size. There was no significant interaction (P = 0.797).
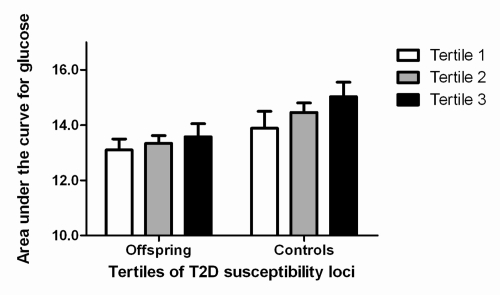
Figure 1. Association between increasing number of type 2 diabetes susceptibility loci, partitioned according to tertiles, and area under the curve for glucose. T2D: type 2 diabetes. Results were adjusted for sex and age. Number of participants per tertile for group of offspring: first tertile (n = 44), second tertile (n = 38), third tertile (n = 29). Number of participants per tertile for group of controls: first tertile (n = 33), second tertile (n = 38), third tertile (n = 34).
Table 3.
Association of the number of risk alleles associated with type 2 diabetes in offspring and partners combined
| Stratum of number of risk alleles | P for trend | ||||||||||||||||||||||||||||||||||||||||||||||||||||||||||||||||||||||||||||||||||||||||||||||||||
| 5-13 (n=731) | 14-15 (n=647) | 16-23 (n=712) | |||||||||||||||||||||||||||||||||||||||||||||||||||||||||||||||||||||||||||||||||||||||||||||||||
| Demographics | |||||||||||||||||||||||||||||||||||||||||||||||||||||||||||||||||||||||||||||||||||||||||||||||||||
| Age in years, mean (SD) | 59.2 (6.7) | 59.1 (6.8) | 59.6 (7.0) | 0.541 | |||||||||||||||||||||||||||||||||||||||||||||||||||||||||||||||||||||||||||||||||||||||||||||||
| Females, number (%) | 397 (54%) | 359 (56%) | 393 (55%) | 0.981 | |||||||||||||||||||||||||||||||||||||||||||||||||||||||||||||||||||||||||||||||||||||||||||||||
| Antropometrics | |||||||||||||||||||||||||||||||||||||||||||||||||||||||||||||||||||||||||||||||||||||||||||||||||||
| Height (m), mean (95% CI) | 172.6 (172.1-173.1) | 173.1 (172.6-173.7) | 173.0 (172.4-173.5) | 0.354 | |||||||||||||||||||||||||||||||||||||||||||||||||||||||||||||||||||||||||||||||||||||||||||||||
| Weight (kg), mean (95% CI) | 76.0 (75.0-77.0) | 76.5 (75.5-77.5) | 76.3 (75.3-77.3) | 0.446 | |||||||||||||||||||||||||||||||||||||||||||||||||||||||||||||||||||||||||||||||||||||||||||||||
| Body mass index (kg/m2), mean (95% CI) | 25.5 (25.2-25.8) | 25.5 (25.2-25.8) | 25.4 (25.1-25.7) | 0.859 | |||||||||||||||||||||||||||||||||||||||||||||||||||||||||||||||||||||||||||||||||||||||||||||||
| Disease prevalence | |||||||||||||||||||||||||||||||||||||||||||||||||||||||||||||||||||||||||||||||||||||||||||||||||||
| Diabetes Mellitus, number (%) | 24 (3%) | 28 (4%) | 39 (6%) | 0.011 | |||||||||||||||||||||||||||||||||||||||||||||||||||||||||||||||||||||||||||||||||||||||||||||||
| Hypertension, number (%) | 140 (19%) | 124 (21%) | 153 (22%) | 0.188 | |||||||||||||||||||||||||||||||||||||||||||||||||||||||||||||||||||||||||||||||||||||||||||||||
| Myocardial infarction, number (%) | 21 (3%) | 12 (2%) | 19 (3%) | 0.133 | |||||||||||||||||||||||||||||||||||||||||||||||||||||||||||||||||||||||||||||||||||||||||||||||
| Stroke, number (%) | 20 (3%) | 16 (3%) | 19 (3%) | 0.194 | |||||||||||||||||||||||||||||||||||||||||||||||||||||||||||||||||||||||||||||||||||||||||||||||
| Glucose metabolism | |||||||||||||||||||||||||||||||||||||||||||||||||||||||||||||||||||||||||||||||||||||||||||||||||||
| Glucose (mmol/L), mean (95% CI) | 5.78 (5.70-5.87) | 5.79 (5.69-5.88) | 5.90 (5.82-5.99) | 0.016 | |||||||||||||||||||||||||||||||||||||||||||||||||||||||||||||||||||||||||||||||||||||||||||||||
| Insulin (mU/L), geometric mean (95% CI) | 16.9 (16.0-18.0) | 16.6 (15.5-17.6) | 16.3 (15.3-17.5) | 0.450 | |||||||||||||||||||||||||||||||||||||||||||||||||||||||||||||||||||||||||||||||||||||||||||||||
| P-values were calculated with the number of risk alleles as continuous variable, adjusting for age and sex, and using robust standard errors to account for family relationships among the offspring. | |||||||||||||||||||||||||||||||||||||||||||||||||||||||||||||||||||||||||||||||||||||||||||||||||||
Table 4.
Comparison of allele frequencies and number of risk alleles associated with type 2 diabetes in offspring and controls
| Offspring (n = 1671) | Controls (n = 744) | P-Value | |||||||||||||||||||||||||||||||||||||||||||||||||||||||||||||||||||||||||||||||||||||||||||||||||
| Rs10497721 | 0.09 | 0.10 | 0.918 | ||||||||||||||||||||||||||||||||||||||||||||||||||||||||||||||||||||||||||||||||||||||||||||||||
| Rs1801282 | 0.87 | 0.88 | 0.363 | ||||||||||||||||||||||||||||||||||||||||||||||||||||||||||||||||||||||||||||||||||||||||||||||||
| Rs4402960 | 0.29 | 0.31 | 0.355 | ||||||||||||||||||||||||||||||||||||||||||||||||||||||||||||||||||||||||||||||||||||||||||||||||
| Rs10010131 | 0.56 | 0.59 | 0.152 | ||||||||||||||||||||||||||||||||||||||||||||||||||||||||||||||||||||||||||||||||||||||||||||||||
| Rs7754840 | 0.33 | 0.32 | 0.559 | ||||||||||||||||||||||||||||||||||||||||||||||||||||||||||||||||||||||||||||||||||||||||||||||||
| Rs13266634 | 0.70 | 0.69 | 0.594 | ||||||||||||||||||||||||||||||||||||||||||||||||||||||||||||||||||||||||||||||||||||||||||||||||
| Rs564398 | 0.57 | 0.57 | 0.970 | ||||||||||||||||||||||||||||||||||||||||||||||||||||||||||||||||||||||||||||||||||||||||||||||||
| Rs10811661 | 0.83 | 0.82 | 0.473 | ||||||||||||||||||||||||||||||||||||||||||||||||||||||||||||||||||||||||||||||||||||||||||||||||
| Rs1111875 | 0.60 | 0.59 | 0.280 | ||||||||||||||||||||||||||||||||||||||||||||||||||||||||||||||||||||||||||||||||||||||||||||||||
| Rs7903146 | 0.27 | 0.27 | 0.816 | ||||||||||||||||||||||||||||||||||||||||||||||||||||||||||||||||||||||||||||||||||||||||||||||||
| Rs5219 | 0.35 | 0.37 | 0.409 | ||||||||||||||||||||||||||||||||||||||||||||||||||||||||||||||||||||||||||||||||||||||||||||||||
| Rs1495377 | 0.50 | 0.50 | 0.754 | ||||||||||||||||||||||||||||||||||||||||||||||||||||||||||||||||||||||||||||||||||||||||||||||||
| Rs8050136 | 0.38 | 0.37 | 0.771 | ||||||||||||||||||||||||||||||||||||||||||||||||||||||||||||||||||||||||||||||||||||||||||||||||
| Rs4430796 | 0.49 | 0.48 | 0.399 | ||||||||||||||||||||||||||||||||||||||||||||||||||||||||||||||||||||||||||||||||||||||||||||||||
| Rs757210 | 0.39 | 0.38 | 0.357 | ||||||||||||||||||||||||||||||||||||||||||||||||||||||||||||||||||||||||||||||||||||||||||||||||
| Mean number of risk alleles | 14.5 | 14.5 | 0.977 | ||||||||||||||||||||||||||||||||||||||||||||||||||||||||||||||||||||||||||||||||||||||||||||||||
| (95% CI) | (14.4-14.6) | (14.3-14.7) | |||||||||||||||||||||||||||||||||||||||||||||||||||||||||||||||||||||||||||||||||||||||||||||||||
| Allele frequencies are reported for the T2D risk alleles. P-values report difference in genotype trend between offspring and partners and account for family relations among the offspring by using robust standard errors. | |||||||||||||||||||||||||||||||||||||||||||||||||||||||||||||||||||||||||||||||||||||||||||||||||||
Discussion
The main findings of the present study are twofold. First, we were able to replicate the association of SNPs discovered by GWA's with T2D to associate with prevalence of diabetes and with glucose levels in the Leiden Longevity Study. Second, these polymorphisms did not differ in frequency or association with glucose levels between offspring of long-lived siblings and their partners.
Despite our relatively small cohort, we were able to confirm in our population that SNPs associated with T2D in GWA's also associate with prevalence of diabetes and levels of glucose in the Leiden Longevity Study. The effect sizes of associations with single SNPs identified by GWAs are generally low. Because our study population is relatively small to detect such small effect size we calculated the total number of risk alleles for each individual, to maximize power. This model assumes that there may be an additive effect of the SNPs. We then stratified the total study population in tertiles of the numbers of risk alleles. Our findings are in line with a recent publication [14], in which it was described that an increasing number of risk alleles was associated with an increased prevalence of diabetes.
We found no association of T2D risk alleles with familial longevity. Previously, in the same cohort we found the offspring to have better glucose tolerance than controls [5], which in clamp studies was concluded to result from differences in peripheral glucose disposure [15] In the present study we do replicate the association of the SNPs with glucose metabolism, yet there was no difference in allele frequency between offspring and controls. One possible explanation lies in the function of the selected SNPs. Ten of the fifteen selected SNPs are associated with alterations in beta cell response [16]. Although the main driver of T2D is peripheral insulin resistance, compromised beta cell function is believed to be an important (genetic) factor in the pathogenesis of T2D. The onset of type 2 diabetes occurs when beta-cell function cannot compensate for the high levels of insulin needed due to the peripheral insulin resistance. The fact that we find here that these SNPs do not account for the beneficial glucose handling in longevity is in line with our observation that beta cell function does not differ between partners and offspring in an oral glucose tolerance test [5]. The difference in glucose handling between offspring and controls might rather be determined by enhanced insulin sensitivity of the liver or peripheral tissues. Furthermore, in the same study population, we recently found no difference in disease risk allele frequencies between the long-lived parents of the offspring and younger controls [17]. This implicates that longevity that longevity is not compromised by risk alleles, but may rather be determined by protective alleles specific for longevity. Such mechanisms may for instance involve nutrient sensing pathways, such as mTOR, that affect insulin sensitivity [18]. Indeed, also in our study population, differential expression in mTOR signaling components was observed between offspring and controls in preliminary analyses [19]. More research is needed to elucidate the determinants of insulin sensitivity. Taken together these data suggest that SNPs that associate with T2D identified by GWA studies and that associate with beta cell function are not major determinants of the beneficial glucose tolerance that characterizes familial longevity.
Methods
The Leiden Longevity Study
Nonagenarian sibling pairs were included when aged older than 89 years for men and 91 years for women and having at least one sister or a brother fulfilling these age criteria, who was also willing to participate. Because proper controls are lacking at very high ages, the offspring of the nonagenarian siblings were asked to be included in the study as well. The partners thereof were included in the study to serve as a control group, representing the general population at an age comparable to the offspring. The total study population, excluding the nonagenarian siblings, consisted of 2415 participants (1671 offspring; 744 partners). The Medical Ethical Committee of the Leiden University Medical Centre approved the study and informed consent was obtained from all participants.
Phenotyping
Blood samples were taken at baseline for extraction of DNA and the determination of non-fasted serum parameters. Glucose and insulin were available for 2337 and 2287 participants respectively. We collected additional information and biomaterials from the generation of offspring and partners, including self-reported information on life style and bodily measures. Body height and weight were obtained from 1670 participants. Body mass index was calculated from these data. Information on medical history was requested from the participants' general practitioners. In a subgroup of 234 offspring and their partners we performed an oral glucose tolerance test. We calculated the area under the curve for each individual as a measure of glucose tolerance [5].
Genotyping
Selection of Polymorphisms. We reviewed 266 GWAS that were published up to February 2009 (http://www.genome.gov/26525384), 10 of which reported on type-2 diabetes. These 10 GWAS reported 13 loci to be associated with type 2 diabetes (T2D) within at least two independent GWAS. To compile a set of disease risk alleles for each locus the most replicated SNP was selected and subsequently, in case of equal number of replications, the SNP with the lowest reported p-value. For two loci, one additional SNP was selected that was in low to moderate LD (r2 < 0.80) with the most replicated SNP. Thus 15 SNPs were selected for analysis, covering 13 loci (see Table 1).
Genotyping. These 15 SNPs were genotyped using Sequenom iPLEX. The average genotype call rate for these SNPs was 96.9% and the average concordance rate was 99.7% among 128 duplicated control samples. Complete genotyping of all 15 SNPs succeeded in 2090 participants (87%). Because in complex human traits, single mutations are not expected to have large effects and are therefore hard to identify [20], we calculated for each individual the total number of T2D risk alleles. Demographic and antropometric data, disease prevalence and levels of glucose and insulin were compared between these groups. Allele frequencies were comparable to those described in the literature and all genotype distributions were in Hardy-Weinberg equilibrium.
Statistical Analysis
Continuous data were distributed normally except for levels of insulin, which was log transformed. Age, sex and disease prevalence frequencies are reported unadjusted. Means and 95% confidence intervals of antropometrics, glucose and insulin are reported adjusted for age and sex. Differences in disease prevalence between groups were assessed using logistic regression, adjusting for age and sex. Difference in antropometrics and levels of glucose and insulin were calculated using a linear regression model adjusting for age and sex. All p-values for differences between groups were adjusted for family relationships using robust standard errors, except for age and sex, which were calculated crude. Differences were considered significant when the p value was below 0.05. All statistical analyses were performed with STATA (version 10.0, USA) and SPSS (version 16.0, USA), and in all analyses we made use of robust standard errors to account for familial relationships among the offspring.
Acknowledgments
This work was supported by the Innovation Oriented research Program on Genomics (SenterNovem; IGE01014 and IGE5007), the Centre for Medical Systems Biology (CMSB), the Netherlands Genomics Initiative/Netherlands Organization for scientific research (NGI/NWO; 05040202 and 050-060-810. NCHA) and the EU funded Network of Excellence Lifespan (FP6 036894). PES is supported by an unrestricted grant from the Netherlands Genomics Initiative (NCHA 050-060-810).
Conflicts of Interest
The authors of this manuscript have no conflict of interests to declare.
References
- 1. Westendorp RG, van Heemst D, Rozing MP, Frolich M, Mooijaart SP, Blauw GJ, Beekman M, Heijmans BT, de Craen AJ, Slagboom PE. Nonagenarian siblings and their offspring display lower risk of mortality and morbidity than sporadic nonagenarians: The Leiden Longevity Study. J Am Geriatr Soc. 2009; 57: 1634 -1637. [PubMed] .
- 2. Bartke A. Insulin and aging. Cell Cycle. 2008; 7: 3338 -3343. [PubMed] .
- 3. Pawlikowska L, Hu D, Huntsman S, Sung A, Chu C, Chen J, Joyner AH, Schork NJ, Hsueh WC, Reiner AP, Psaty BM, Atzmon G, Barzilai N, et al. Association of common genetic variation in the insulin/IGF1 signaling pathway with human longevity. Aging Cell. 2009; 8: 460 -472. [PubMed] .
- 4. van Heemst D, Beekman M, Mooijaart SP, Heijmans BT, Brandt BW, Zwaan BJ, Slagboom PE, Westendorp RG. Reduced insulin/IGF-1 signalling and human longevity. Aging Cell. 2005; 4: 79 -85. [PubMed] .
- 5. Rozing MP, Westendorp RG, de Craen AJ, Frolich M, de Goeij MC, Heijmans BT, Beekman M, Wijsman CA, Mooijaart SP, Blauw GJ, Slagboom EP, van Heemst D. Favorable glucose tolerance and lower prevalence of metabolic syndrome in non-diabetic offspring of nonagenarian siblings: the Leiden Longevity Study. J Am Geriatr Soc. 2010; 58: 564 -569. [PubMed] .
- 6. Sladek R, Rocheleau G, Rung J, Dina C, Shen L, Serre D, Boutin P, Vincent D, Belisle A, Hadjadj S, Balkau B, Heude B, Charpentier G. A genome-wide association study identifies novel risk loci for type 2 diabetes. Nature. 2007; 445: 881 -885. [PubMed] .
- 7. Saxena R, Voight BF, Lyssenko V, Burtt NP, de Bakker PI, Chen H, Roix JJ, Kathiresan S, Hirschhorn JN, Daly MJ, Hughes TE, Groop L, Altshuler D, et al. Genome-wide association analysis identifies loci for type 2 diabetes and triglyceride levels. Science. 2007; 316: 1331 -1336. [PubMed] .
- 8. Scott LJ, Mohlke KL, Bonnycastle LL, Willer CJ, Li Y, Duren WL, Erdos MR, Stringham HM, Chines PS, Jackson AU, Prokunina-Olsson L, Ding CJ, Swift AJ, Narisu N, et al. A genome-wide association study of type 2 diabetes in Finns detects multiple susceptibility variants. Science. 2007; 316: 1341 -1345. [PubMed] .
- 9. Welcome Trust Case Control Consortium. Genome-wide association study of 14,000 cases of seven common diseases and 3,000 shared controls. Nature. 2007; 447: 661 -678. [PubMed] .
- 10. Tabara Y, Osawa H, Kawamoto R, Onuma H, Shimizu I, Miki T, Kohara K, Makino H. Replication study of candidate genes associated with type 2 diabetes based on genome-wide screening. Diabetes. 2009; 58: 493 -498. [PubMed] .
- 11. Zeggini E, Scott LJ, Saxena R, Voight BF, Marchini JL, Hu T, de Bakker PI, Abecasis GR, Almgren P, Andersen G, Ardlie K, Bostrom KB, Bergman RN, et al. Meta-analysis of genome-wide association data and large-scale replication identifies additional susceptibility loci for type 2 diabetes. Nat Genet. 2008; 40: 638 -645. [PubMed] .
- 12. Cho YM, Kim TH, Lim S, Choi SH, Shin HD, Lee HK, Park KS, Jang HC. Type 2 diabetes-associated genetic variants discovered in the recent genome-wide association studies are related to gestational diabetes mellitus in the Korean population. Diabetologia. 2009; 52: 253 -261. [PubMed] .
- 13. Schoenmaker M, de Craen AJ, de Meijer PH, Beekman M, Blauw GJ, Slagboom PE, Westendorp RG. Evidence of genetic enrichment for exceptional survival using a family approach: the Leiden Longevity Study. Eur J Hum Genet. 2006; 14: 79 -84. [PubMed] .
- 14. Lango H, Palmer CN, Morris AD, Zeggini E, Hattersley AT, McCarthy MI, Frayling TM, Weedon MN. Assessing the combined impact of 18 common genetic variants of modest effect sizes on type 2 diabetes risk. Diabetes. 2008; 57: 3129 -3135. [PubMed] .
- 15. Wijsman CA, Rozing MP, Streefland TC, Le Cessie S, Mooijaart SP, Slagboom PE, Westendorp RG, Pijl H, van Heemst D. Familial longevity is marked by enhanced insulin sensitivity. Aging Cell. 2010; 10: https://doi.org/10.1111/j.1474-9726.2010.00650.x [Epub ahead of print] .
- 16. McCarthy MI and Zeggini E. Genome-wide association studies in type 2 diabetes. Curr Diab Rep. 2009; 9: 164 -171. [PubMed] .
- 17. Beekman M, Nederstigt C, Suchiman HE, Kremer D, van der Breggen R, Lakenberg N, Alemayehu WG, de Craen AJ, Westendorp RG, Boomsma DI, de Geus EJ, Houwing-Duistermaat JJ, Heijmans BT, et al. Genome-wide association study (GWAS)-identified disease risk alleles do not compromise human longevity. Proc Natl Acad Sci U S A. 2010; 107: 18046 -18049. [PubMed] .
- 18. Blagosklonny MV. Validation of anti-aging drugs by treating age-related diseases. Aging. 2009; 1: 281 -288. [PubMed] .
- 19. Slagboom PE, Beekman M, Passtoors WM, Deelen J, Vaarhorst AA, Boer JM, van den Akker EB, van Heemst D, de Craen AJ, Maier AB, Rozing M, Mooijaart SP, Heijmans BT, et al. Genomics of human longevity. Philos Trans R Soc Lond B Biol Sci. 2011; 366: 35 -42. [PubMed] .
- 20. Kuningas M, Mooijaart SP, van Heemst D, Zwaan BJ, Slagboom PE, Westendorp RG. Genes encoding longevity: from model organisms to humans. Aging Cell. 2008; 7: 270 -280. [PubMed] .
- 21. Meigs JB, Manning AK, Fox CS, Florez JC, Liu C, Cupples LA, Dupuis J. Genome-wide association with diabetes-related traits in the Framingham Heart Study. BMC Med Genet. 2007; 8: Suppl 1 S16 [PubMed] .
- 22. Sanghera DK, Ortega L, Han S, Singh J, Ralhan SK, Wander GS, Mehra NK, Mulvihill JJ, Ferrell RE, Nath SK, Kamboh MI. Impact of nine common type 2 diabetes risk polymorphisms in Asian Indian Sikhs: PPARG2 (Pro12Ala), IGF2BP2, TCF7L2 and FTO variants confer a significant risk. BMC Med Genet. 2008; 9: 59 [PubMed] .
- 23. Lee YH, Kang ES, Kim SH, Han SJ, Kim CH, Kim HJ, Ahn CW, Cha BS, Nam M, Nam CM, Lee HC. Association between polymorphisms in SLC30A8, HHEX, CDKN2A/B, IGF2BP2, FTO, WFS1, CDKAL1, KCNQ1 and type 2 diabetes in the Korean population. J Hum Genet. 2008; 53: 991 -998. [PubMed] .
- 24. Schafer SA, Mussig K, Staiger H, Machicao F, Stefan N, Gallwitz B, Haring HU, Fritsche A. A common genetic variant in WFS1 determines impaired glucagon-like peptide-1-induced insulin secretion. Diabetologia. 2009; 52: 1075 -1082. [PubMed] .
- 25. Duesing K, Fatemifar G, Charpentier G, Marre M, Tichet J, Hercberg S, Balkau B, Froguel P, Gibson F. Strong association of common variants in the CDKN2A/CDKN2B region with type 2 diabetes in French Europids. Diabetologia. 2008; 51: 821 -826. [PubMed] .
- 26. Pivovarova O, Nikiforova VJ, Pfeiffer AF, Rudovich N. The influence of genetic variations in HHEX gene on insulin metabolism in the German MESYBEPO cohort. Diabetes Metab Res Rev. 2009; 25: 156 -162. [PubMed] .
- 27. Nordman S, Ostenson CG, Efendic S, Gu HF. Loci of TCF7L2, HHEX and IDE on chromosome 10q and the susceptibility of their genetic polymorphisms to type 2 diabetes. Exp Clin Endocrinol Diabetes. 2009; 117: 186 -190. [PubMed] .
- 28. Omori S, Tanaka Y, Takahashi A, Hirose H, Kashiwagi A, Kaku K, Kawamori R, Nakamura Y, Maeda S. Association of CDKAL1, IGF2BP2, CDKN2A/B, HHEX, SLC30A8, and KCNJ11 with susceptibility to type 2 diabetes in a Japanese population. Diabetes. 2008; 57: 791 -795. [PubMed] .
- 29. Thorsby PM, Midthjell K, Gjerlaugsen N, Holmen J, Hanssen KF, Birkeland KI, Berg JP. Comparison of genetic risk in three candidate genes (TCF7L2, PPARG, KCNJ11) with traditional risk factors for type 2 diabetes in a population-based study—the HUNT study. Scand J Clin Lab Invest. 2009; 69: 282 -287. [PubMed] .
- 30. Ng MC, Park KS, Oh B, Tam CH, Cho YM, Shin HD, Lam VK, Ma RC, So WY, Cho YS, Kim HL, Lee HK, Chan JC, Cho NH. Implication of genetic variants near TCF7L2, SLC30A8, HHEX, CDKAL1, CDKN2A/B, IGF2BP2, and FTO in type 2 diabetes and obesity in 6,719 Asians. Diabetes. 2008; 57: 2226 -2233. [PubMed] .
- 31. Winckler W, Weedon MN, Graham RR, McCarroll SA, Purcell S, Almgren P, Tuomi T, Gaudet D, Bostrom KB, Walker M, Hitman G, Hattersley AT, McCarthy MI, et al. Evaluation of common variants in the six known maturity-onset diabetes of the young (MODY) genes for association with type 2 diabetes. Diabetes. 2007; 56: 685 -693. [PubMed] .
- 32. Gudmundsson J, Sulem P, Steinthorsdottir V, Bergthorsson JT, Thorleifsson G, Manolescu A, Rafnar T, Gudbjartsson D, Agnarsson BA, Baker A, Sigurdsson A, Benediktsdottir KR, et al. Two variants on chromosome 17 confer prostate cancer risk, and the one in TCF2 protects against type 2 diabetes. Nat Genet. 2007; 39: 977 -983. [PubMed] .