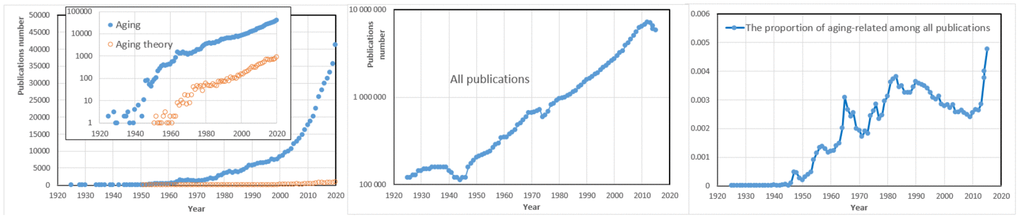
Figure 2.Historical trends of the annual numbers of scholarly publications on aging. Numerical estimates are obtained from PubMed. Left: Returns to queries “aging” and “aging theory” (a semilogarithmic plot is in the insert). Center: Semilogarithmic plot for all publications indexed in PubMed. Right: Proportion of aging-related publications among all indexed publications.