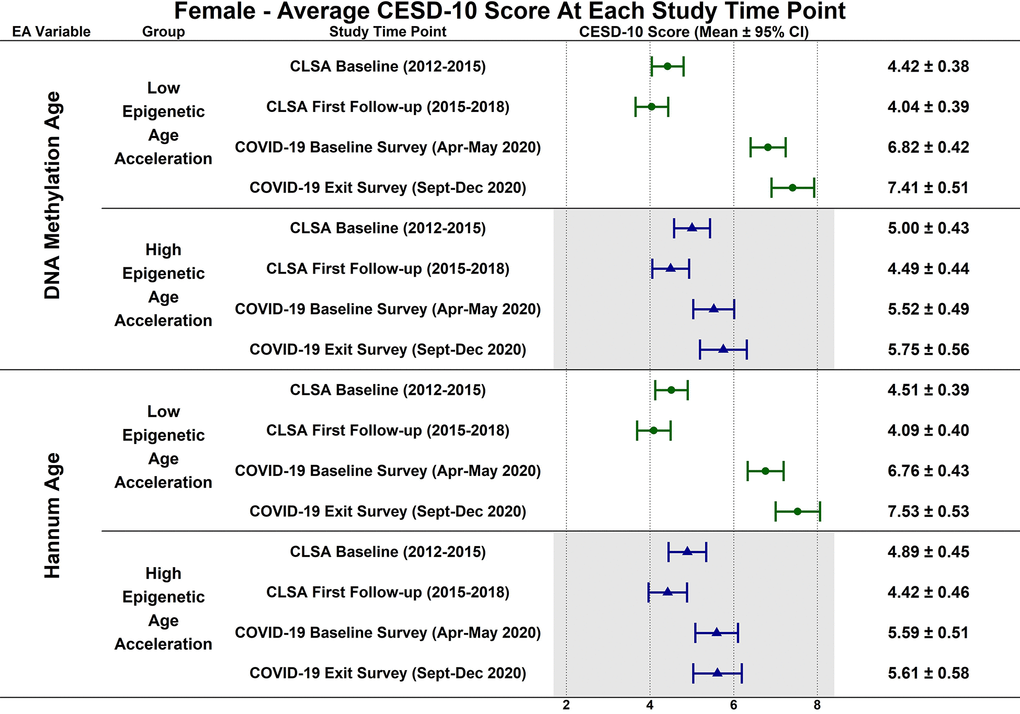
Figure 3.Differences in estimated mean 10-item center for epidemiological studies depression scale (CESD-10) scores in 305 females at each study timepoint for each epigenetic age marker based on low (-1 SD) and high (+1 SD) epigenetic age from exploratory, uncorrected analyses.