Submit an Article
Navigate
Home
Editorial Board
Editorial Policies
Current Volume
Archive
Scientific Integrity
Publication Ethics Statements
Interviews with Outstanding Authors
Newsroom
Sponsored Conferences
Podcast
Contact
Special Collections
Submit an Article
Online ISSN: 1945-4589
Research Paper
|
Volume 17, Issue 10
|
pp. 2582–2597
Identification of key genes with differential correlations in prostate cancer
Back to article
Figure 9
(9 of 11)
−
100%
+
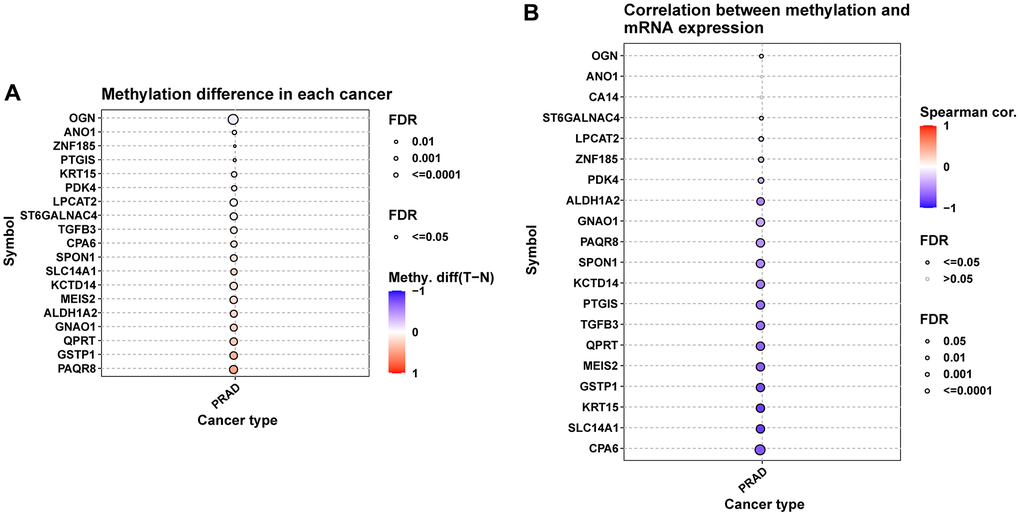
Figure 9.
Methylation analysis of hub genes.
(
A
) Figure summarizes the methylation difference between tumor and normal samples of hub genes in TCGA-PRAD. (
B
) Figure summarizes the correlation of methylation level with their mRNA expression TCGA-PRAD.