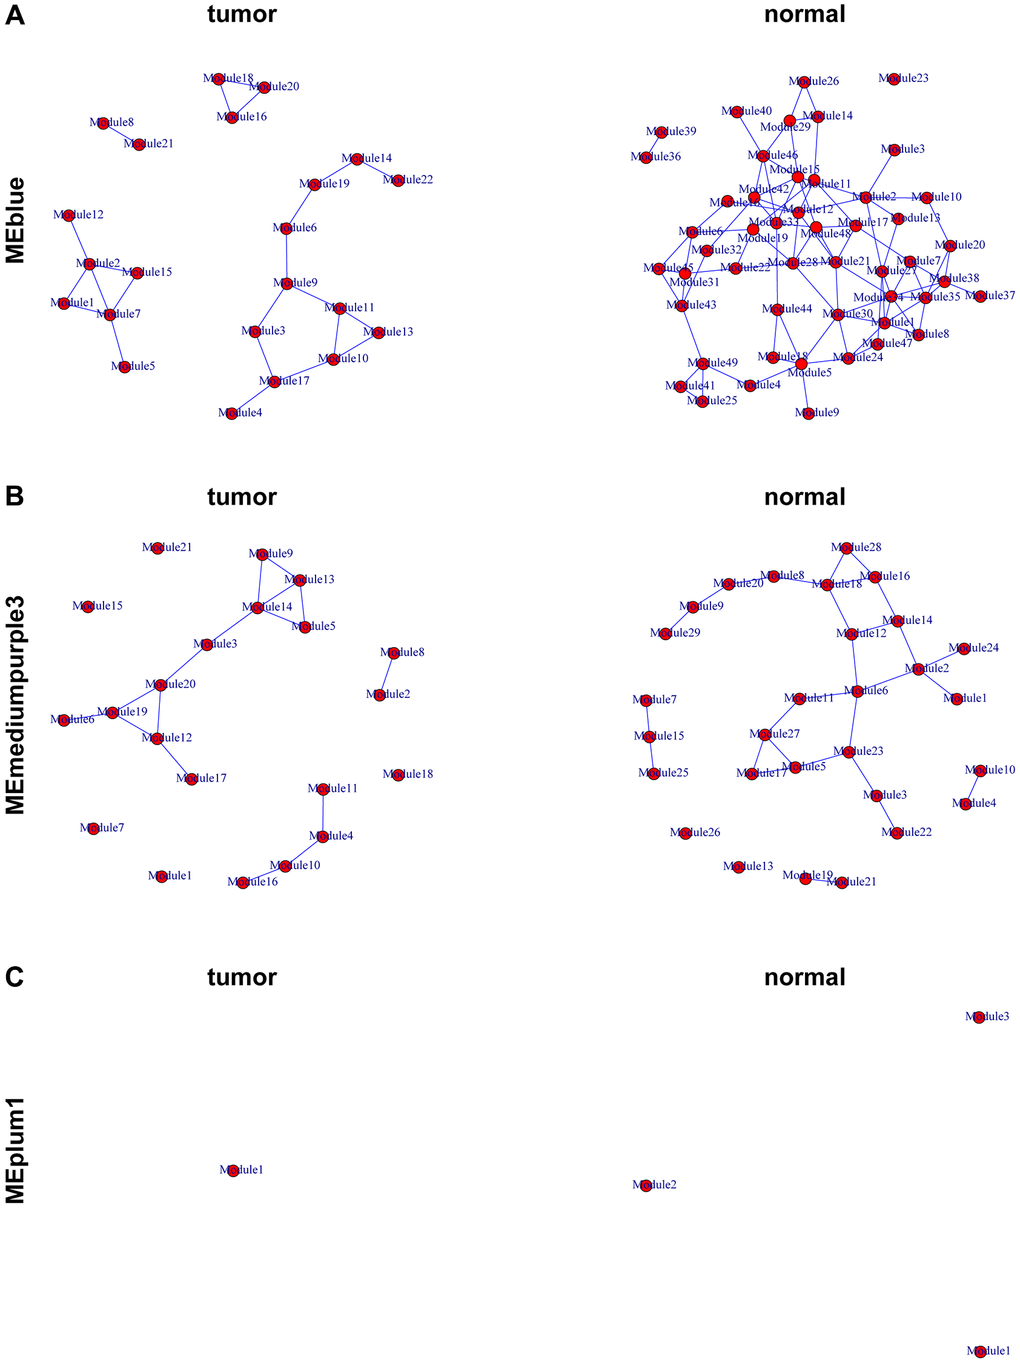
Figure 4.Representation of the module networks. Images of MEblue (A), MEmediumpurple3 (B), and MEplum1 (C) module networks from the TCGA-PRAD were shown. Each node represented one module, and each edge represented the module correlation.
Figure 4 — Identification of key genes with differential correlations in prostate cancer | Aging