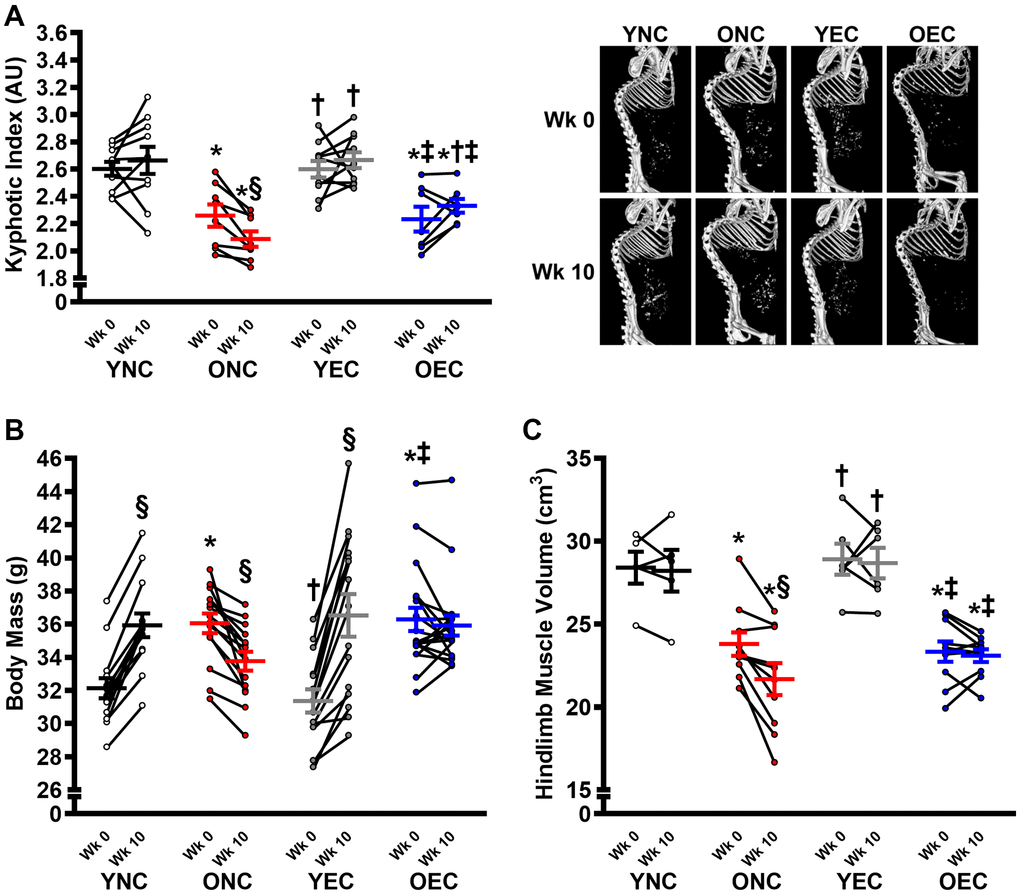
Figure 4.Frailty, body mass, and muscle characteristics in young normal chow (YNC), old normal chow (ONC), young Endocalyx™ treatment (YEC), and old Endocalyx™ treatment (OEC) mice. (A) Kyphosis index at Week 0 and Week 10 with representative images. (B) Body mass at Week 0 and Week 10. (C) Hindlimb muscle volume at Week 0 and Week 10. Data are presented as mean ± SEM. *P < 0.05 vs. YNC; †P < 0.05 vs. ONC; ‡P < 0.05 vs. YEC; §P < 0.05 vs. Week 0. N = 5–15/group.