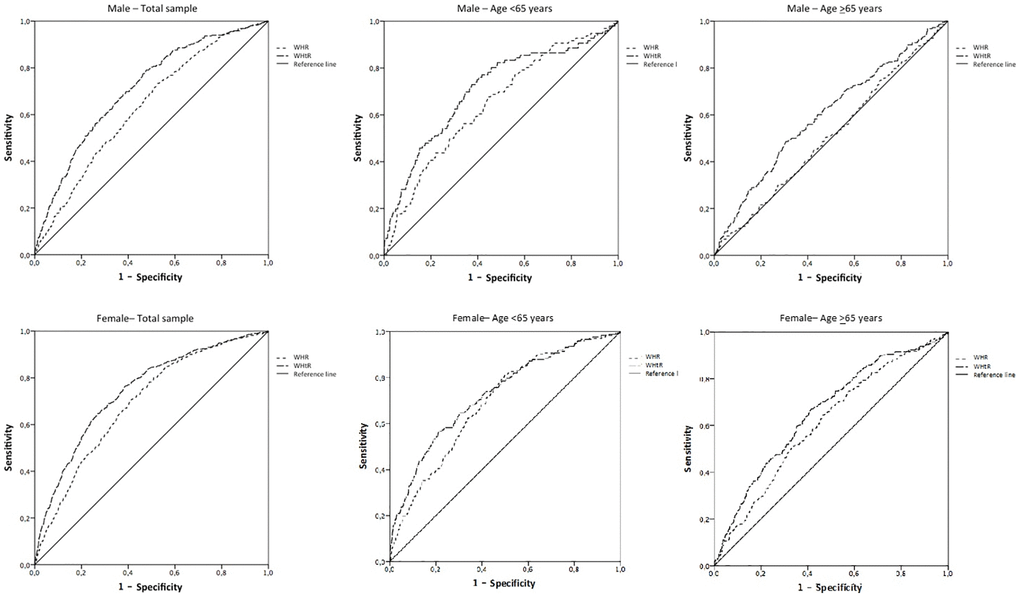
Figure 3.Receiver operating characteristic (ROC) curve analysis for predicting lower physical performance (by means time to complete chair stand test more than 10.8 seconds) according to waist-to-hip (WHR) and waist-to-height (WHtR) ratios. The ROC curve analysis revealed that the areas under the curves (AUCs) were: (1) Male total sample: WHR = 0.63; WHtR = 0.70. (2) Male age <65 years: WHR = 0.64; WHtR = 0.70. (3) Male age >65 years: WHR = 0.51; WHtR = 0.60. (4) Female total sample: WHR = 0.69; WHtR = 0.75. (5) Male age <65 years: WHR = 0.69; WHtR = 0.73. (6) Male age >65 years: WHR = 0.60; WHtR = 0.67.