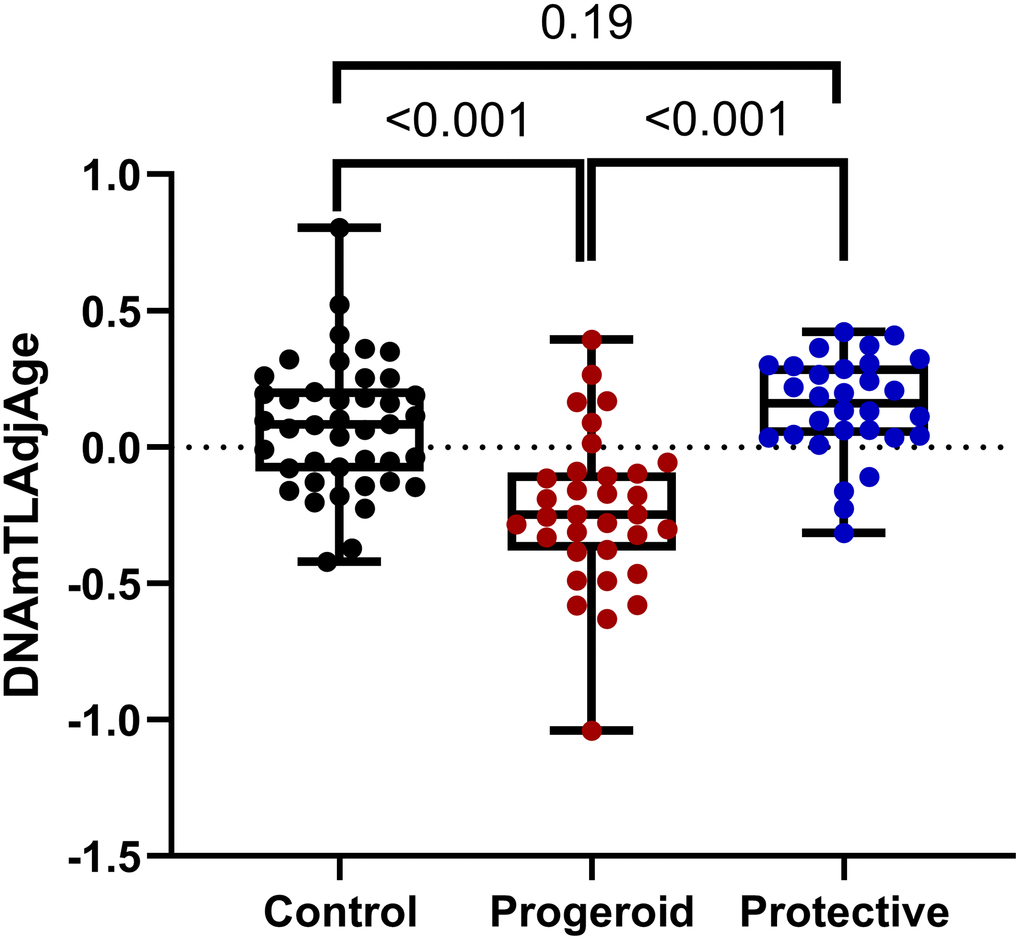
Figure 5.Comparison of DNAmTLAdjAge across various groups: boxplots illustrate the comparison of DNAmTLAdjAge across different groups, including controls older than 10 years (n = 42), progeroid patients older than 10 years (n = 33), and the protective group (n = 30). The protective group comprises individuals carrying various protective variants in APOE, PCSK9, and APOC3. Statistical significance was assessed using an ANOVA test.