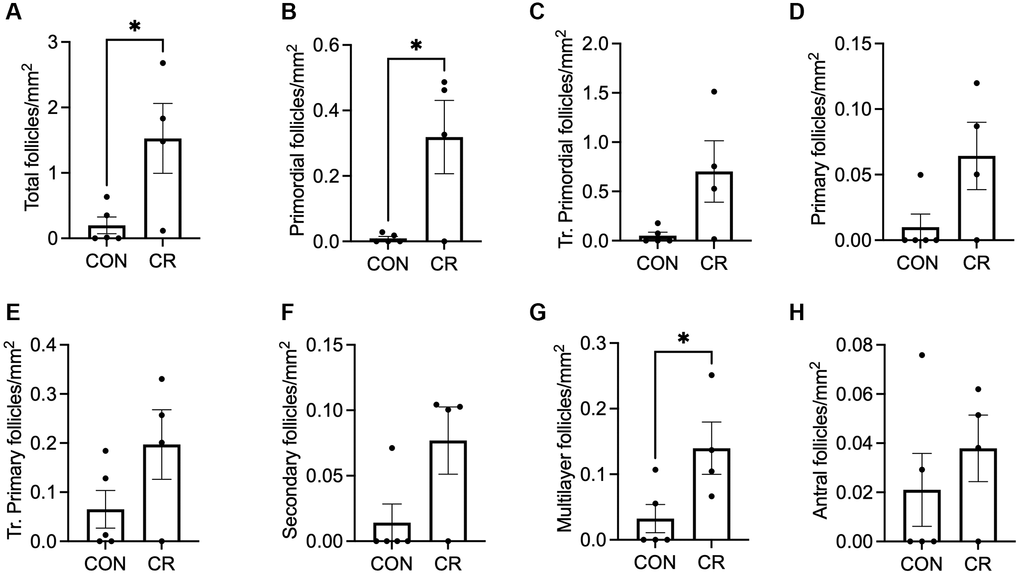
Figure 6.Follicle number per area as a function of diet in old animals with irregular cycles. Bar graphs of follicle number of normal morphology per ovarian section area are shown for the following classes: (A) total number of follicles, (B) primordial, (C) transitional primordial, (D) primary, (E) transitional primary, (F) secondary, (G) multilayer, and (H) antral follicles. Data are presented as mean ± SEM. Statistics were calculated using an unpaired t-test. *p ≤ 0.05.