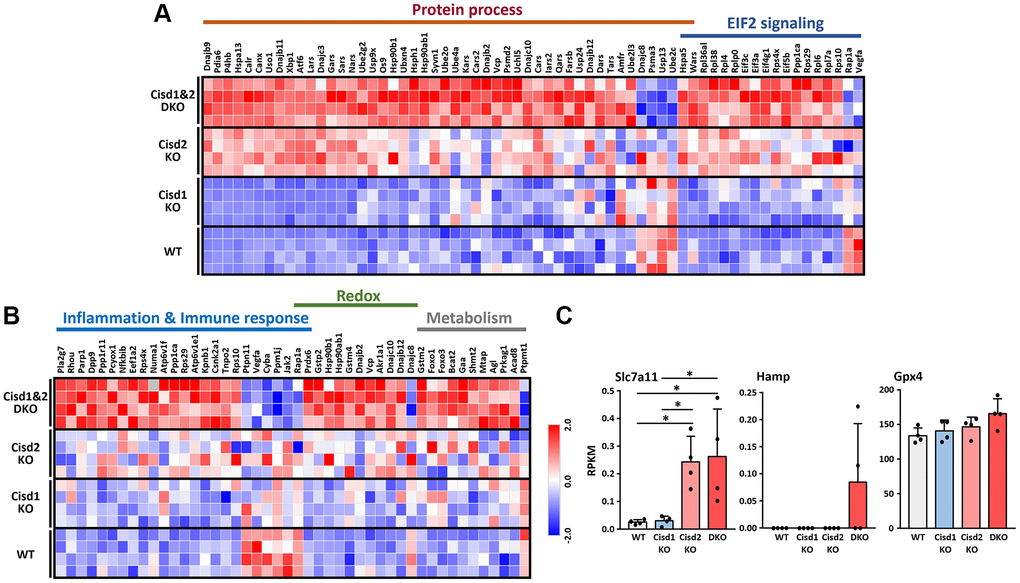
Figure 7.RNA sequencing data in skeletal muscles presented as a heatmap. (A) Heatmap analysis of genes in the pathways showed significant changes in both CIsd2 KO and Cisd1&2 DKO muscles. (B) Heatmap analysis of genes in the pathways showed significant changes in Cisd1&2 DKO muscles alone. (C) The expression levels of genes that are involved in programmed cell death, ferroptosis. Data are presented as mean ± SD. *p < 0.05. The data were analyzed by one-way ANOVA and the Turkey post hoc test.