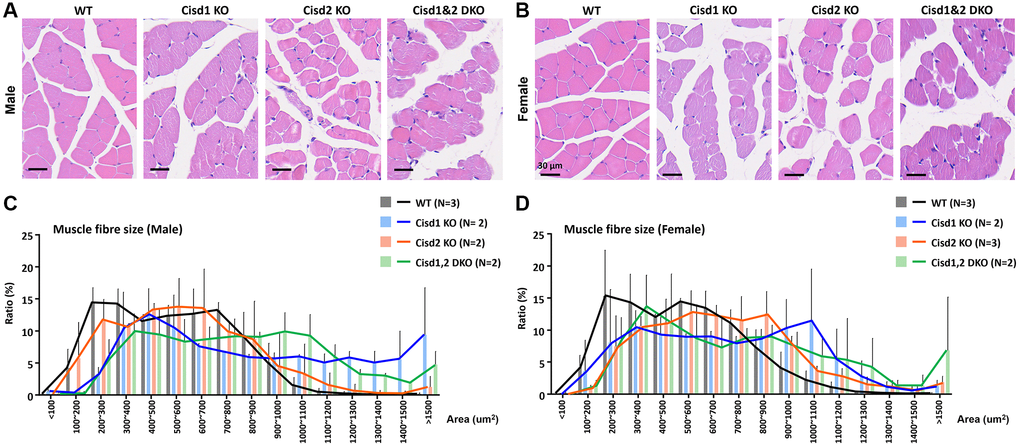
Figure 3.Histological analysis of skeletal muscle in the Cisd1&2 DKO mice. (A, B) H&E staining analysis of skeletal muscle (femoris) in Cisd1 KO, Cisd2 KO and Cisd1&2 DKO mice at 5 weeks old. Scale bar, 30 μm. (C, D) Histograms of muscle fiber size in male and female Cisd1 KO, Cisd2 KO and Cisd1&2 DKO mice. Data was shown as mean± SD. In (C, D), Kruskal-Wallis test with Dunn’s multiple comparisons test was performed to analyze the statistical differences among genotypes and did not find the statistical difference.