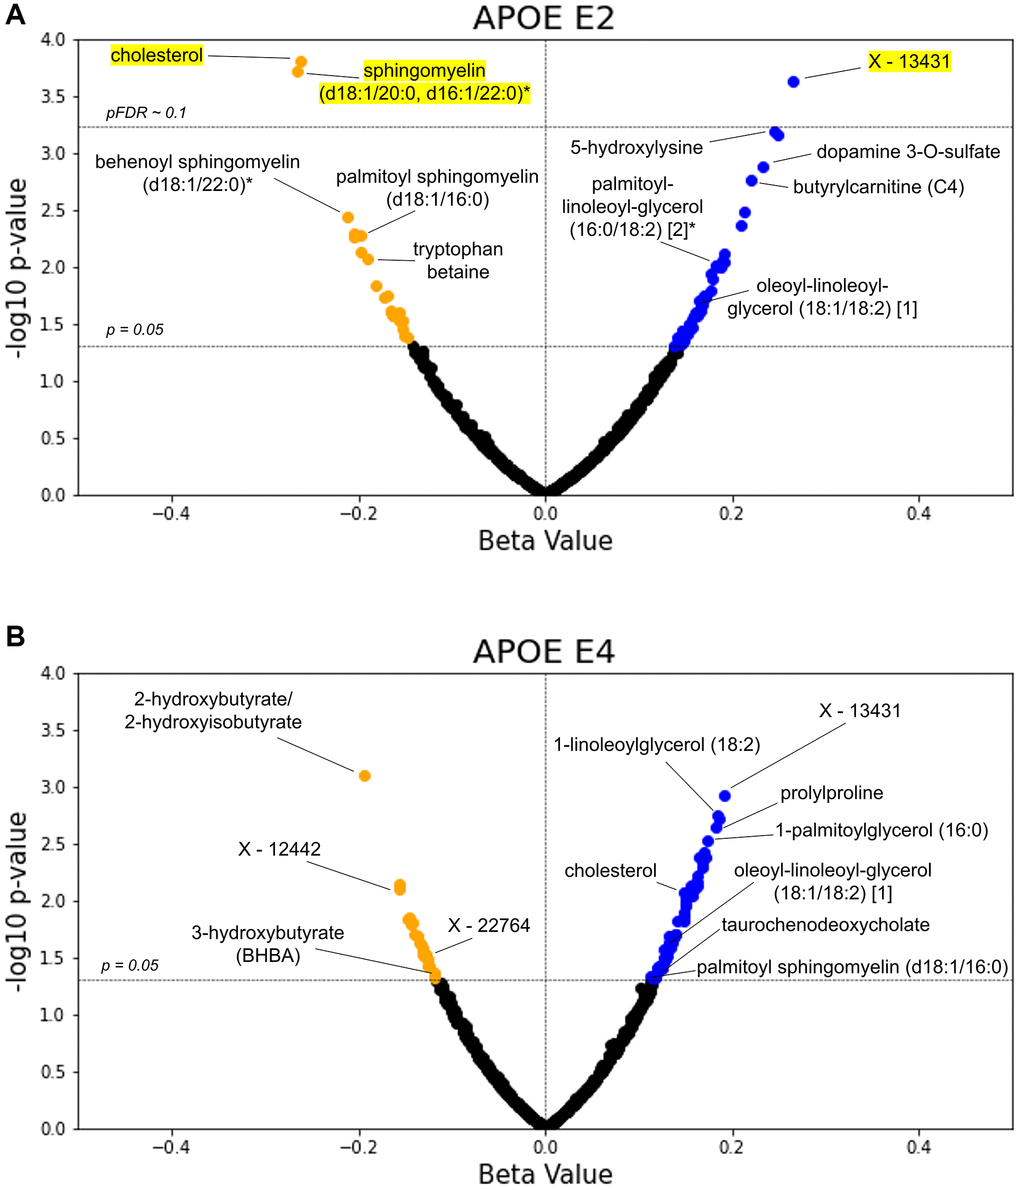
Figure 4.TwinsUK validates lipids as top APOE associated metabolites. The β-coefficient estimates for the APOE E2 (A) and E4 (B) groups are plotted against their -log10 pre-adjusted p-value from the metabolite GLMs. Blue data points indicate a positive association between metabolite and test group with pre-adjusted p < 0.05, whereas orange points indicate a negative pre-adjusted association. Yellow highlighting indicates significance after multiple hypothesis testing (pFDR < 0.1, Benjamini-Hochberg method).