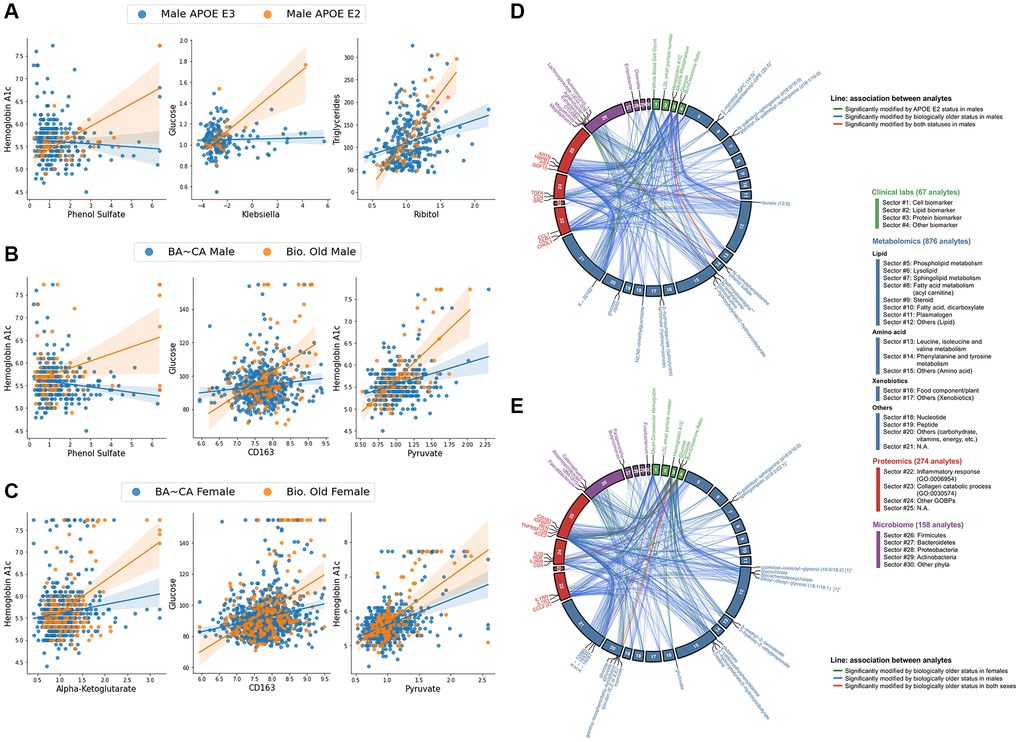
Figure 3.Biologically older males show similar multi-omic association signatures to APOE E2 males and biologically older females, particularly within central bioenergetic analytes. (A–C) Scatter plots of inter-omic analyte pairs with associations significantly modified by APOE E2 in males (A), and by biological oldness in males (B) and females (C). Line indicates simple linear regression, with shading indicating the 95% confidence interval. (D, E) Circos plots depicting the shared analyte associations (pFDR < 0.1, Benjamini-Hochberg method) between male APOE E2 and biologically older males (D), and between biologically older males and females (E). Associations specific to one group are connected with green and blue lines, whereas significant concordant associations shared in both groups are presented in red lines. Analyte nodes in associations significant to both groups are labeled.