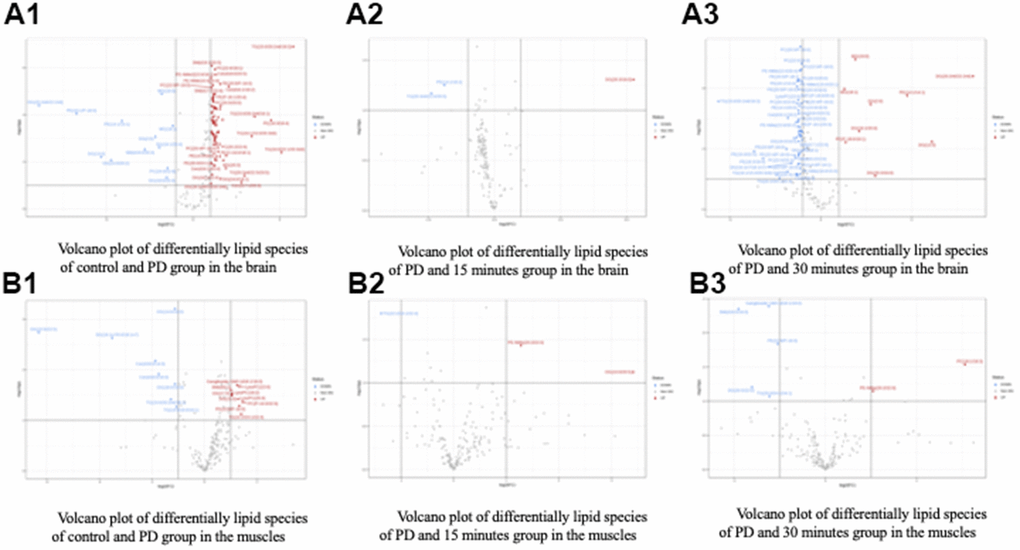
Figure 5.Volcano plot of differentially lipid species of control and treatment group in the (A) Brain and (B) Muscle. Control (C), Parkinson’s disease (PD).
Figure 5 — Treadmill intervention attenuates motor deficit with 6-OHDA-induced Parkinson’s disease rat via changes in lipid profiles in brain and muscle | Aging