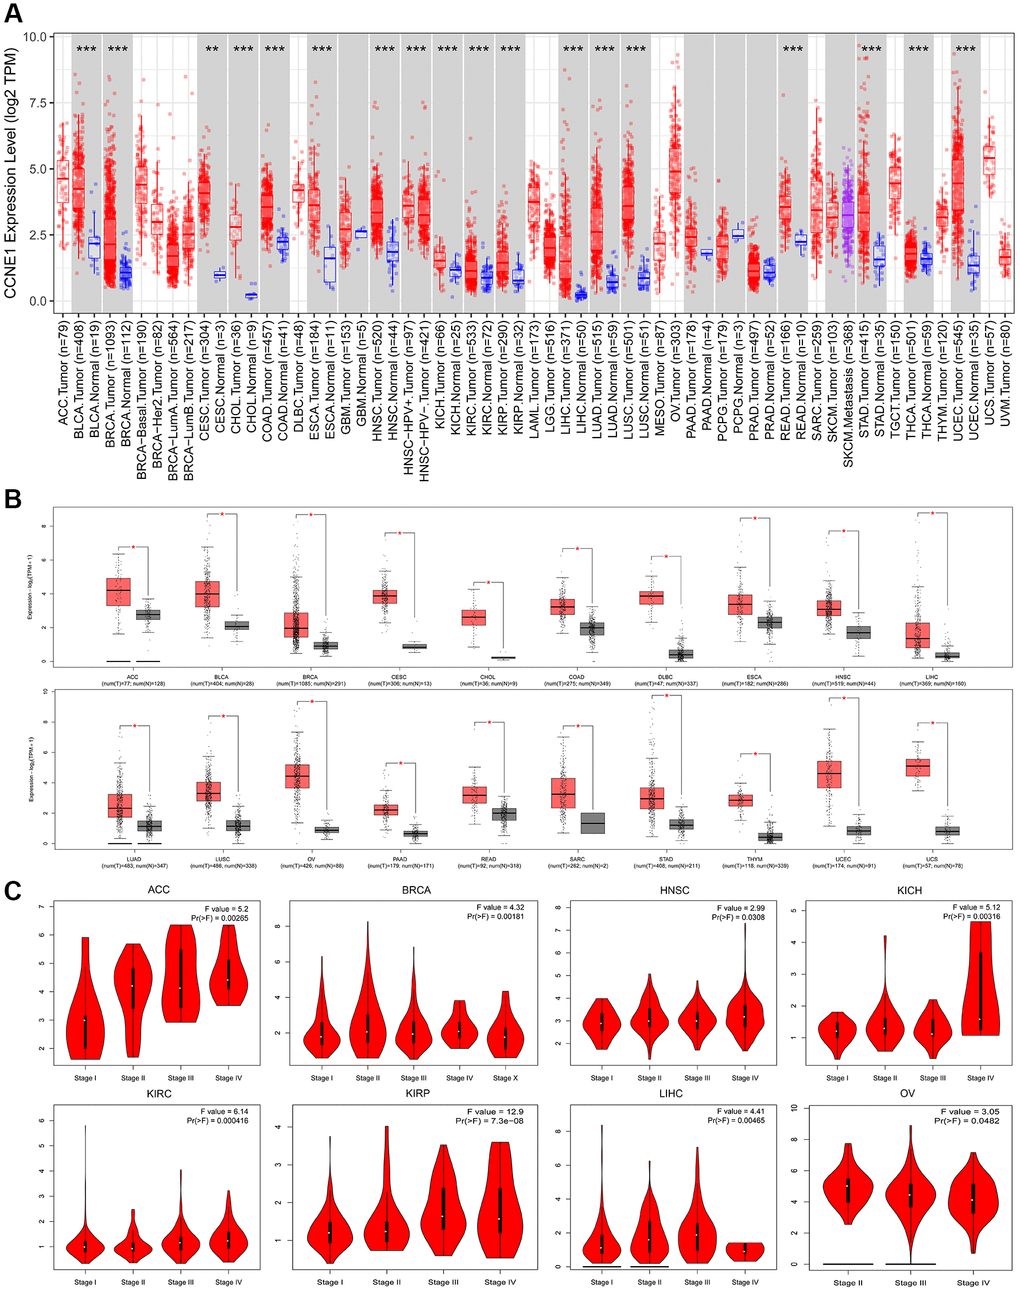
Figure 1.Expression of CCNE1 in different tumors and pathological stages. (A) The expression of CCNE1 in pan-cancer. The expression of CCNE1 in tumor tissue is indicated in red, while the expression of CCNE1 in normal tissue is shown in blue. (B) The expression status of CCNE1 in normal tissue and cancer tissue. The expression of CCNE1 in tumor tissue is indicated in red, while the expression of CCNE1 in normal tissue is shown in grey. (C) Correlation of CCNE1 with pathological stages in multiple cancers.