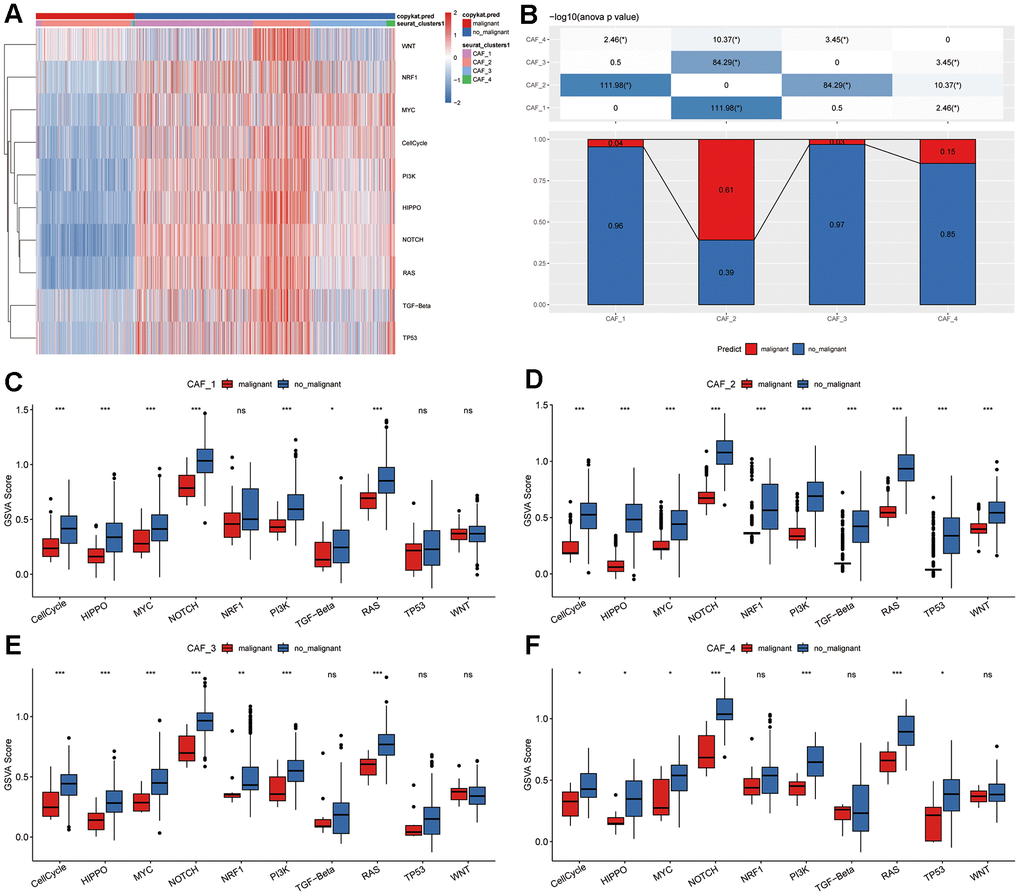
Figure 2.Tumor-related pathway characteristics in CAF clusters. (A) Heatmap illustrating GSVA scores for ten tumor-related pathways enriched in both malignant and non-malignant CAF cells. (B) Comparison of malignant and non-malignant cell proportions across different CAF clusters. Comparative analysis of GSVA scores for ten tumor-related pathways between malignant and non-malignant cells within (C) CAF_1, (D) CAF_2, (E) CAF_3, and (F) CAF_4 clusters. *P < 0.05; **P < 0.01; ***P < 0.001; ns, not statistically significant.