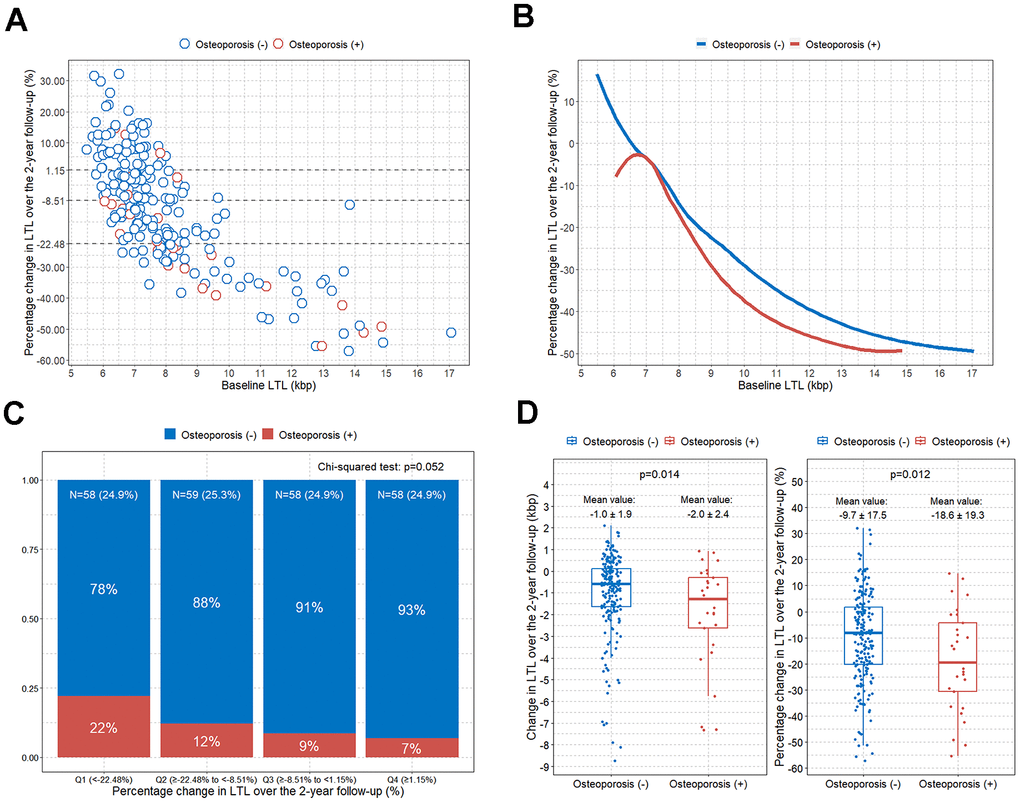
Figure 3.Comparison of change in LTL over the 2-year follow-up according to osteoporosis. (A) Scatterplot showing the associations between baseline LTL and percentage change in LTL over a 2-year follow-up (the dotted line divides the study participants into quartile groups); (B) LOWESS curves showing the trend between baseline LTL and percentage change in LTL over a 2-year follow-up according to osteoporosis; (C) bar plot showing the percentage of osteoporosis after dividing the participants into quartile groups according to the LTL percentage change over the 2-year follow-up; (D) boxplots with jitters showing comparison of changes in LTL over the 2-year follow-up according to osteoporosis. LOWESS, locally weighted scatter plot smoothing; LTL, leukocyte telomere length.